CALGARY, ALBERTA--(Marketwired - July 29, 2014) - Talisman Energy Inc. (TSX:TLM) (NYSE:TLM) reported its operating and unaudited financial results for the second quarter of 2014. All values are in US$ unless otherwise stated.
"During the past two years we have focused our efforts and capital on a strong portfolio of long life assets in our Americas and Asia-Pacific core regions," said Hal Kvisle, President and CEO. "We have invested to grow production and cash flow1 from our best assets, while working to reduce operating and overhead costs.
"Our year-over-year performance demonstrates solid progress and underlines the strength of our core regions. Total production and liquids volumes from ongoing operations within these areas have grown 12% and 23% respectively. Through disciplined capital investment and a focus on operational excellence, we have grown corporate cash flow by 8% year-over-year, driven by strong performance in our core regions. We remain on track to meet our operating and financial targets for 2014."
Second Quarter Highlights
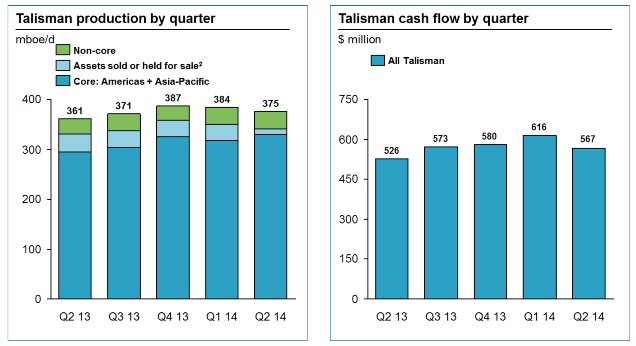
- Total production was 375,000 boe/d - up 4% year-over-year.
- Production from ongoing operations in the core regions was 330,000 boe/d, up 12% year-over-year and 4% from the previous quarter.
- Core region liquids production was 115,000 boe/d, up 20% year-over-year.
- North American liquids production was 45,000 bbls/d, up 36% year-over-year.
- Cash flow was $567 million, up 8% year-over-year.
To view the graph associated with this release, please visit the following link: http://media3.marketwire.com/docs/959417_graph.jpg
1 The term "cash flow" is a non-GAAP measure. Please see advisories and reconciliations elsewhere in this release.
2 Reflects announced and /or completed dispositions of Montney, Monkman, Ojay and Southeast Sumatra (see link to graph for associated footnote).
Second Quarter Summary
Talisman continues its evolution towards a two region company through focused capital investment and high grading of its portfolio. On a year-over-year basis, the company has grown total production from ongoing operations in its core regions by 12% and liquids production by 20%.
Capital spending3 during the quarter was $724 million and is in line with full year guidance of $3.2 billion. Proceeds from dispositions will continue to reduce corporate debt, maintaining a strong balance sheet as the company works to reduce its exposure to the North Sea and other non-core areas.
Talisman's North American operations delivered total production of 177,000 boe/d. Production from ongoing operations was 169,000 boe/d, reflecting the completed Monkman asset disposition and the previously announced disposition of the Ojay assets, expected to be completed in the third quarter. On a like-for-like basis, this represents an 18% increase year-over-year and a 7% increase from the previous quarter. Netbacks in North America grew 36% and cash flow grew approximately 40% year-over-year.
New wells in the Eagle Ford and successful rich gas development in Greater Edson contributed to total North American liquids production of 45,000 bbls/d, up 36% year-over-year. Compared to the previous quarter, liquids production is up 7% on increased volumes from the Eagle Ford.
In Colombia, production in the quarter was 20,500 boe/d, up 17% year-over-year and 5% from the previous quarter. In Block CPO-9, Talisman brought a ninth well onto long-term test and also completed a successful short-term flow test at the base of the Akacias reservoir, confirming the trend of mobile oil down-dip in the structure. Talisman has yet to encounter the oil-water contact in the reservoir.
Talisman's Southeast Asia operations delivered total production of 131,000 boe/d. Production from ongoing operations was 128,000 boe/d for the quarter. On a like-for-like basis, this reflects a 2% increase year-over-year and is consistent with the previous quarter. Oil and liquids netbacks grew 47% in the region over the same period last year due to high netback production from HST/HSD in Vietnam coming onstream in May 2013. The temporary shut-in of an inter-field pipeline at PM-3 in Malaysia was successfully lifted during the quarter. Impacts to production were largely offset by increased production from Corridor in Indonesia and increased liquids volumes from Kinabalu in Malaysia.
In the North Sea, Talisman's share of UK production was 19,500 boe/d, up 6% from the previous quarter and 12% on a year-over-year basis, largely due to the restart of production from the Claymore platform in the middle of the first quarter. In Norway, planned maintenance at Veslefrikk and Brage reduced production by 12% compared to the previous quarter, to 14,500 boe/d.
3 The term "capital spending" is a non-GAAP measure. Please see advisories and reconciliations elsewhere in this release.
Financial Results
For operational purposes, Talisman has two core operating areas: the Americas (North America and Colombia) and Asia-Pacific (Southeast Asia and Algeria). For the purposes of financial reporting, Talisman's activities are reported in four geographic segments: North America, Southeast Asia, North Sea and Other (Algeria and Colombia). The remainder of this press release is based on Talisman's geographic segments for the purposes of financial reporting. See the advisories elsewhere in this release for more information or visit Talisman's website at www.talisman-energy.com.
| June 30 | Q2 14 | Q1 14 | Q2 13 | ||
| Cash flow ($ million) | 567 | 616 | 526 | ||
| Cash flow per share4 | 0.55 | 0.60 | 0.51 | ||
| Earnings (loss) from operations ($ million)4 | (9 | ) | 79 | (27 | ) |
| Net income (loss) ($ million) | (237 | ) | 491 | 97 | |
| Net income (loss) per share | (0.23 | ) | 0.47 | 0.09 | |
| Average shares outstanding - basic (million) | 1,034 | 1,032 | 1,030 | ||
| Capital spending ($ million) | 724 | 768 | 843 | ||
| Dispositions ($ million, net of deal cost) | 52 | 1,340 | 99 | ||
| Net debt4($ million) | 4,227 | 3,813 | 4,590 |
Cash flow for the second quarter was $567 million, up 8% year-over-year and down 8% over the previous quarter. The quarter-on-quarter reduction was due largely to the impact of the sale of 123 mmcf/d of dry gas production associated with the Montney and Monkman assets in the first quarter and lower North American gas prices, partially offset by higher liquids volumes.
During the quarter the company recorded a net loss of $237 million. The primary driver for the loss was a $171 million movement relating to cash settlements ($46 million) and non-cash mark-to-market loss ($125 million) on commodity derivatives. In addition, the company lowered the credit adjusted discount rate applied to its asset retirement obligation liabilities across the portfolio by 100 basis points, resulting in an after-tax impairment of $50 million in the UK and $12 million in Norway.
The company recorded a loss of $9 million (on a non-GAAP basis) from operations, compared to earnings from operations of $79 million in the first quarter, mainly due to lower North American gas prices, partially offset by higher liquids volumes.
Talisman's ongoing disciplined capital program resulted in spending for the quarter of $724 million on a non-GAAP basis, down 14% year-over-year and down 6% from the previous quarter. Capital spending to date is in line with the company's expectations and full-year guidance of $3.2 billion.
Net debt at June 30, 2014 was approximately $4.2 billion, up from approximately $3.8 billion in the previous quarter. Talisman aims to divest $2 billion of long dated, non-core, capital intensive assets over the next 12-18 months. Proceeds from dispositions will be primarily used to maintain a strong balance sheet.
4 The terms "cash flow per share", "earnings (loss) from operations" and "net debt" are non-GAAP measures. Please see advisories and reconciliations elsewhere in this release.
Commodity Pricing and Netbacks
North Sea results include Norway and the company's proportionate results from TSEUK. Other results include Algeria, Colombia and the company's proportionate results from Equion. The company's realized sales price includes the impact of physical commodity contracts, but does not include the impact of the financial commodity price derivatives.
| June 30 | Q2 14 | Q1 14 | Q2 13 |
| Pricing | |||
| WTI benchmark ($/bbl) | 102.99 | 98.68 | 94.22 |
| Brent benchmark ($/bbl) | 109.63 | 108.22 | 102.44 |
| NYMEX benchmark ($/mmbtu) | 4.57 | 4.90 | 4.09 |
| Oil and liquids netbacks ($/bbl) | |||
| North America | 41.67 | 45.40 | 36.45 |
| Southeast Asia | 43.69 | 44.97 | 29.67 |
| North Sea | 14.02 | 21.80 | 17.96 |
| Other | 50.24 | 49.60 | 57.74 |
| Total oil and liquids netbacks ($/bbl) | 38.05 | 40.62 | 33.13 |
| Natural gas netbacks ($/mcf) | |||
| North America | 2.27 | 2.70 | 1.72 |
| Southeast Asia | 5.18 | 5.04 | 5.60 |
| North Sea | 5.28 | 4.78 | 13.71 |
| Other | 1.48 | 2.08 | 1.86 |
| Total natural gas netbacks ($/mcf) | 3.38 | 3.55 | 3.20 |
| Total company netback ($/boe) | 27.18 | 28.44 | 24.06 |
Pricing
In North America, Talisman's realized oil and liquids prices (excluding the impact of financial hedging) were flat compared to the same period last year and down 3% compared to the previous quarter, primarily due to increased NGL production resulting in a higher weighting to NGL prices in the realized liquids price. This was offset by higher realized liquids prices in Western Canada. In Southeast Asia, realized oil and liquids prices were consistent with movements in regional benchmark prices during the quarter and increased 10% year-over-year.
Realized natural gas prices in North America were up 11% year-over-year and down 11% compared to the previous quarter. The quarterly reduction was due to lower NYMEX and AECO prices and widening differentials in some markets over the same period. In Southeast Asia, realized natural gas prices decreased by 2% from the previous quarter.
Netbacks
Talisman's average gross netback was $27.18/boe, up 13% year-over-year and down 4% from the previous quarter. The quarter-on-quarter reduction was due to lower realized gas prices in North America, higher overall royalties due to increased production in higher royalty paying locations, and higher operating costs in the UK and Norway as a result of planned maintenance.
Gross oil and liquids netbacks were $38.05/boe, up 15% year-over-year and down 6% over the previous quarter, primarily due to higher operating costs and royalties. Talisman's gross natural gas netback was $3.38/boe, up 6% year-over-year and down 5% quarter-over-quarter due to fluctuations in North American gas prices.
Production
Table includes Talisman's share of production from subsidiaries and equity-accounted entities.
| June 30 | Q2 14 | Q1 14 | Q2 13 |
| Oil and liquids (mbbls/d) | |||
| North America | 45 | 42 | 33 |
| Southeast Asia | 45 | 44 | 43 |
| North Sea | 30 | 32 | 30 |
| Other (including Colombia and Algeria) | 25 | 24 | 20 |
| Total oil and liquids (mbbls/d) | 145 | 142 | 126 |
| Natural gas (mmcf/d) | |||
| North America | 795 | 867 | 846 |
| Southeast Asia | 515 | 522 | 519 |
| North Sea | 22 | 17 | 6 |
| Other (including Colombia and Algeria) | 48 | 46 | 43 |
| Total natural gas (mmcf/d) | 1,380 | 1,452 | 1,414 |
| Total mboe/d | 375 | 384 | 361 |
| Assets sold or held for sale (mboe/d) | |||
| North America5 | 8 | 28 | 32 |
| Southeast Asia6 | 3 | 3 | 4 |
| Total assets sold or held for sale (mboe/d) | 11 | 31 | 36 |
| Production from ongoing operations (mboe/d) | 364 | 353 | 325 |
| 5 | Includes Monkman - sale closed April 16, 2014, and Ojay - sales agreement in place and expected to close in 2014 (99% dry gas). |
| 6 | Includes Southeast Sumatra - sales agreement reached in December 2013, and Northwest Java - sold in May 2013. |
Total production averaged 375,000 boe/d in the quarter, up 4% year-over-year. This includes production of 11,000 boe/d in the quarter from the company's Monkman, Ojay and Southeast Sumatra assets that have either been sold or held for sale. Production from ongoing operations averaged 364,000 boe/d, up 12% year-over-year and 3% compared to the previous quarter.
Total production from Talisman's core Americas and Asia-Pacific businesses was 341,000 boe/d, up 3% over the same period last year. Production from ongoing operations from these core regions was 330,000 boe/d, up 12% year-over-year.
Total liquids production averaged 145,000 bbls/d, up 15% year-over-year and up 2% from the previous quarter, reflecting the company's continued focus on growing higher value liquids. In North America, total liquids production was up 36% year-over-year, to 45,000 bbls/d. In Southeast Asia, total liquids production was up 5% year-over-year, to 45,000 boe/d.
North American production from ongoing operations up 19%, liquids up 33% year-over-year
| June 30 | Q2 14 | Q1 14 | Q2 13 | |
| Gas | ||||
| Edson-Duvernay-Montney | 182 | 180 | 159 | |
| Marcellus | 469 | 440 | 426 | |
| Eagle Ford | 77 | 67 | 50 | |
| Other | 18 | 15 | 21 | |
| Gas from ongoing operations (mmcf/d) | 746 | 702 | 656 | |
| Liquids | ||||
| Edson-Duvernay-Montney | 12 | 11 | 5 | |
| Eagle Ford | 23 | 21 | 17 | |
| Chauvin | 10 | 10 | 11 | |
| Liquids from ongoing operations (mbbls/d) | 45 | 42 | 33 | |
| Total production from ongoing operations (mboe/d) | 169 | 158 | 142 | |
| Assets sold or held for sale (mmcf/d)7 | 49 | 165 | 190 | |
| Total North America production (mboe/d) | 177 | 186 | 174 | |
| 7 | Assets sold or held for sale in Q214 include Monkman - sale closed April 16, 2014, and Ojay - sales agreement in place and expected to close in 2014 (99% dry gas), and in Q114 include Montney - sale closed March 12, 2014, Monkman and Ojay. |
In North America, total production averaged 177,000 boe/d for the quarter. Production from ongoing operations averaged 169,000 boe/d, up 7% from the previous quarter and 19% year-over-year. The increase from the previous quarter was due to additional wells coming onstream in both the Marcellus and Eagle Ford. Year-over-year liquids production is up 36% on higher liquids volumes from the Eagle Ford and Greater Edson.
In the Eagle Ford, production averaged 36,000 boe/d in the quarter, up 13% over last quarter and 44% over the same period last year. Liquids volumes averaged 23,000 boe/d, up 35% compared to the same period last year and up 10% versus the previous quarter. Year-to-date, Talisman and its partner have drilled 29 wells and brought 45 wells onstream.
In the Marcellus, production for the quarter averaged 469 mmcf/d, up 7% from last quarter and 10% over the same period last year, as the company brought more wells onstream and further reduced cycle times versus plan through completion efficiencies. The company has reduced its inventory of drilled but uncompleted wells from 58 at the beginning of the year to 23.
In the Friendsville area of the Marcellus, 11 wells of a planned 24 net wells in 2014 have been drilled. Construction of key infrastructure projects in the area is ongoing, with production expected to come onstream in 2015. A second rig is expected to start drilling in the western part of the company's Marcellus acreage in the third quarter.
In the Greater Edson area (which includes Wild River), total production for the quarter was 47,000 boe/d. Liquids production averaged 11,000 bbls/d, in line with the previous quarter. Gas production from ongoing operations was 170 mmcf/d in the second quarter, up 11% compared to the same period last year and up 3% from the previous quarter, due to a successful horizontal drilling program.
Drilling activity in the quarter was reduced during spring break up, with one Wilrich well spud. The company now has seven Wilrich wells onstream, with average initial 30-day restricted production rates of 5.5 mmcf/d with 235 bbls/d of liquids net to Talisman. Two horizontal wells in the Dunvegan formation have also been drilled, with average initial 30-day production rates of 5.1 mmcf/d with 375 bbls/d of liquids net to Talisman. Following spring break up, the company resumed drilling activity in Greater Edson with two drilling rigs and plans to ramp-up to four rigs by year-end. In addition to the Wilrich and Dunvegan formations, the drilling program will be expanded to include wells targeting the Falher, Gething and Bluesky formations. Talisman expects third quarter production will be impacted by approximately 3,000 boe/d due to a planned turnaround at the Edson Gas Plant.
In the Duvernay, four wells have been drilled this year, including one in the Wild River area, one in Bigstone and two from a common surface location in the Ferrier area. Drilling operations are nearly finished at a fifth well in the Willesden Green area. Drilling performance has improved as the company gains operational experience in the play, with the second Ferrier well drilled from surface to a total depth of 5,700 metres in 27 days, and the Willesden Green well reaching total depth of 5,400 meters in 24 days. Both wells are pacesetters for the company in these areas of the Duvernay, despite each having longer lateral sections than any previous Duvernay wells drilled by Talisman.
In the Chauvin area, liquids production averaged 10,000 boe/d, consistent with the previous quarter and the same period last year. The company realized Western Canadian Select pricing of $83.01/bbl in the quarter, up 10% from the previous quarter. Talisman plans to drill approximately 30 wells in Chauvin before year-end.
Colombia production up 17% year-over-year
In Colombia, production averaged 20,500 boe/d, up 17% year-over-year and up 5% over the previous quarter. In the foothills region, the Equion joint venture averaged 16,500 boe/d. As part of the Piedemonte expansion project, five wells have been drilled, three more are currently drilling and two more wells are scheduled to spud later in 2014. Expansion of the processing plant at Piedemonte is progressing and is expected to be complete in the first quarter of 2015.
In Block CPO-9, nine of ten Akacias production wells have been put on long-term test, producing an average of approximately 7,500 bbls/d gross (3,400 bbls/d net to Talisman) of oil. During the quarter, production was intentionally reduced as improvements to the temporary production facilities began in an effort to accommodate longer term production. The operator is working to resume production to full potential over the third quarter. Until completed, Akacias production will be constrained to approximately 6,500 - 7,500 bbls/d gross (3,000 - 3,400 bbls/d net to Talisman).
A successful short-term flow test at the base of reservoir in the AK-20 appraisal well continued the trend of finding mobile oil down-dip on the structure and supports the previously reported best estimate of 2.5 billion barrels of mobile heavy oil in place. Longer term flow testing is required to determine the recovery factor and implications for recoverable resources. The partners are in the process of obtaining approval from the regulator to flow test two stratigraphic wells drilled down-dip of AK-20. To date, the oil-water contact in the reservoir has yet to be found. Talisman and its operating partner have submitted the first phase of the field development program, which would see the construction of a 50,000 boe/d facility. The Nueva Esperanza-1 well, along the same structural trend as the Akacias field, spudded July 18 and is drilling ahead. Additional wells are planned for 2015.
In Block CPE-6, five appraisal wells continued on long-term test and averaged approximately 500 bbls/d gross (250 bbls/d net to Talisman) in the second quarter. Technical evaluation will continue through the remainder of the year to determine future development plans.
Southeast Asia liquids production from ongoing operations up 10% year-over-year
| June 30 | Q2 14 | Q1 14 | Q2 13 |
| Indonesia liquids (mbbls/d) | 7 | 6 | 6 |
| Indonesia gas (mmcf/d) | 408 | 386 | 385 |
| Indonesia (mboe/d) | 74 | 71 | 72 |
| Malaysia liquids (mbbls/d) | 20 | 20 | 20 |
| Malaysia gas (mmcf/d) | 99 | 124 | 124 |
| Malaysia (mboe/d) | 37 | 40 | 40 |
| Vietnam liquids (mbbls/d) | 13 | 12 | 6 |
| Vietnam gas (mmcf/d) | 5 | 8 | 4 |
| Vietnam (mboe/d) | 14 | 14 | 7 |
| Australia (mboe/d) | 3 | 3 | 7 |
| Total production from ongoing operations (mboe/d) | 128 | 128 | 126 |
| Assets sold or held for sale (mboe/d)8 | 3 | 3 | 4 |
| Southeast Asia total (mboe/d) | 131 | 131 | 130 |
| 8 | Includes Northwest Java - sold May 2013, and Southeast Sumatra - sales agreement reached in December 2013. |
Total production in Southeast Asia averaged 131,000 boe/d in the quarter, consistent with the previous period. Production from ongoing operations averaged 128,000 boe/d, consistent with the previous quarter following stable gas demand from Corridor in Indonesia and additional liquids production at Kinabalu through successful infill drilling and improved uptime. This was offset by lower gas production from PM-3 in Malaysia following the temporary shut-in of an inter-field pipeline. Liquids production from ongoing operations was 43,000 bbls/d, up 10% year-over-year.
In Indonesia, production from ongoing operations averaged 74,000 boe/d, up over both the same period last year and the previous quarter, with stable gas demand and the completion of facility upgrade projects at Corridor in 2013. Two infill wells at Corridor are expected to spud later this year. At the Tangguh LNG project, the Fujian pricing contract (applicable to one-third of Tangguh sales) was successfully renegotiated, resulting in a price increase for this year and escalating annually through 2017. At Sakakemang, Talisman expects to begin a 2D and 3D seismic program later this year and drill an exploration well in 2015.
In Malaysia, production averaged 37,000 boe/d for the quarter, down 8% over the previous quarter and the same period last year, after a partial shut-in of an inter-field pipeline at PM-3 as a precautionary measure over potential corrosion concerns. The pipeline returned to full capacity in June following testing and is expected to remain in service through to its full replacement planned for next year. Also at PM-3, a multi-well drilling campaign is ongoing, with a follow-up appraisal well to a new oil pool discovery encountering an 18-metre oil column. Early in the third quarter, a two-week turnaround at PM-3 was successfully completed.
At Kinabalu, production averaged 6,000 boe/d during the quarter, up 50% over the prior period due to increased operating efficiency and a successful infill drilling campaign. Drilling is currently underway on the sixth and final infill well, with the first five wells adding over 6,000 boe/d of oil production.
In Vietnam, production averaged 14,000 boe/d, up significantly over the prior year following the startup of HST/HSD in May 2013. Due to high netbacks and strong reservoir performance, the additional barrels Talisman is realizing through its carry recovery will expire early in the third quarter of this year. The company expects production post carry recovery to be approximately 9,000 boe/d, in line with its equity participation. In the Nam Con Son basin, Talisman is planning to start the first of a two-well exploration program in the second half of 2014 on the Red Emperor extension in Blocks 135 and 136.
In Papua New Guinea (PNG), the government granted PDL10 and PL10 licenses during the quarter, awarding regulatory approval to Talisman and its partners to proceed with the Stanley liquids and domestic gas project. The first development well spud in June and drilling is progressing. Elsewhere in PNG, the Manta-1 well in PPL 426 tested at 42 mmcf/d in the Elevala sandstone, while the NW Koko well tested at 48 mmscf/d in the Elevala sandstone and also flowed oil from the Kimu sandstone.
Algeria
In Algeria, production averaged 12,000 boe/d during the second quarter, in line with the previous quarter. Production was up 33% compared to the same period last year with EMK commencing production in 2013, offset by production restrictions imposed by the regulator last year.
Other Operating Areas
North Sea
In the UK North Sea, Talisman's share of production was 19,500 boe/d, up 6% from the previous quarter and 12% on a year-over-year basis, largely due to the restart of production from the Claymore platform in the middle of the first quarter.
In Norway, planned maintenance at Veslefrikk and Brage reduced production 12% compared to the previous quarter, to 14,500 boe/d.
Kurdistan Region of Iraq
In the Topkhana Block, testing continues on the T-2 well and is expected to be complete in the coming days. In the Kurdamir Block, Talisman continues to evaluate next steps after the completion of the K-2 extended well test.
Common Share and Preferred Share Dividend Declaration
The company has declared a quarterly dividend on the company's common shares of US$0.0675 per share. The dividend will be paid on September 30, 2014 to shareholders of record at the close of business on September 15, 2014.
The company has also declared a quarterly dividend of C$0.2625 per share on its Cumulative Redeemable Rate Reset First Preferred Shares, Series 1. The dividend will be paid on September 30, 2014 to shareholders of record at the close of business on September 15, 2014.
Conference Call
A conference call and webcast for investors, analysts and media will be held at 1 p.m. MT (3 p.m. ET), July 29, 2014 to discuss results. Participants will include Hal Kvisle, Chief Executive Officer, and members of senior management. A transcript of this call will be available on the Talisman Energy website at www.talisman-energy.com.
Talisman Energy Inc. is a global upstream oil and gas company, headquartered in Canada. Talisman has two core operating areas: the Americas (North America and Colombia) and Asia-Pacific. Talisman is committed to conducting business safely, in a socially and environmentally responsible manner, and is included in the Dow Jones Sustainability (North America) Index. Talisman is listed on the Toronto and New York stock exchanges under the symbol TLM. Please visit our website at www.talisman-energy.com.
Forward-Looking Information
This news release contains information that constitutes "forward-looking information" or "forward-looking statements" (collectively "forward-looking information") within the meaning of applicable securities legislation. This forward-looking information includes, among others, statements regarding: business strategy, priorities and plans; expected production; expected capital spending; anticipated asset sales and/or joint ventures, targeted value and timing of such sales, and expected use of proceeds; planned drilling, spudding, seismic and other exploration and development activities; expected timing of the Piedemonte processing plant, expected expiry of carry at HST/HSD; and other expectations, beliefs, plans, goals, objectives, assumptions, information and statements about possible future events, conditions, results of operations or performance. The company priorities and goals disclosed in this news release are objectives only and the achievement of these objectives cannot be guaranteed.
The factors or assumptions on which the forward-looking information is based include: assumptions inherent in current guidance; projected capital investment levels; the flexibility of capital spending plans and the associated sources of funding; the successful and timely implementation of capital projects; the continuation of tax, royalty and regulatory regimes; ability to obtain regulatory and partner approval; commodity price and cost assumptions; and other risks and uncertainties described in the filings made by the Company with securities regulatory authorities. The Company believes the material factors, expectations and assumptions reflected in the forward-looking information are reasonable but no assurance can be given that these factors, expectations and assumptions will prove to be correct. Forward-looking information for periods past 2014 assumes escalating commodity prices. Closing of any transactions will be subject to receipt of all necessary regulatory approvals and completion of definitive agreements.
Undue reliance should not be placed on forward-looking information. Forward-looking information is based on current expectations, estimates and projections that involve a number of risks which could cause actual results to vary and in some instances to differ materially from those anticipated by Talisman and described in the forward-looking information contained in this news release. The material risk factors include, but are not limited to: the risks of the oil and gas industry, such as operational risks in exploring for, developing and producing crude oil and natural gas; risks and uncertainties involving geology of oil and gas deposits; risks associated with project management, project delays and/or cost overruns; uncertainty related to securing sufficient egress and access to markets; the uncertainty of reserves and resources estimates, reserves life and underlying reservoir risk; the uncertainty of estimates and projections relating to production, costs and expenses, including decommissioning liabilities; risks related to strategic and capital allocation decisions, including potential delays or changes in plans with respect to exploration or development projects or capital expenditures; fluctuations in oil and gas prices, foreign currency exchange rates, interest rates and tax or royalty rates; the outcome and effects of any future acquisitions and dispositions; health, safety, security and environmental risks, including risks related to the possibility of major accidents; environmental regulatory and compliance risks, including with respect to greenhouse gases and hydraulic fracturing; uncertainties as to access to capital, including the availability and cost of credit and other financing, and changes in capital markets; risks in conducting foreign operations (for example, civil, political and fiscal instability and corruption); risks related to the attraction, retention and development of personnel; changes in general economic and business conditions; the possibility that government policies, regulations or laws may change or governmental approvals may be delayed or withheld; and results of the Company's risk mitigation strategies, including insurance and any hedging activities.
The foregoing list of risk factors is not exhaustive. Additional information on these and other factors which could affect the Company's operations or financial results or strategy are included in Talisman's most recent Annual Information Form. In addition, information is available in the Company's other reports on file with Canadian securities regulatory authorities and the United States Securities and Exchange Commission. Forward-looking information is based on the estimates and opinions of the Company's management at the time the information is presented. The Company assumes no obligation to update forward-looking information should circumstances or management's estimates or opinions change, except as required by law.
As used in the context of the Company's Colombian assets, long-term testing indicates continuous well production going to market at the most recent weekly average. A permit for long term testing is required for a well to produce oil until the permit for full field development has been granted.
Oil and Gas Information
Throughout this news release, Talisman makes reference to production volumes. Unless otherwise stated, such production volumes are stated on a gross basis, which means they are stated on a Company interest basis prior to the deduction of royalties and similar payments. In the US, net production volumes are reported after the deduction of these amounts.
Barrel of oil equivalent (boe) throughout this news release is calculated at a conversion rate of six thousand cubic feet (mcf) of natural gas for one barrel of oil (bbl). This news release also includes reference to mcf equivalents (mcfes) which are calculated at a conversion rate of one barrel of oil to 6,000 cubic feet of gas. Boes and mcfes may be misleading, particularly if used in isolation. A boe conversion ratio of 6 mcf:1 bbl and an mcfe conversion ratio of 1 bbl: 6 mcf are based on an energy equivalence conversion method primarily applicable at the burner tip and does not represent a value equivalency at the wellhead.
In this news release, all references to "core" and "non-core" assets and properties align with the company's current public disclosure regarding its assets and properties.
Talisman also discloses netbacks in this news release. Netbacks per boe are calculated by deducting from the sales price associated royalties, operating and transportation costs.
In this news release, Talisman discloses average cumulative well test results for seven wells drilled into the Wilrich formation in Edson, Alberta, two wells drilled into the Dunvegan formation in Edson, Alberta, and two wells drilled into the Elevala sandstone formation in Papua New Guinea
The production tests' actual flow period durations were approximately 30 days. The average rate of flow for the seven wells in the Wilrich formation was approximately 5.5 mmcf/d of gas with 235 bbls/d of total liquids net to Talisman The wells produced natural gas with an average 60° API for condensate. No significant production or pressure decline was observed on the tests. The average rate of flow for the two wells in the Dunvegan formation was approximately 5.1 mmcf/d of gas with 375 bbls/d of liquids net to Talisman. The wells produced natural gas with an average 57° API for condensate. No significant production or pressure decline was observed on the tests. The production tests in Papua New Guinea ran over a period of 9.4 days for Manta-1 and 8.7 days for NW Koko-1, with the main flow period durations being approximately 2.5 days for Manta-1 and 2.6 days for NW Koko-1. The average rate of flow for the wells during the main flow period was approximately 21 mmcf/d for Manta-1 & 28 mmcf/d for NW Koko-1 of gas and ~0.04 bbls/mmcf of condensate for Manta-1 and ~0.1 bbl/mmscf of condensate for NW Koko-1. Manta-1 produced natural gas of 0.63 SG with an average 35° API of condensate. NW Koko-1 produced natural gas of 0.59 SG with an average 35° API of condensate. No significant production or pressure decline was observed on the tests. This data should be considered to be preliminary until a pressure transient analysis and/or well-flow test interpretation has been done. The test results are not necessarily indicative of long-term performance or ultimate recovery.
Non-GAAP Financial Measures
Included in this news release are references to financial measures commonly used in the oil and gas industry such as cash flow, earnings (loss) from operations, capital spending and net debt. These terms are not defined by International Financial Reporting Standards (IFRS). Consequently, these are referred to as non-GAAP measures. Talisman's reported results of such measures may not be comparable to similarly titled measures reported by other companies.
Cash Flow
| Three Months Ended | ||||||||||
| June 30, 2014 | March 31, 2014 | December 31, 2013 | September 30, 2013 | June 30, 2013 | ||||||
| Cash provided by operating activities | 365 | 471 | 442 | 637 | 357 | |||||
| Changes in non-cash working capital | 167 | 104 | 80 | (166 | ) | 61 | ||||
| Add: Exploration expenditure | 57 | 52 | 52 | 66 | 67 | |||||
| Add: Restructuring costs | 14 | 3 | 10 | 6 | 11 | |||||
| Add: Income tax adjustments1 | - | - | - | - | 15 | |||||
| Add: Current tax on disposal2 | - | - | 51 | - | - | |||||
| Less: Dividends and distributions received from equity-accounted entities | - | - | (21 | ) | (37 | ) | - | |||
| Less: Finance costs (cash) | (76 | ) | (76 | ) | (77 | ) | (77 | ) | (71 | ) |
| Cash flow from subsidiaries | 527 | 554 | 537 | 429 | 440 | |||||
| Add: Cash provided by operating activities from equity-accounted entities | 82 | (26 | ) | 58 | 86 | 124 | ||||
| Change in non-cash working capital from equity-accounted entities | (34 | ) | 93 | (9 | ) | 54 | (38 | ) | ||
| Add: Exploration expenditure from equity-accounted entities | 1 | 2 | - | 11 | 5 | |||||
| Less: Finance costs (cash) from equity-accounted entities | (9 | ) | (7 | ) | (6 | ) | (7 | ) | (5 | ) |
| Cash flow from equity- accounted entities | 40 | 62 | 43 | 144 | 86 | |||||
| Cash Flow3 | 567 | 616 | 580 | 573 | 526 | |||||
| Cash flow per share | 0.55 | 0.60 | 0.56 | 0.56 | 0.51 | |||||
| Diluted cash flow per share | 0.55 | 0.59 | 0.56 | 0.55 | 0.51 | |||||
- A court ruling in Southeast Asia indicated an additional current income tax of $31 million be charged during Q2 2013. In addition, the company recorded a $16 million benefit from the resolution of a tax position in North America in Q2 2013.
- Current tax on the gain on disposal of Talisman's equity interest in the Ocensa pipeline in Colombia in Q4 2013.
- Includes cash flow from subsidiaries and Talisman's share of equity-accounted entities' cash flow.
Cash flow, as commonly used in the oil and gas industry, represents net income before exploration costs, DD&A, deferred taxes and other non-cash expenses, including Talisman's share of cash flow from equity- accounted entities. Cash flow is used by the company to assess operating results between years and between peer companies using different accounting policies. Cash flow should not be considered an alternative to, or more meaningful than, cash provided by operating, investing and financing activities or net income as determined in accordance with IFRS as an indicator of the company's performance or liquidity. Cash flow per share is cash flow divided by the average number of common shares outstanding during the period. Diluted cash flow per share is cash flow divided by the diluted number of common shares outstanding during the period, as reported in the interim condensed Consolidated Financial Statements filed on July 29, 2014. A reconciliation of cash provided by operating activities to cash flow is provided above.
Capital Spending
| Three Months Ended | |||
| June 30, 2014 | March 31, 2014 | June 30, 2013 | |
| Subsidiaries | |||
| Exploration, development and other | 470 | 547 | 649 |
| Exploration expensed | 57 | 52 | 67 |
| Exploration and development spending - subsidiaries | 527 | 599 | 716 |
| Talisman's share of equity- accounted entities | |||
| Exploration, development and other | 196 | 167 | 122 |
| Exploration expensed | 1 | 2 | 5 |
| Exploration and development spending - joint ventures | 197 | 169 | 127 |
| Capital spending for subsidiaries and joint ventures | 724 | 768 | 843 |
Capital spending is calculated by adjusting the capital expenditure per the interim condensed Consolidated Financial Statements for exploration costs that were expensed as incurred and adding Talisman's share of joint ventures.
Earnings (loss) from Operations
| Three Months Ended | ||||||
| June 30, 2014 | March 31, 2014 | June 30, 2013 | ||||
| Net income (loss) | (237 | ) | 491 | 97 | ||
| Gain on disposals (tax adjusted) | (1 | ) | (486 | ) | (45 | ) |
| Unrealized (gain) loss on financial instruments(tax adjusted)1 | 120 | 1 | (193 | ) | ||
| Share-based payments (tax adjusted)2 | 15 | (32 | ) | (4 | ) | |
| Foreign exchange on debt (tax adjusted) | 10 | 3 | 4 | |||
| Impairment (tax adjusted) | 39 | 107 | 7 | |||
| Restructuring costs (tax adjusted) | 14 | 2 | 8 | |||
| Income tax adjustment3 | - | - | 41 | |||
| Derecognition of deferred tax asset4 | 6 | - | - | |||
| Deferred tax adjustments5 | 25 | (7 | ) | 58 | ||
| Earnings (loss) from operations6 | (9 | ) | 79 | (27 | ) | |
- Unrealized (gain) loss on financial instruments relates to the change in the period of the mark-to-market value of the Company's held-for-trading financial instruments.
- Share-based payments relates to the mark-to-market value of the Company's outstanding stock options and cash units at June 30. The Company's share-based payments expense is based on the difference between the Company's share price and its stock options or cash units exercise price. The Company uses the Black-Scholes option pricing model to estimate the fair value of its share-based payment plans.
- A court ruling in Southeast Asia indicated an additional income tax of $57 million be charged during Q2 2013. In addition, the company recorded a $16 million benefit from the resolution of a tax position in North America in Q2 2013.
- During Q2 2014, the Company derecognized deferred tax assets in Australia.
- Deferred tax adjustments largely comprise tax on foreign exchange on tax pools.
- Earnings (loss) from operations include results and adjustments from subsidiaries and Talisman's share of equity accounted entities.
Earnings (loss) from operations are calculated by adjusting the company's net income (loss) per the interim condensed Consolidated Financial Statements for certain items of a non-operational nature, on an after-tax basis. The adjustments include items from subsidiaries and Talisman's share of equity accounted entities. The company uses this information to evaluate performance of core operational activities on a comparable basis between periods. A reconciliation of net income (loss) to earnings (loss) from operations is provided above.
Net Debt
| As at | |||||||||
| June 30, 2014 | March 31, 2014 | December 31, 2013 | June 30, 2013 |
||||||
| Long-term debt | 4,690 | 4,365 | 5,239 | 4,923 | |||||
| Cash and cash equivalents, net of bank indebtedness | (352 | ) | (515 | ) | (351 | ) | (232 | ) | |
| Cash and cash equivalents from equity accounted entities1 | |||||||||
| TSEUK | (47 | ) | 5 | (21 | ) | (41 | ) | ||
| Equion | (64 | ) | (42 | ) | (34 | ) | (60 | ) | |
| Total net debt | 4,227 | 3,813 | 4,833 | 4,590 | |||||
- Includes Talisman's share of equity-accounted entities' cash and cash equivalents.
Net debt is calculated by adjusting the company's long-term debt per the interim condensed Consolidated Financial Statements for bank indebtedness, cash and cash equivalents from subsidiaries and joint ventures. The company uses this information to assess its true debt position and eliminate the impact of timing differences.
Sensitivities
Talisman's financial performance is affected by factors such as changes in production volumes, commodity prices and exchange rates. The estimated annualized impact of these factors for 2014 (excluding the effect of derivative contracts) is summarized in the following table, based on a Dated Brent oil price of approximately $105/bbl, a NYMEX natural gas price of approximately $4.45/mmbtu and exchange rates of US$0.90=C$1 and UK£1=US$1.65.
| (millions of $) | Net Income1 | Cash Provided by Operating Activities (GAAP2 | ) | Cash Flow (Non-GAAP3 | ) | |
| Volume changes | ||||||
| Oil - 10,000 bbls/d | 70 | 135 | 190 | |||
| Natural gas - 60 mmcf/d | 15 | 65 | 65 | |||
| Price changes4 | ||||||
| Oil - $1.00/bbl | 20 | 5 | 30 | |||
| Natural gas (North America)5 - $0.10/mcf | 15 | 5 | 25 | |||
| Exchange rate changes | ||||||
| US$/C$ decreased by US$0.01 | (5 | ) | (5 | ) | (5 | ) |
| US$/UK£ increased by US$0.02 | - | - | 5 |
- Net income includes Talisman's share of net income (loss) from TSEUK and Equion, after tax.
- Changes in cash flow provided by operating activities (GAAP) excludes TSEUK and Equion due to the application of equity accounting.
- Changes in cash flow (Non-GAAP) includes TSEUK and Equion and is included for comparative purposes only.
- The impact of price changes excludes the effect of commodity derivatives. See specific commodity derivative terms in the 'Risk Management' section of the MD&A, and note 16 to the interim condensed Consolidated Financial Statements filed on July 29, 2014.
- Price sensitivity on natural gas relates to North American natural gas only. The company's exposure to changes in the natural gas prices in Norway and Malaysia/Vietnam and Colombia is not material. Most of the natural gas price in Indonesia is based on the price of crude oil and, accordingly, has been included in the price sensitivity for oil except for a small portion which is sold at a fixed price.
| Talisman Energy Inc. | |||||||
| Highlights | |||||||
| (unaudited) | |||||||
| Three months ended June 30 | Six months ended June 30 | ||||||
| 2014 | 2013 | 2014 | 2013 | ||||
| Financial | |||||||
| (millions of US$ unless otherwise stated) | |||||||
| Cash flow (1) | 567 | 526 | 1,183 | 1,043 | |||
| Net income (loss) | (237 | ) | 97 | 254 | (116 | ) | |
| Capital Spending (1) | 724 | 843 | 1,492 | 1,618 | |||
| Per common share (US$) | |||||||
| Cash flow (1) | 0.55 | 0.51 | 1.15 | 1.01 | |||
| Net income (loss) | (0.23 | ) | 0.09 | 0.24 | (0.12 | ) | |
| Production (3) | |||||||
| (Daily Average - Gross) | |||||||
| Oil and liquids (bbls/d) | |||||||
| North America | 44,776 | 32,675 | 43,310 | 30,785 | |||
| Southeast Asia | 44,963 | 43,116 | 44,521 | 42,115 | |||
| North Sea | 30,872 | 29,506 | 31,542 | 33,364 | |||
| Other | 24,949 | 20,251 | 24,400 | 21,016 | |||
| Total oil and liquids | 145,560 | 125,548 | 143,773 | 127,280 | |||
| Natural gas (mmcf/d) | |||||||
| North America | 795 | 846 | 831 | 861 | |||
| Southeast Asia | 515 | 519 | 518 | 525 | |||
| North Sea | 22 | 6 | 19 | 11 | |||
| Other | 48 | 43 | 47 | 41 | |||
| Total natural gas | 1,380 | 1,414 | 1,415 | 1,438 | |||
| Total mboe/d (2) | 375 | 361 | 380 | 367 | |||
| Prices (3) | |||||||
| Oil and liquids (US$/bbl) | |||||||
| North America | 66.11 | 65.84 | 67.04 | 64.92 | |||
| Southeast Asia | 110.99 | 101.07 | 110.67 | 106.54 | |||
| North Sea | 108.61 | 103.34 | 107.61 | 108.68 | |||
| Other | 105.02 | 94.78 | 103.63 | 106.24 | |||
| Total oil and liquids | 95.66 | 91.42 | 95.66 | 96.99 | |||
| Natural gas (US$/mcf) | |||||||
| North America | 4.35 | 3.92 | 4.62 | 3.62 | |||
| Southeast Asia | 8.94 | 9.51 | 9.04 | 9.87 | |||
| North Sea | 7.51 | 24.01 | 8.30 | 13.87 | |||
| Other | 3.88 | 4.11 | 3.99 | 4.37 | |||
| Total natural gas | 6.10 | 6.06 | 6.27 | 6.00 | |||
| Total (US$/boe) (2) | 59.49 | 55.50 | 59.58 | 57.14 | |||
| (1) | Cash flow, capital spending and cash flow per share are non-GAAP measures. |
| (2) | Barrels of oil equivalent (boe) is calculated at a conversion rate of six thousand cubic feet (mcf) of natural gas for one barrel of oil. |
| (3) | Production and realized prices include Talisman's proportionate results from Talisman Sinopec Energy UK Limited (TSEUK) and Equion Energia Limited (Equion). |
| Talisman Energy Inc. | |||
| Consolidated Balance Sheets | |||
| (Unaudited) | |||
| June 30, | December 31, | ||
| (millions of US$) | 2014 | 2013 | |
| Assets | |||
| Current | |||
| Cash and cash equivalents | 356 | 364 | |
| Accounts receivable | 1,060 | 1,117 | |
| Risk management | 22 | 17 | |
| Income and other taxes receivable | 57 | 52 | |
| Restricted cash | 125 | 121 | |
| Inventories | 175 | 137 | |
| Prepaid expenses | 26 | 14 | |
| Assets held for sale | 134 | 776 | |
| 1,955 | 2,598 | ||
| Other assets | 184 | 160 | |
| Restricted cash | 61 | 94 | |
| Investments | 1,535 | 1,204 | |
| Risk management | 16 | 20 | |
| Goodwill | 568 | 575 | |
| Property, plant and equipment | 9,603 | 9,752 | |
| Exploration and evaluation assets | 3,138 | 3,165 | |
| Deferred tax assets | 1,694 | 1,593 | |
| 16,799 | 16,563 | ||
| Total assets | 18,754 | 19,161 | |
| Liabilities | |||
| Current | |||
| Bank indebtedness | 4 | 13 | |
| Accounts payable and accrued liabilities | 1,652 | 1,835 | |
| Current portion of Yme removal obligation | 125 | 121 | |
| Risk management | 180 | 101 | |
| Income and other taxes payable | 94 | 155 | |
| Loans from joint ventures | 306 | 288 | |
| Current portion of long-term debt | 696 | 882 | |
| Liabilities associated with assets held for sale | 57 | 160 | |
| 3,114 | 3,555 | ||
| Decommissioning liabilities | 1,824 | 1,727 | |
| Yme removal obligation | 98 | 131 | |
| Other long-term obligations | 270 | 246 | |
| Risk management | 86 | 37 | |
| Long-term debt | 3,994 | 4,357 | |
| Deferred tax liabilities | 681 | 553 | |
| 6,953 | 7,051 | ||
| Shareholders' equity | |||
| Common shares | 1,759 | 1,723 | |
| Preferred shares | 191 | 191 | |
| Contributed surplus | 124 | 135 | |
| Retained earnings | 5,802 | 5,695 | |
| Accumulated other comprehensive income | 811 | 811 | |
| 8,687 | 8,555 | ||
| Total liabilities and shareholders' equity | 18,754 | 19,161 | |
| Talisman Energy Inc. | |||||||||
| Consolidated Statements of Income (Loss) | |||||||||
| (Unaudited) | |||||||||
| Three months ended | Six months ended | ||||||||
| June 30, | June 30, | ||||||||
| (millions of US$) | 2014 | 2013 | 2014 | 2013 | |||||
| Revenue | |||||||||
| Sales | 1,248 | 1,152 | 2,535 | 2,250 | |||||
| Other income | 31 | 15 | 79 | 42 | |||||
| Income (loss) from joint ventures and associates, after tax | (37 | ) | 23 | (31 | ) | 21 | |||
| Total revenue and other income | 1,242 | 1,190 | 2,583 | 2,313 | |||||
| Expenses | |||||||||
| Operating | 351 | 381 | 712 | 710 | |||||
| Transportation | 44 | 51 | 93 | 102 | |||||
| General and administrative | 105 | 111 | 210 | 214 | |||||
| Depreciation, depletion and amortization | 480 | 464 | 949 | 885 | |||||
| Impairment (impairment reversals) | 28 | (9 | ) | 158 | (2 | ) | |||
| Dry hole | 12 | 69 | 28 | 69 | |||||
| Exploration | 57 | 67 | 109 | 142 | |||||
| Finance costs | 90 | 79 | 181 | 157 | |||||
| Share-based payments expense (recovery) | 25 | 2 | (7 | ) | 24 | ||||
| (Gain) loss on held-for-trading financial instruments | 171 | (221 | ) | 231 | (141 | ) | |||
| (Gain) loss on disposals | 5 | (59 | ) | (554 | ) | (59 | ) | ||
| Other, net | 37 | 18 | 45 | 24 | |||||
| Total expenses | 1,405 | 953 | 2,155 | 2,125 | |||||
| Income (loss) before taxes | (163 | ) | 237 | 428 | 188 | ||||
| Income taxes | |||||||||
| Current income tax | 129 | 139 | 260 | 286 | |||||
| Deferred income tax (recovery) | (55 | ) | 1 | (86 | ) | 18 | |||
| 74 | 140 | 174 | 304 | ||||||
| Net income (loss) | (237 | ) | 97 | 254 | (116 | ) | |||
| Per common share (US$): | |||||||||
| Net income (loss) | (0.23 | ) | 0.09 | 0.24 | (0.12 | ) | |||
| Diluted net income (loss) | (0.24 | ) | 0.06 | 0.19 | (0.14 | ) | |||
| Weighted average number of common shares outstanding (millions) | |||||||||
| Basic | 1,034 | 1,030 | 1,033 | 1,029 | |||||
| Diluted | 1,034 | 1,033 | 1,039 | 1,033 | |||||
| Talisman Energy Inc. | |||||||||
| Consolidated Statements of Cash Flows | |||||||||
| (Unaudited) | |||||||||
| Three months ended | Six months ended | ||||||||
| June 30, | June 30, | ||||||||
| (millions of US$) | 2014 | 2013 | 2014 | 2013 | |||||
| Operating activities | |||||||||
| Net income (loss) | (237 | ) | 97 | 254 | (116 | ) | |||
| Add: Finance costs (cash and non-cash) | 90 | 79 | 181 | 157 | |||||
| Items not involving cash | 679 | 242 | 672 | 729 | |||||
| 532 | 418 | 1,107 | 770 | ||||||
| Changes in non-cash working capital | (167 | ) | (61 | ) | (271 | ) | (82 | ) | |
| Cash provided by operating activities | 365 | 357 | 836 | 688 | |||||
| Investing activities | |||||||||
| Capital expenditures | |||||||||
| Exploration, development and other | (470 | ) | (649 | ) | (1,017 | ) | (1,218 | ) | |
| Proceeds of resource property dispositions | 52 | 99 | 1,392 | 99 | |||||
| Yme removal obligation | 13 | (7 | ) | 29 | 275 | ||||
| Restricted cash | (13 | ) | 7 | (29 | ) | (238 | ) | ||
| Investments | - | - | - | (7 | ) | ||||
| Loan to joint venture | (178 | ) | (19 | ) | (350 | ) | (89 | ) | |
| Changes in non-cash working capital | (92 | ) | (31 | ) | (42 | ) | (115 | ) | |
| Cash used in investing activities | (688 | ) | (600 | ) | (17 | ) | (1,293 | ) | |
| Financing activities | |||||||||
| Long-term debt repaid | (2 | ) | (4 | ) | (879 | ) | (4 | ) | |
| Long-term debt issued | 315 | 416 | 315 | 509 | |||||
| Loans from (repayments to) joint ventures | - | (61 | ) | 18 | 49 | ||||
| Common shares issued | - | 1 | 4 | 17 | |||||
| Finance costs (cash) | (76 | ) | (71 | ) | (152 | ) | (141 | ) | |
| Common share dividends | (70 | ) | (68 | ) | (140 | ) | (138 | ) | |
| Preferred share dividends | (2 | ) | (2 | ) | (4 | ) | (4 | ) | |
| Deferred credits and other | (6 | ) | (6 | ) | 1 | (15 | ) | ||
| Changes in non-cash working capital | (2 | ) | (7 | ) | 13 | 11 | |||
| Cash provided by (used in) financing activities | 157 | 198 | (824 | ) | 284 | ||||
| Effect of translation on foreign currency cash and cash equivalents | 3 | 1 | 6 | - | |||||
| Net increase (decrease) in cash and cash equivalents | (163 | ) | (44 | ) | 1 | (321 | ) | ||
| Cash and cash equivalents net of bank indebtedness, beginning of period | 515 | 276 | 351 | 553 | |||||
| Cash and cash equivalents net of bank indebtedness, end of period | 352 | 232 | 352 | 232 | |||||
| Cash and cash equivalents | 356 | 270 | 356 | 270 | |||||
| Bank indebtedness | (4 | ) | (38 | ) | (4 | ) | (38 | ) | |
| Cash and cash equivalents net of bank indebtedness, end of period | 352 | 232 | 352 | 232 | |||||
Contact Information:
Brent Anderson
Manager, External Relations
403-237-1912
tlm@talisman-energy.com
Talisman Energy Inc. - Shareholder and Investor Inquiries:
Lyle McLeod
Vice-President, Investor Relations
403-767-5732
tlm@talisman-energy.com
www.talisman-energy.com