Mackinac Financial Corporation Announces Significant Increase in Net Income for 2007


MANISTIQUE, MI--(Marketwire - January 25, 2008) - Mackinac Financial Corporation (NASDAQ: MFNC), the holding company for mBank, has reported net income of $10.163 million, or $2.96 per share, for the year ended December 31, 2007, compared to a net income of $1.716 million, or $.50 per share, for 2006. Weighted average shares outstanding amounted to 3,428,695 in both years.

The results for 2007 include the recognition of a $7.500 million deferred tax benefit for NOL and tax credit carryforwards and $.470 million of proceeds from the settlement of a lawsuit against the Corporation's former accountants.

The 2006 operations include a $600,000 negative provision recorded in the first quarter in recognition of improved credit quality, a $261,000 negative provision recorded in the fourth quarter to recognize a specific reserve reduction on a loan payoff, and a $500,000 deferred tax benefit recorded in the third quarter in recognition of a portion of NOL and tax credit carryforwards. The 2006 results also include $550,000 of expenses incurred to pursue legal action against the Corporation's former accountants.

Excluding these items in both years would have resulted in net profit of $2.193 million, or $.64 per share, in 2007 versus $.907 million, or $.27 per share, in 2006.

Paul Tobias, Chairman and Chief Executive Officer, commented, "In 2007, the Corporation continued to make progress generating core earnings in an increasingly difficult banking environment. While we are pleased with our loan growth and credit quality, we are not yet satisfied with our level of earnings, and we intend to improve our performance in 2008, even with the headwind from a difficult credit market and margin pressure from Federal Reserve rate reductions. We are proud of the fact that we have demonstrated a sufficient level of core earnings to provide the basis for recognition of the deferred tax benefit related to NOL and tax credit carryforwards. The loan and core deposit growth in 2007 provides the foundation in which to increase our profitability in future periods. In 2008, our plan will be to emphasize core deposit growth and our deposit mix. We have asked our team to focus on deposit and relationship growth first and foremost. While our Upper Peninsula market remains stable, our Traverse City and Southeastern Michigan markets are experiencing very difficult times in the real estate and manufacturing sectors. While the geographic diversity of our banking markets gives us the flexibility to avoid troubled sectors, aggressive loan growth goals would not be prudent."

Total assets of the Corporation at December 31, 2007 were $408.880 million, an increase of $26.089 million, or 6.8% from total assets of $382.791 million reported at December 31, 2006.

During 2007 the Corporation's loans stood at $355.079 million, an increase of $32.498 million, or 10.1%, from 2006 year-end balances of $322.581 million. Total loan originations in 2007 amounted to $114 million, while we experienced significant reductions from loan amortization and principal payoffs of $79.3 million. A good portion of these payoffs pertained to loan relationships that no longer met our pricing or credit standards.

Tobias stated, "During the year, we continued to be successful in originating high quality loan relationships. Loan growth in 2007 builds on prior growth during 2006 of $82.810 million and $35.939 million in 2005."

Asset quality remains relatively strong. Nonperforming loans totaled $4.008 million, or 1.13% of total loans, at December 31, 2007. Nonperforming assets at December 31, 2007 were $5.234 million, 1.28% of total assets, compared to $2.965 million or .77% of total assets at December 31, 2006. Tobias added, "During our loan portfolio expansion, we have been diligent in our credit administration and have continued to focus on credit quality. The recent economic issues of Michigan and the U.S. economy concerns in total have reinforced our thinking relative to the level of risk we will accept for new loans. We also believe in early recognition of problem credits to minimize loss, especially during times of economic uncertainty. Our level of nonperforming assets is well below most of our peers, and we are proud of our credit quality, yet we remain concerned with the ongoing costs associated with any level of nonperforming assets." Included in the total nonperforming loans are pre-recapitalization loans amounting to $2.036 million, with specific reserves totaling $.741 million and an SBA guaranty amounting to $.688 million. A schedule depicting our nonperforming assets and associated reserve levels is included in the appended information.

"In 2008, we will begin to provide for loan losses for new loan growth and to replenish the reserve for charge-off activity. While further deterioration in the economy will impact our portfolio and the required level of our loan loss reserve, we intend to stay ahead of our potential problems and do not anticipate significant deviance from our plan," Tobias concluded.

Total deposits grew from $312.421 million at December 31, 2006 to $320.827 million at December 31, 2007, an increase of 2.7%. In the fourth quarter of 2007, we consummated the sale of our Ripley branch office with $9.3 million in deposits. This branch office sale was in line with the overall strategic plan of the Corporation to focus on markets with higher growth potential. Excluding the Ripley branch deposits sold, deposits grew by $17.706 million, of which $9.5 million consisted of brokered deposits. Core deposit growth for 2007 peaked in August at $26 million, before shrinking in the fourth quarter. We believe a significant portion of the fourth quarter runoff was seasonal and due to customers using more of their cash to support their operations and we anticipate subsequent deposit inflows on a seasonal basis from these established accounts. Another portion of the deposit runoff was due to our unwillingness to pay "higher than wholesale" CD deposit rates in our local markets.

Since the recapitalization, we have been successful in growing core deposits, as evidenced by the increase in customer deposit balances of $68 million in that time period.

Net interest income for the year ended December 31, 2007 was $13.417 million compared to $11.593 million for the year ended December 31, 2006, an increase of $1.824 million. The margin percentage for 2007 was 3.60% compared to 3.51% in 2006 and 3.64% in 2005. During the later months of 2007, the prime rate decreased from 8.25% to 7.25%, which created margin pressure since a majority of the commercial loan portfolio repriced downwards with each prime rate change. We experienced additional margin pressure from higher relative rates on brokered deposits, which did not reprice in line with prime rate reductions, due to the overall market liquidity crisis. Tobias commented, "We will continue to focus our efforts on growing transactional accounts. We will be implementing appropriate incentives in 2008 to help reward the individuals that grow low cost deposits."

"Operating expenses continue to be a focus of management and our challenge is to balance the skills and talents of our management team with our asset base. While our efficiency ratio has improved, we understand that we need to continue to drive it lower. We continue to take cost out of our operation as we work on growing our net interest margin," according to Tobias. Excluding extraordinary items, noninterest expense totaled $12.1 million in 2007 compared to $11.6 million in 2006 and $13.9 million in 2005.

Shareholders' equity totaled $39.321 million at December 31, 2007 compared to $28.790 million at the end of 2006, an increase of $10.531 million. This increase reflects consolidated net income of $10.163 million, the capital contribution impact of stock options and also the increase in equity due to the increase in the market value of held-for-sale investments, which amounted to $.247 million. The book value per share at December 31, 2007 amounted to $11.47 compared to $8.40 at the end of 2006. Tobias stated, "The 2007 year-end equity now reflects the Corporation's value of the deferred tax benefit pertaining to the Corporation's NOL and tax credit carryforwards which were recognized through income."

Tobias concluded, "We will continue to work hard in 2008 to build core earnings and shareholder value. We are proud of the progress to date but are impatient for our progress to create a higher level of earnings and shareholder value. Mindful of the risks in our markets, we will remain focused on the fundamentals of community banking, and at the same time, attempt to broaden our stock ownership by explaining our unique story to a large audience. Management team members and our Board members are committed to increasing their individual ownership position by acquiring additional shares."

Mackinac Financial Corporation is a registered bank holding company formed under the Bank Holding Company Act of 1956 with assets in excess of $400 million and whose common stock is traded on the NASDAQ stock market as "MFNC." The principal subsidiary of the Corporation is mBank. Headquartered in Manistique, Michigan, mBank has 12 branch locations; eight in the Upper Peninsula, three in the Northern Lower Peninsula and one in Oakland County, Michigan. The Company's banking services include commercial lending and treasury management products and services geared toward small to mid-sized businesses, as well as a full array of personal and business deposit products and consumer loans.

Forward-Looking Statements

This release contains certain forward-looking statements. Words such as "anticipates," "believes," "estimates," "expects," "intends," "should," "will," and variations of such words and similar expressions are intended to identify forward-looking statements: as defined by the Private Securities Litigation Reform Act of 1995. These statements reflect management's current beliefs as to expected outcomes of future events and are not guarantees of future performance. These statements involve certain risks, uncertainties and assumptions that are difficult to predict with regard to timing, extent, likelihood and degree of occurrence. Therefore, actual results and outcomes may materially differ from what may be expressed or forecasted in such forward-looking statements. Factors that could cause a difference include among others: changes in the national and local economies or market conditions; changes in interest rates and banking regulations; the impact of competition from traditional or new sources; and the possibility that anticipated cost savings and revenue enhancements from mergers and acquisitions, bank consolidations, branch closings and other sources may not be fully realized at all or within specified time frames as well as other risks and uncertainties including but not limited to those detailed from time to time in filings of the Company with the Securities and Exchange Commission. These and other factors may cause decisions and actual results to differ materially from current expectations. Mackinac Financial Corporation undertakes no obligation to revise, update, or clarify forward-looking statements to reflect events or conditions after the date of this release.

          MACKINAC FINANCIAL CORPORATION AND SUBSIDIARIES
                 SELECTED FINANCIAL HIGHLIGHTS


                                                    For The Years Ended
                                                        December 31,
(Dollars in thousands,except per share data)          2007         2006
                                                  -----------  -----------
                                                  (Unaudited)   (Audited)
Selected Financial Condition Data (at end of
 period):
Total assets                                      $   408,880  $   382,791
Total loans                                           355,079      322,581
Total deposits                                        320,827      312,421
Borrowings and subordinated debentures                 45,949       38,307
Total shareholders' equity                             39,321       28,790


Selected Statements of Income Data:
Net interest income                               $    13,417  $    11,593
Income before taxes                                     2,923        1,216
Net income                                             10,163        1,716
Income per common share - Basic                          2.96          .50
Income per common share - Diluted                        2.96          .50


Selected Financial Ratios and Other Data:
Performance Ratios:
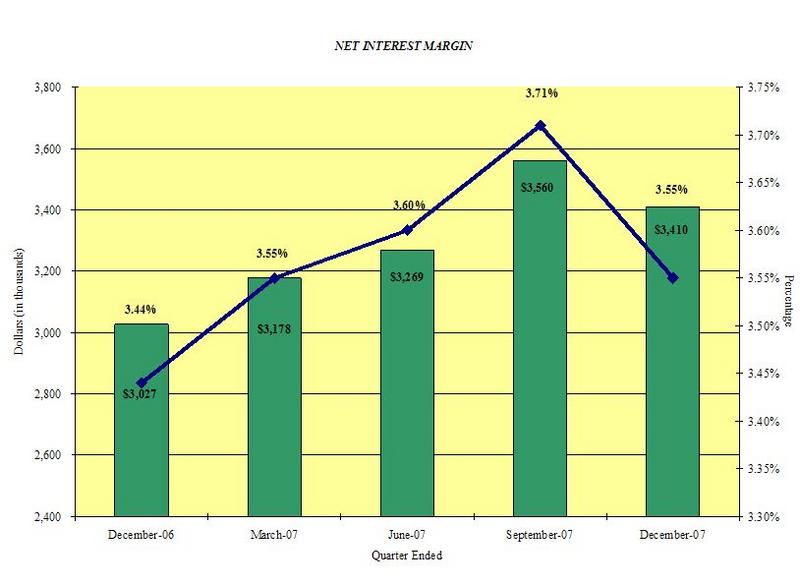
Net interest margin                                      3.60%        3.51%
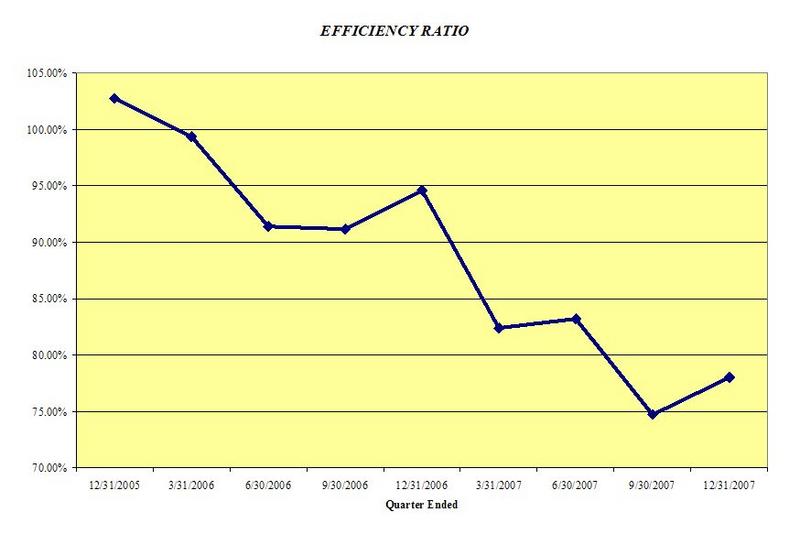
Efficiency ratio                                        79.46        93.95
Return on average assets                                 2.59          .49
Return on average equity                                31.05         6.19

Average total assets                              $   392,313  $   347,927
Average total shareholders' equity                     32,731       27,744
Average loans to average deposits ratio                104.94%       99.77%


Common Share Data at end of period:
Market price per common share                     $      8.98  $     11.50
Book value per common share                       $     11.47  $      8.40
Common shares outstanding                           3,428,695    3,428,695
Weighted average shares outstanding                 3,428,695    3,428,695

Other Data at end of period:
Allowance for loan losses                         $     4,146  $     5,006
Non-performing assets                             $     5,234  $     2,965
Allowance for loan losses to total loans                 1.17%        1.55%
Non-performing assets to total assets                    1.28%         .77%
Number of:
     Branch locations                                      12           13


           MACKINAC FINANCIAL CORPORATION AND SUBSIDIARIES
                CONSOLIDATED STATEMENTS OF OPERATIONS

(Dollars in thousands, except per share data)           December 31,
                                                      2007         2006
                                                  -----------  -----------
                                                  (Unaudited)   (Audited)
ASSETS
Cash and due from banks                           $     6,196  $     4,865
Federal funds sold                                        166        5,841
                                                  -----------  -----------
  Cash and cash equivalents                             6,362       10,706

Interest-bearing deposits in other financial
 institutions                                           1,810          856
Securities available for sale                          21,597       32,769
Federal Home Loan Bank stock                            3,794        3,794

Loans:
  Commercial                                          288,839      255,780
  Mortgage                                             62,703       63,960
  Installment                                           3,537        2,841
                                                  -----------  -----------
    Total loans                                       355,079      322,581
      Allowance for loan losses                        (4,146)      (5,006)
                                                  -----------  -----------
  Net loans                                           350,933      317,575

Premises and equipment                                 11,609       12,453
Other real estate held for sale                         1,226           26
Other assets                                           11,549        4,612
                                                  -----------  -----------

TOTAL ASSETS                                      $   408,880  $   382,791
                                                  ===========  ===========

LIABILITIES AND SHAREHOLDERS' EQUITY
Liabilities:
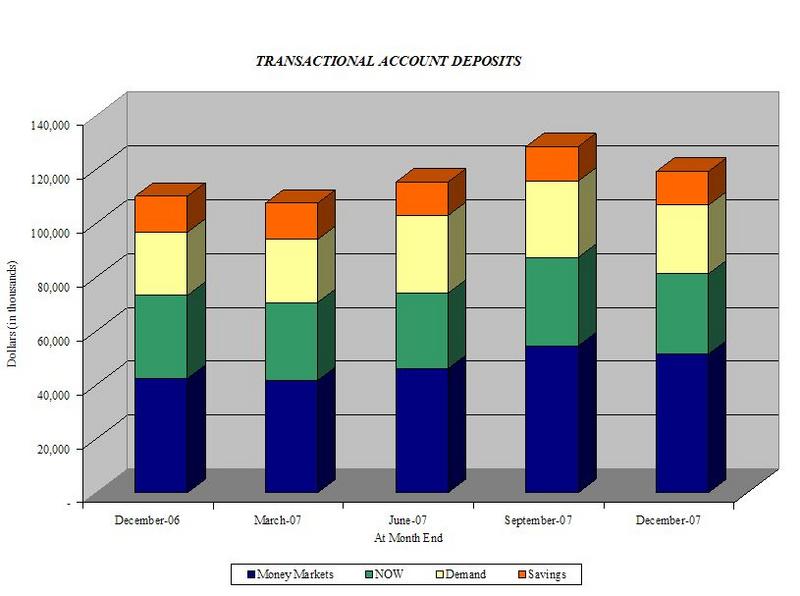
  Non-interest-bearing deposits                   $    25,557  $    23,471
  Interest-bearing deposits
    NOW and Money Market                               81,160       73,188
    Savings                                            12,485       13,365
    CDs < $100,000                                     80,607       89,585
    CDs > $100,000                                     22,355       23,645
    Brokered                                           98,663       89,167
                                                  -----------  -----------
        Total deposits                                320,827      312,421

  Borrowings
    Short-term                                          7,710
    Long-term                                          38,239       38,307
  Other liabilities                                     2,783        3,273
                                                  -----------  -----------
        Total liabilities                             369,559      354,001

Shareholders' equity:
  Preferred stock - No par value:
    Authorized 500,000 shares, no shares
     outstanding                                            -            -
  Common stock and additional paid in capital -
   No par value
    Authorized - 18,000,000 shares Issued and
     outstanding - 3,428,695 shares                    42,841       42,722
  Retained earnings                                    (3,580)     (13,745)
  Accumulated other comprehensive income (loss)            60         (187)
                                                  -----------  -----------

        Total shareholders' equity                     39,321       28,790
                                                  -----------  -----------

TOTAL LIABILITIES AND SHAREHOLDERS' EQUITY        $   408,880  $   382,791
                                                  ===========  ===========


             MACKINAC FINANCIAL CORPORATION AND SUBSIDIARIES
                 CONSOLIDATED STATEMENTS OF OPERATIONS

(Dollars in thousands, except per
 share data)                           For The Years Ended December 31,
                                         2007         2006         2005
                                     -----------  -----------  -----------
Interest income:                     (Unaudited)   (Audited)    (Audited)
  Interest and fees on loans:
    Taxable                          $    26,340  $    21,239  $    13,862
    Tax-exempt                               533          753          928
  Interest on securities:
    Taxable                                1,100        1,186        1,455
    Tax-exempt                                 -           87          167
  Other interest income                      722          787          564
                                     -----------  -----------  -----------

       Total interest income              28,695       24,052       16,976
                                     -----------  -----------  -----------

Interest expense:
  Deposits                                13,224       10,575        5,259
  Borrowings                               2,054        1,884        1,937
                                     -----------  -----------  -----------

       Total interest expense             15,278       12,459        7,196
                                     -----------  -----------  -----------

Net interest income                       13,417       11,593        9,780
Provision for loan losses                    400         (861)           -

                                     -----------  -----------  -----------
Net interest income after provision
 for loan losses                          13,017       12,454        9,780
                                     -----------  -----------  -----------

Other income
  Service fees                               688          547          586
  Net gains on sale of secondary
   market loans                              498          197           49
  Proceeds from settlement of
   lawsuit                                   470            -            -
  Other                                      350          239          476
                                     -----------  -----------  -----------

          Total other income               2,006          983        1,111
                                     -----------  -----------  -----------

Other expenses:
  Salaries and employee benefits           6,757        6,132        6,090
  Occupancy                                1,272        1,264        1,053
  Furniture and equipment                    678          631          560
  Data processing                            785          691        1,720
  Accounting, legal and consulting
   fees                                      532        1,425          886
  Loan and deposit                           285          392          852
  Telephone                                  228          210          271
  Advertising                                370          346          814
  Penalty on prepayment of FHLB
   borrowings                                  -            -        4,320
  Other                                    1,193        1,130        1,689
                                     -----------  -----------  -----------

       Total other expenses               12,100       12,221       18,255
                                     -----------  -----------  -----------

Income (loss) before provision for
 income taxes                              2,923        1,216       (7,364)
Provision for (benefit of) income
 taxes                                    (7,240)        (500)           -
                                     -----------  -----------  -----------
Net income (loss)                    $    10,163  $     1,716  $    (7,364)
                                     -----------  -----------  -----------
Income (loss) per common share:
  Basic                              $      2.96  $       .50  $     (2.15)
                                     ===========  ===========  ===========
  Diluted                            $      2.96  $       .50  $     (2.15)
                                     ===========  ===========  ===========


             MACKINAC FINANCIAL CORPORATION AND SUBSIDIARIES
                      LOAN PORTFOLIO AND CREDIT QUALITY

(Dollars in thousands)

Loan Portfolio Balances (at end of period):

                                                         December 31,
                                                       2007        2006
                                                    ----------- -----------
Commercial Loans
Real estate - operators of nonresidential buildings $    41,597 $    44,308
Hospitality and tourism                                  37,604      30,826
Real estate agents and managers                          29,571      25,071
New car dealers                                          10,569      10,086
Other                                                   130,546     115,426
                                                    ----------- -----------
   Total Commercial Loans                               249,887     225,717

1-4 family residential real estate                       57,613      58,014
Consumer                                                  3,537       2,841
Construction
   Consumer                                               5,090       5,946
   Commercial                                            38,952      30,063
                                                    ----------- -----------

   Total Loans                                      $   355,079 $   322,581
                                                    =========== ===========

Credit Quality (at end of period):


                                                         December 31,
                                                        2007       2006
                                                    ----------- ----------

Nonperforming Assets
Nonaccrual loans (1)                                $    3,298  $    2,899
Loans past due 90 days or more                             710          40
                                                    ----------  ----------
   Total nonperforming loans                             4,008       2,939
Other real estate owned (2)                              1,226          26
                                                    ----------  ----------
   Total nonperforming assets                       $    5,234  $    2,965
                                                    ==========  ==========
Nonperforming loans as a % of loans                       1.13%        .91%
                                                    ----------  ----------
Nonperforming assets as a % of assets                     1.28%        .77%
                                                    ----------  ----------
Reserve for Loan Losses:
At period end                                       $    4,146  $    5,006
                                                    ----------  ----------
As a % of loans                                           1.17%       1.55%
                                                    ----------  ----------
As a % of nonperforming loans                           103.42%     170.33%
                                                    ----------  ----------
As a % of nonaccrual loans                              125.71%     172.68%
                                                    ==========  ==========

Charge-off Information:
   Average loans                                    $  333,415  $  278,953
                                                    ----------  ----------
   Net charge-offs                                  $    1,261  $      241
                                                    ----------  ----------
   Charge-offs as a % of average loans                     .38%        .09%
                                                    ----------  ----------

(1) Nonaccrual loans at December 31, 2007 include loans totaling $2.036
    million with specific reserves of $.741 million that were originated
    before the recapitalization.  Nonaccrual loans originated after the
    recapitalization total $1.262 million and have specific reserves of
    $.478 million.

(2) Most recently appraised at $1.533 million


                      MACKINAC FINANCIAL CORPORATION AND SUBSIDIARIES
                               QUARTERLY FINANCIAL HIGHLIGHTS

                                         QUARTER ENDED
                     -----------------------------------------------------
                                          (Unaudited)
                     -----------------------------------------------------
                     December   September    June      March     December
                        31,        30,        30,        31,        31,
                       2007       2007       2007       2007       2006
                     ---------  ---------  ---------  ---------  ---------
BALANCE SHEET
 (Dollars in
   thousands)

Total loans          $ 355,079  $ 344,149  $ 338,896  $ 318,421  $ 322,581
Allowance for loan
 losses                 (4,146)    (5,022)    (4,920)    (4,975)    (5,006)
                     ---------  ---------  ---------  ---------  ---------
   Total loans, net    350,933    339,127    333,976    313,446    317,575
Intangible assets          124        143        163        182        205
Total assets           408,880    401,213    393,319    375,644    382,791
Core deposits          199,809    218,638    211,773    201,529    199,609
Noncore deposits (1)   121,018    102,733    109,473    102,883    112,812
                     ---------  ---------  ---------  ---------  ---------
   Total deposits      320,827    321,371    321,246    304,412    312,421
Total borrowings        45,949     38,239     38,307     38,307     38,307
Total shareholders'
 equity                 39,321     38,697     30,485     29,932     28,790
Total shares
 outstanding         3,428,695  3,428,695  3,428,695  3,428,695  3,428,695

AVERAGE BALANCES
 (Dollars in
   thousands)

Assets               $ 406,308  $ 400,105  $ 382,065  $ 380,403  $ 366,566
Loans                  350,050    340,391    324,721    318,072    301,508
Deposits               324,194    327,293    309,469    309,619    294,755
Equity                  38,973     32,184     30,412     29,254     28,646

INCOME STATEMENT
 (Dollars in
   thousands)

Net interest income  $   3,410  $   3,560  $   3,269  $   3,178  $   3,027
Provision for loan
 losses                      -        400          -          -       (261)
                     ---------  ---------  ---------  ---------  ---------
   Net interest
    income after
    provision            3,410      3,160      3,269      3,178      3,288
Total noninterest
 income                    355        396        342        913        276
Total noninterest
 expense                 2,978      3,001      3,065      3,056      3,226
                     ---------  ---------  ---------  ---------  ---------
Income before taxes        787        555        546      1,035        338
Provision for income
 taxes                     260     (7,500)         -          -          -
                     ---------  ---------  ---------  ---------  ---------
Net income           $     527  $   8,055  $     546  $   1,035  $     338
                     =========  =========  =========  =========  =========

PER SHARE DATA

Earnings - basic     $     .15  $    2.35  $     .16  $     .30  $     .10
Earnings - diluted         .15       2.35        .16        .30        .10
Book value               11.47      11.29       8.89       8.73       8.40
Market value,
 closing price            8.98       8.75       9.45       9.26      11.50

ASSET QUALITY RATIOS

Nonperforming
 loans/total loans        1.13%       .92%      1.49%      1.53%       .91%
Nonperforming
 assets/total assets      1.28        .90       1.30       1.33        .77
Allowance for loan
 losses/total loans       1.17       1.46       1.45       1.56       1.55
Allowance for loan
 losses/nonperformi-
 ng loans               103.42     158.32      97.45     102.32     170.33

PROFITABILITY RATIOS

Return on average
 assets                    .51%      7.99%       .57%      1.10%       .37%
Return on average
 equity                   5.36      99.30       7.20      14.35       4.68
Net interest margin       3.55       3.71       3.60       3.55       3.44
Efficiency ratio         78.02      74.71      83.18      82.39      94.60
Average
 loans/average
 deposits               107.98     104.00     104.93     102.73     102.29

CAPITAL ADEQUACY
 RATIOS

Tier 1 leverage
 ratio                    8.05%      8.03%      7.97%      7.85%      7.85%
Tier 1 capital to
 risk weighted
 assets                   8.97       9.03       8.85       9.16       8.77
Total capital to
 risk weighted
 assets                  10.13      10.28      10.10      10.41      10.02
Average
 equity/average
 assets                   9.59       8.04       7.96       7.69       7.81
Tangible
 equity/tangible
 assets, period end       9.59       9.61       7.71       7.92       7.47


(1) Noncore deposits includes Internet CDs, brokered deposits and CDs
    greater than $100,000

Contact Information: Contact: Investor Relations (888) 343-8147 Website: www.bankmbank.com