Mackinac Financial Corporation Reports First Quarter 2008 Results


MANISTIQUE, MI--(Marketwire - May 1, 2008) - Mackinac Financial Corporation (NASDAQ: MFNC), the bank holding company for mBank (the "Bank") today announced first quarter 2008 income of $.139 million or $.04 per share compared to net income of $1.035 million, or $.30 per share for the first quarter of 2007. The results of operations for the first quarter of 2007 include the proceeds received, $470,000, in the settlement of a lawsuit against the Corporation's former accountants. Excluding the lawsuit settlement, the net income in the first quarter of 2007 amounted to $.565 million, or $.17 per share. Weighted average shares outstanding amounted to 3,428,695 in both periods.

Operating income in the first quarter was impacted by net interest margin pressure. Net interest income declined from $3.178 million, 3.55%, in the first quarter of 2007 to $3.045 million, 3.13%, for the same period in 2008. This decline in margin was attributed to an asset sensitive balance sheet and a significant level of wholesale funding. Wholesale funding costs have not declined in line with overall market rates due to an increase in funding demand to address overall market liquidity. Paul Tobias, Chairman and Chief Executive Officer, commented, "The decline in our net interest margin does concern us and we are taking steps to mitigate the short-term impact of higher cost funding. We will initiate cost reduction efforts throughout the Corporation to offset the margin shortfall in 2008. As we progress through the year, a good portion of our liabilities will reprice, producing higher margins. In addition, we are reviewing all loan relationships as they come due and repricing renewals and new loans with a spread off of a base rate that provides acceptable returns to shareholders."

Total assets of the Corporation at March 31, 2008, were $417.175 million, up 11.06% from the $375.644 million in total assets reported at March 31, 2007. First quarter-end total assets were up 2.03% from the $408.880 million of total assets at year-end 2007.

Total loans at March 31, 2008, were $360.056 million, a 13.08% increase from the $318.421 million at March 31, 2007. Total loans at the end of the first quarter of 2008 increased $4.977 million, or 1.40% from year-end 2007 total loans of $355.079 million. Tobias stated, "Loan growth in the first quarter was impacted by $4.4 million in paydowns; however, our first quarter new loan production was strong at $17.8 million, which should translate into solid growth in the near term as these loans fund. We continue to see loan demand; however, activity has slowed with economic uncertainty. We will be selective with loan growth opportunities in 2008 through stricter credit standards and enhanced pricing. We will also use extreme caution on renewals and extensions of existing loans and reevaluate these credits to determine if these relationships fit our current risk and pricing requirements."

Total deposits of $326.047 million at March 31, 2008 were up 7.11% from deposits of $304.412 million on March 31, 2007. Deposits were up 1.63% from year-end 2007 deposits of $320.827 million. Deposit growth increases in the 2008 first quarter were due to increases in wholesale brokered deposits of $1.9 million and bank deposits of $3.3 million. Deposit balances increased by $21.6 million from March 2007 to March 2008. In October 2007, the Corporation sold a branch office with $9.3 million in deposits. Deposit growth from March 2007 to March 2008 after adjusting for this sale would total $30.9 million, with $22.2 million from wholesale deposits and $8.7 million representing growth in bank deposits. Mr. Tobias added, "The competition for deposit growth is intense. We are constantly evaluating our deposit products and market pricing to help stimulate growth. Early in 2008, we added a senior staff position that will focus on deposit growth opportunities in the Upper Peninsula and Northern Lower Peninsula. We continue to supplement our northern branch system by offering competitive rates, low fee and account cost structure, efficient internet banking, remote deposit capture, and courier services."

Nonperforming assets at the end of the first quarter of 2008 totaled $4.518 million which was down $.716 million from 2007 year end balances. This first quarter decrease was due to the collection of an SBA guarantee on a nonperforming loan. Tobias, commenting on credit quality, stated, "We remain vigilant and believe that we have identified and properly reserved for known credit issues. However, as the economy continues to soften, we will work to minimize the impact that eroding collateral and ability to repay could have on our operating results."

Shareholders' equity at March 31, 2008, totaled $39.633 million, or $11.56 per share, compared to $29.932 million, or $8.73 per share on March 31, 2007.

Tobias concluded, "We expect 2008 to be a difficult year for our industry. Credit issues for many banks will become more severe as real estate values continue to fall. This will be accentuated in Michigan, given our troubled State economy. In comparison to our Midwest peers, the portfolio credit quality characteristics are strong; however, we know that we are not immune to continued market deterioration. This quarter's credit metrics did not require us to recognize a provision. Investors should anticipate that in future quarters loan loss provisions will be required if further market deterioration impacts our weaker credits. That being said, we are confident that we will weather this period of credit concern. We would invite our investors to examine our book value and take comfort in the value per share that has been created. We believe our book value is well protected by reserves and will continue to grow in 2008 and beyond."

Mackinac Financial Corporation is a registered bank holding company formed under the Bank Holding Company Act of 1956 with assets in excess of $400 million and whose common stock is traded on the NASDAQ stock market as "MFNC." The principal subsidiary of the Corporation is mBank. Headquartered in Manistique, Michigan, mBank has 12 branch locations; eight in the Upper Peninsula, three in the Northern Lower Peninsula and one in Oakland County, Michigan. The Company's banking services include commercial lending and treasury management products and services geared toward small to mid-sized businesses, as well as a full array of personal and business deposit products and consumer loans.

Forward-Looking Statements

This release contains certain forward-looking statements. Words such as "anticipates," "believes," "estimates," "expects," "intends," "should," "will," and variations of such words and similar expressions are intended to identify forward-looking statements: as defined by the Private Securities Litigation Reform Act of 1995. These statements reflect management's current beliefs as to expected outcomes of future events and are not guarantees of future performance. These statements involve certain risks, uncertainties and assumptions that are difficult to predict with regard to timing, extent, likelihood, and degree of occurrence. Therefore, actual results and outcomes may materially differ from what may be expressed or forecasted in such forward-looking statements. Factors that could cause a difference include among others: changes in the national and local economies or market conditions; changes in interest rates and banking regulations; the impact of competition from traditional or new sources; and the possibility that anticipated cost savings and revenue enhancements from mergers and acquisitions, bank consolidations, branch closings and other sources may not be fully realized at all or within specified time frames as well as other risks and uncertainties including but not limited to those detailed from time to time in filings of the Company with the Securities and Exchange Commission. These and other factors may cause decisions and actual results to differ materially from current expectations. Mackinac Financial Corporation undertakes no obligation to revise, update, or clarify forward-looking statements to reflect events or conditions after the date of this release.


                  MACKINAC FINANCIAL CORPORATION AND SUBSIDIARIES
                          SELECTED FINANCIAL HIGHLIGHTS

(Dollars in thousands, except per share data)


                                        For The Period Ended
                            --------------------------------------------
                              March 31,     December 31,      March 31,
                                2008            2007            2007
                            ------------    ------------    ------------
                             (Unaudited)                     (Unaudited)
Selected Financial
 Condition Data (at end of
 period):
Total assets                $    417,175    $    408,880    $    375,644
Total loans                      360,056         355,079         318,421
Total deposits                   326,047         320,827         304,412
Borrowings                        48,849          45,949          38,307
Total shareholders' equity        39,633          39,321          29,932


Selected Statements of
 Income Data:
Net interest income         $      3,045    $     13,417    $      3,178
Income before taxes                  164           2,923           1,035
Net income                           139          10,163           1,035
Income per common share -
 Basic                               .04            2.96             .30
Income per common share -
 Diluted                             .04            2.96             .30


Selected Financial Ratios
 and Other Data:
Performance Ratios:
Net interest margin                 3.13 %          3.60 %          3.55 %
Efficiency ratio                   95.34           79.46           82.40
Return on average assets             .13            2.59            1.10
Return on average equity            1.42           31.05           14.35

Average total assets        $    417,682    $    392,313    $    380,403
Average total shareholders'
 equity                           39,491          32,731          29,254
Average loans to average
 deposits ratio                   106.48 %        104.94 %        102.73 %


Common Share Data (at end
 of period):
Market price per common
 share                      $       8.50    $       8.98    $       9.26
Book value per common share $      11.56    $      11.47    $       8.73
Common shares outstanding      3,428,695       3,428,695       3,428,695
Weighted average shares
 outstanding                   3,428,695       3,428,695       3,428,695

Other Data (at end of
 period):
Allowance for loan losses   $      3,924    $      4,146    $      4,975
Non-performing assets       $      4,518    $      5,234    $      4,989
Allowance for loan losses
 to total loans                     1.09 %          1.17 %          1.56 %
Non-performing assets to
 total assets                       1.08 %          1.28 %          1.33 %
Number of:
     Branch locations                 12              12              13
     FTE Employees                   103             100             104


                 MACKINAC FINANCIAL CORPORATION AND SUBSIDIARIES
                          CONSOLIDATED BALANCE SHEETS


                                      March 31,   December 31,  March 31,
(Dollars in thousands)                  2008         2007         2007
                                     -----------  -----------  -----------
                                     (unaudited)               (unaudited)
ASSETS

Cash and due from banks              $     6,849  $     6,196  $     5,647
Federal funds sold                         1,568          166        6,330
                                     -----------  -----------  -----------
   Cash and cash equivalents               8,417        6,362       11,977

Interest-bearing deposits in other
 financial institutions                      382        1,810          856
Securities available for sale             24,581       21,597       28,511
Federal Home Loan Bank stock               3,794        3,794        3,794

Loans:
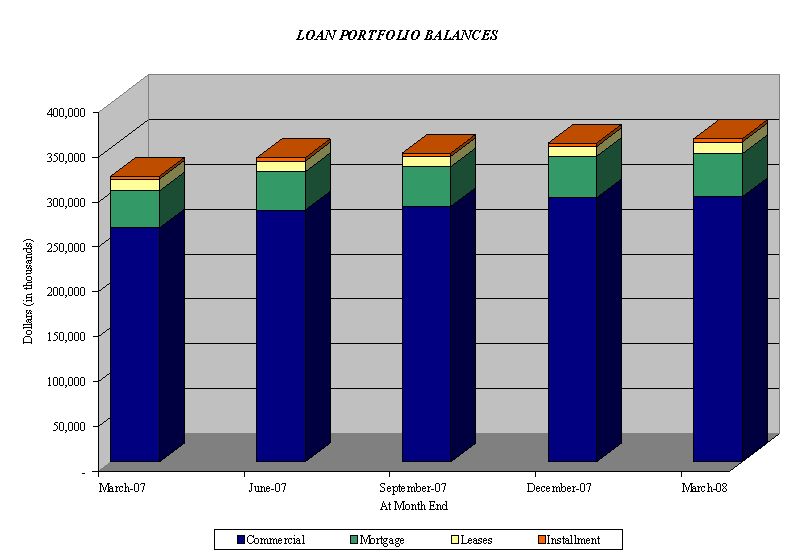
   Commercial                            291,980      288,839      256,133
   Mortgage                               64,624       62,703       59,317
   Installment                             3,452        3,537        2,971
                                     -----------  -----------  -----------
     Total Loans                         360,056      355,079      318,421
       Allowance for loan losses          (3,924)      (4,146)      (4,975)
                                     -----------  -----------  -----------
   Net loans                             356,132      350,933      313,446

Premises and equipment                    11,511       11,609       12,252
Other real estate held for sale            1,137        1,226          127
Other assets                              11,221       11,549        4,681
                                     -----------  -----------  -----------

TOTAL ASSETS                         $   417,175  $   408,880  $   375,644
                                     ===========  ===========  ===========

LIABILITIES AND SHAREHOLDERS' EQUITY
Liabilities:
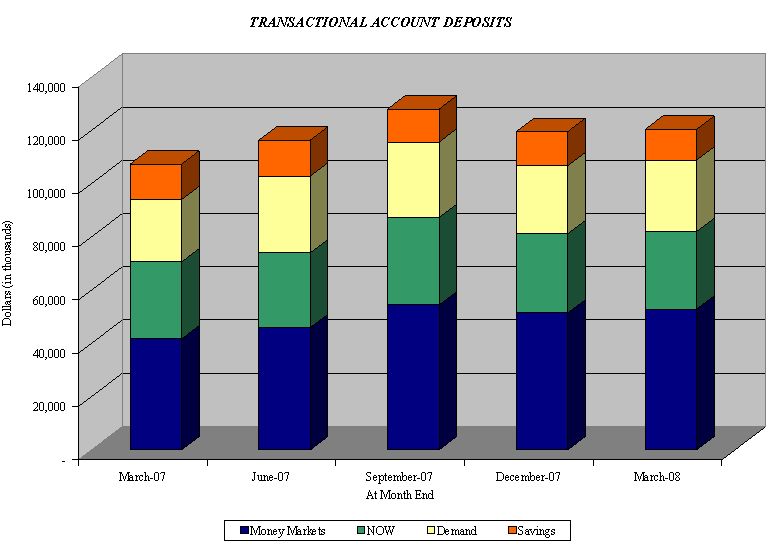
   Non-interest-bearing deposits     $    26,876  $    25,557  $    23,416
   Interest-bearing deposits
     NOW and Money Market                 81,952       81,160       70,558
     Savings                              11,530       12,485       13,488
     CDs < $100,000                       83,087       80,607       94,067
     CDs > $100,000                       22,010       22,355       24,475
     Brokered                            100,592       98,663       78,408
                                     -----------  -----------  -----------
       Total deposits                    326,047      320,827      304,412

   Borrowings
     Federal funds purchased              10,410        7,710            -
     Short-term                            2,159        1,959            -
     Long-term                            36,280       36,280       38,307
                                     -----------  -----------  -----------
       Total borrowings                   48,849       45,949       38,307
   Other liabilities                       2,646        2,783        2,993
                                     -----------  -----------  -----------
     Total liabilities                   377,542      369,559      345,712

Shareholders' equity:
   Preferred stock - No par value:
     Authorized 500,000 shares, no
      shares outstanding
   Common stock and additional paid
    in capital - No par value
     Authorized - 18,000,000 shares
     Issued and outstanding -
      3,428,695 shares                    42,862       42,843       42,750
     Accumulated deficit                  (3,441)      (3,582)     (12,709)
     Accumulated other comprehensive
      income (loss)                          212           60         (109)
                                     -----------  -----------  -----------

       Total shareholders' equity         39,633       39,321       29,932
                                     -----------  -----------  -----------

TOTAL LIABILITIES AND SHAREHOLDERS'
 EQUITY                              $   417,175  $   408,880  $   375,644
                                     ===========  ===========  ===========


            MACKINAC FINANCIAL CORPORATION AND SUBSIDIARIES
                 CONSOLIDATED STATEMENTS OF OPERATIONS


(Dollars in thousands except per share data)          Three Months Ended
                                                           March 31,
                                                    -----------------------
                                                       2008        2007
                                                    ----------- -----------
                                                    (Unaudited) (Unaudited)
INTEREST INCOME:
     Interest and fees on loans:
          Taxable                                   $     6,100 $     6,233
          Tax-exempt                                        108         171
     Interest on securities:
          Taxable                                           266         301
          Tax-exempt                                          1           -
     Other interest income                                   89         200
                                                    ----------- -----------
          Total interest income                           6,564       6,905
                                                    ----------- -----------

INTEREST EXPENSE:
     Deposits                                             3,065       3,222
     Borrowings                                             454         505
                                                    ----------- -----------
          Total interest expense                          3,519       3,727
                                                    ----------- -----------

Net interest income                                       3,045       3,178
Provision for loan losses                                     -           -
                                                    ----------- -----------
Net interest income after provision for loan losses       3,045       3,178
                                                    ----------- -----------

OTHER INCOME:
     Service fees                                           174         161
     Net security gains                                      65           -
     Net gains on loan sales                                 48         108
     Proceeds from settlement of lawsuit                      -         470
     Other                                                   23         174
                                                    ----------- -----------
          Total other income                                310         913
                                                    ----------- -----------

OTHER EXPENSES:
     Salaries and employee benefits                       1,807       1,738
     Occupancy                                              355         334
     Furniture and equipment                                178         157
     Data processing                                        221         171
     Professional service fees                              153         151
     Loan and deposit                                       110          72
     Telephone                                               45          58
     Advertising                                             60          92
     Other                                                  262         283
                                                    ----------- -----------
          Total other expenses                            3,191       3,056
                                                    ----------- -----------

Income before provision for income taxes                    164       1,035
Provision for (benefit of) income taxes                      25           -
                                                    ----------- -----------

NET INCOME                                          $       139 $     1,035
                                                    =========== ===========
INCOME PER COMMON SHARE:
     Basic                                          $       .04 $       .30
                                                    =========== ===========
     Diluted                                        $       .04 $       .30
                                                    =========== ===========


            MACKINAC FINANCIAL CORPORATION AND SUBSIDIARIES
                   LOAN PORTFOLIO AND CREDIT QUALITY

(Dollars in thousands)

Loan Portfolio Balances (at end of period):


                                              March    December     March
                                            31, 2008   31, 2007   31, 2007
                                           ---------- ---------- ----------
Commercial Loans
Real estate - operators of nonresidential
 buildings                                 $   43,167 $   41,597 $   44,155
Hospitality and tourism                        35,760     37,604     33,726
Real estate agents and managers                30,235     29,571     27,313
New car dealers                                10,551     10,569     10,139
Other                                         144,714    130,546    105,937
                                           ---------- ---------- ----------
   Total Commercial Loans                     264,427    249,887    221,270

1-4 family residential real estate             59,532     57,613     54,204
Consumer                                        3,452      3,537      2,971
Construction
   Commercial                                  27,553     38,952     34,863
   Consumer                                     5,092      5,090      5,113
                                           ---------- ---------- ----------

   Total Loans                             $  360,056 $  355,079 $  318,421
                                           ========== ========== ==========


Credit Quality (at end of period):

                                             March    December     March
                                           31, 2008   31, 2007   31, 2007
                                           ---------  ---------  ---------
Nonperforming Assets:
Nonaccrual loans                           $   3,381  $   3,298  $   4,142
Loans past due 90 days or more                     -        710        720
                                           ---------  ---------  ---------
   Total nonperforming loans                   3,381      4,008      4,862
Other real estate owned                        1,137      1,226        127
                                           ---------  ---------  ---------
   Total nonperforming assets              $   4,518  $   5,234  $   4,989
                                           =========  =========  =========
Nonperforming loans as a % of loans              .94%      1.13%      1.53%
                                           ---------  ---------  ---------
Nonperforming assets as a % of assets           1.08%      1.28%      1.33%
                                           ---------  ---------  ---------
Reserve for Loan Losses:
At period end                              $   3,924  $   4,146  $   4,975
As a % of loans                                 1.09%      1.17%      1.56%
                                           ---------  ---------  ---------
As a % of nonperforming loans                 116.06%    103.44%    102.32%
                                           ---------  ---------  ---------
As a % of nonaccrual loans                    116.06%    125.71%    120.11%
                                           =========  =========  =========

Charge-off Information (year to date):
   Average loans                             357,778    333,415    318,072
                                           ---------  ---------  ---------
   Net charge-offs                               222      1,260         31
                                           ---------  ---------  ---------
   Charge-offs as a % of average loans           .06%       .38%       .01%
                                           ---------  ---------  ---------


            MACKINAC FINANCIAL CORPORATION AND SUBSIDIARIES
                     QUARTERLY FINANCIAL HIGHLIGHTS


                                        QUARTER ENDED
                     ----------------------------------------------------
                                         (Unaudited)
                     ----------------------------------------------------
                       March    December   September    June       March
                     31, 2008   31, 2007   30, 2007   30, 2007   31, 2007
                     ---------  ---------  ---------  ---------  ---------
BALANCE SHEET
 (Dollars in
 thousands)

Total loans          $ 360,056  $ 355,079  $ 344,149  $ 338,896  $ 318,421
Allowance for loan
 losses                 (3,924)    (4,146)    (5,022)    (4,920)    (4,975)
                     ---------  ---------  ---------  ---------  ---------
   Total loans, net    356,132    350,933    339,127    333,976    313,446
Intangible assets          104        124        143        163        182
Total assets           417,175    408,880    401,213    393,319    375,644
Core deposits          203,445    199,809    218,638    211,773    201,529
Noncore deposits (1)   122,602    121,018    102,733    109,473    102,883
                     ---------  ---------  ---------  ---------  ---------
   Total deposits      326,047    320,827    321,371    321,246    304,412
Total borrowings        48,849     45,949     38,239     38,307     38,307
Total shareholders'
 equity                 39,633     39,321     38,697     30,485     29,932
Total shares
 outstanding         3,428,695  3,428,695  3,428,695  3,428,695  3,428,695

AVERAGE BALANCES
 (Dollars in
 thousands)

Assets               $ 417,682  $ 406,308  $ 400,105  $ 382,065  $ 380,403
Loans                  357,778    350,050    340,391    324,721    318,072
Deposits               336,016    324,194    327,293    309,469    309,619
Equity                  39,491     38,973     32,184     30,412     29,254

INCOME STATEMENT
 (Dollars in
 thousands)

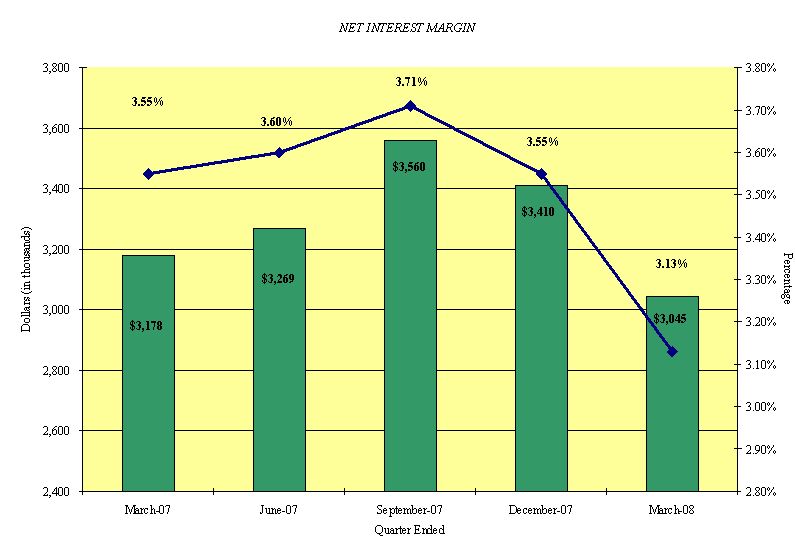
Net interest income  $   3,045  $   3,410  $   3,560  $   3,269  $   3,178
Provision for loan
 losses                      -          -        400          -          -
                     ---------  ---------  ---------  ---------  ---------
   Net interest
    income after
    provision            3,045      3,410      3,160      3,269      3,178
Total noninterest
 income                    310        355        396        342        913
Total noninterest
 expense                 3,191      2,978      3,001      3,065      3,056
                     ---------  ---------  ---------  ---------  ---------
Income before taxes        164        787        555        546      1,035
Provision for income
 taxes                      25        260     (7,500)         -          -
                     ---------  ---------  ---------  ---------  ---------
Net income           $     139  $     527  $   8,055  $     546  $   1,035
                     =========  =========  =========  =========  =========

PER SHARE DATA

Earnings - basic     $     .04  $     .15  $    2.35  $     .16  $     .30
Earnings - diluted         .04        .15       2.35        .16        .30
Book value               11.56      11.47      11.29       8.89       8.73
Market value,
 closing price            8.50       8.98       8.75       9.45       9.26

ASSET QUALITY RATIOS

Nonperforming
 loans/total loans         .94%      1.13%       .92%      1.49%      1.53%
Nonperforming
 assets/total assets      1.08       1.28        .90       1.30       1.33
Allowance for loan
 losses/total loans       1.09       1.17       1.46       1.45       1.56
Allowance for loan
 losses/nonperforming
 loans                  116.06     103.42     158.32      97.45     102.32

PROFITABILITY RATIOS

Return on average
 assets                    .13%       .51%      7.99%       .57%      1.10%
Return on average
 equity                   1.42       5.36      99.30       7.20      14.35
Net interest margin       3.13       3.55       3.71       3.60       3.55
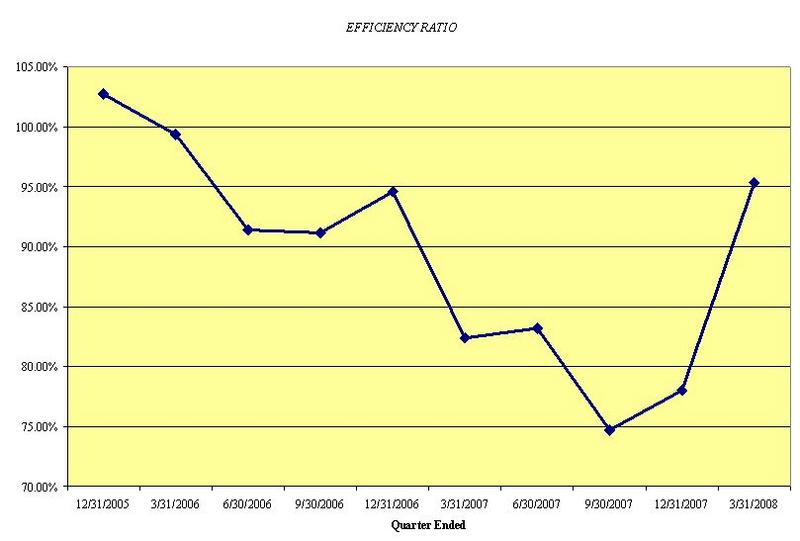
Efficiency ratio         95.34      78.02      74.71      83.18      82.39
Average loans/
 Average deposits       106.48     107.98     104.00     104.93     102.73

CAPITAL ADEQUACY RATIOS

Tier 1 leverage ratio     7.85%      8.05%      8.03%      7.97%      7.85%
Tier 1 capital to
 risk weighted
 assets                   8.84       8.97       9.03       8.85       9.16
Total capital to
 risk weighted
 assets                   9.92      10.13      10.28      10.10      10.41
Average equity/
 average assets           9.45       9.59       8.04       7.96       7.69
Tangible equity/
 tangible assets,
 period end               9.48       9.59       9.61       7.71       7.92

(1)  Noncore deposits includes Internet CDs, brokered deposits and CDs
     greater than $100,000

Contact Information: Contact: Investor Relations (888) 343-8147 Website: www.bankmbank.com