MACKINAC FINANCIAL CORPORATION AND SUBSIDIARIES
SELECTED FINANCIAL HIGHLIGHTS
(Dollars in thousands, except per share data)
For The Period Ended
------------------------------------------
March 31, December 31, March 31,
2010 2009 2009
------------ ------------ ------------
(Unaudited) (Unaudited) (Unaudited)
Selected Financial Condition
Data (at end of period):
Assets $ 502,427 $ 515,377 $ 466,375
Loans 377,311 384,310 370,776
Investment securities 36,841 46,513 51,071
Deposits 405,212 421,389 385,757
Borrowings 36,140 36,140 36,210
Shareholders' Equity 58,722 55,299 41,864
Selected Statements of Income
Data:
Net interest income $ 4,022 $ 16,287 $ 3,495
Income before taxes and
preferred dividend 300 3,536 97
Net income 3,526 1,907 90
Income per common share - Basic 1.03 .56 .03
Income per common share -
Diluted 1.03 .56 .03
Weighted average shares
outstanding 3,419,736 3,419,736 3,419,736
Selected Financial Ratios and
Other Data:
Performance Ratios:
Net interest margin 3.51% 3.59% 3.35%
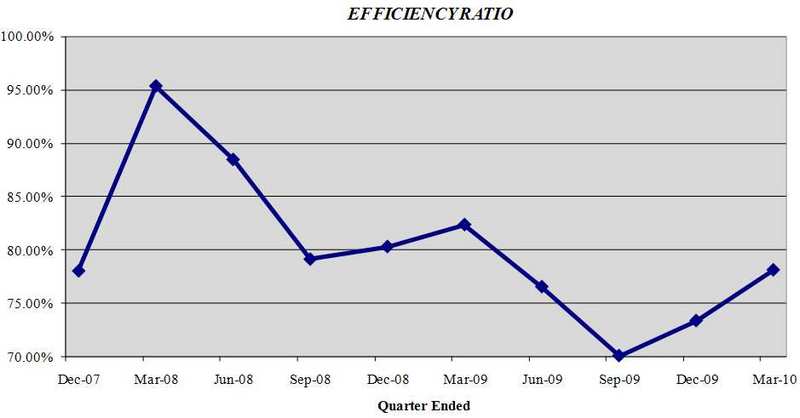
Efficiency ratio 78.12 73.37 82.36
Return on average assets 2.81 .39 .08
Return on average equity 25.95 3.77 .87
Average total assets $ 508,495 $ 493,652 $ 454,741
Average total shareholders'
equity 55,109 50,531 41,813
Average loans to average
deposits ratio 92.93% 92.99% 99.54%
Common Share Data (at end of
period):
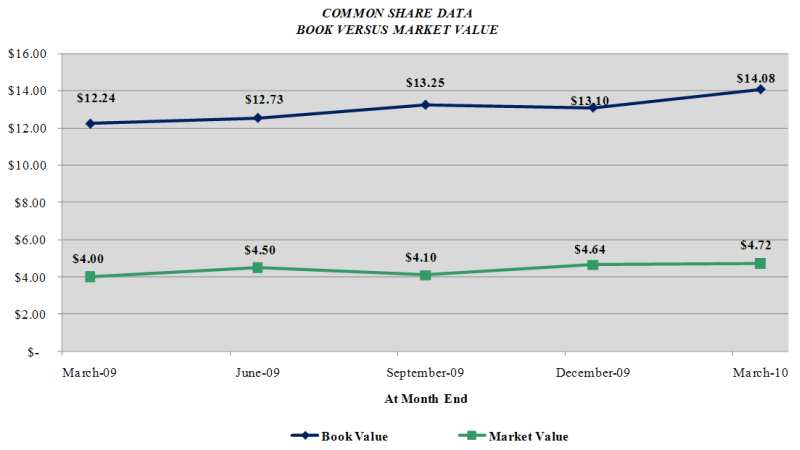
Market price per common share $ 4.72 $ 4.64 $ 4.00
Book value per common share $ 14.08 $ 13.10 $ 12.24
Common shares outstanding 3,419,736 3,419,736 3,419,736
Other Data (at end of period):
Allowance for loan losses $ 4,737 $ 5,225 $ 4,793
Non-performing assets $ 17,619 $ 21,041 $ 15,252
Allowance for loan losses to
total loans 1.26% 1.36% 1.29%
Non-performing assets to total
assets 3.51% 4.08% 3.27%
Number of:
Branch locations 10 10 13
FTE Employees 103 100 101
MACKINAC FINANCIAL CORPORATION AND SUBSIDIARIES
CONSOLIDATED BALANCE SHEETS
March 31, December 31, March 31,
(Dollars in thousands) 2010 2009 2009
------------ ------------ ------------
(unaudited) (unaudited)
ASSETS
Cash and due from banks $ 19,359 $ 18,433 $ 21,394
Federal funds sold 36,000 27,000 -
------------ ------------ ------------
Cash and cash equivalents 55,359 45,433 21,394
Interest-bearing deposits in
other financial institutions 700 678 569
Securities available for sale 36,841 46,513 51,071
Federal Home Loan Bank stock 3,794 3,794 3,794
Loans:
Commercial 296,271 305,670 295,595
Mortgage 76,996 74,350 71,554
Installment 4,044 4,290 3,627
------------ ------------ ------------
Total Loans 377,311 384,310 370,776
Allowance for loan
losses (4,737) (5,225) (4,793)
------------ ------------ ------------
Net loans 372,574 379,085 365,983
Premises and equipment 10,060 10,165 11,134
Other real estate held for sale 7,723 5,804 2,199
Other assets 15,376 23,905 10,231
------------ ------------ ------------
TOTAL ASSETS $ 502,427 $ 515,377 $ 466,375
============ ============ ============
LIABILITIES AND SHAREHOLDERS'
EQUITY
LIABILITIES:
Deposits:
Noninterest bearing deposits $ 30,356 $ 35,878 $ 31,541
NOW, money market, checking 109,374 95,790 75,026
Savings 20,675 18,207 19,585
CDs < $100,000 75,822 59,953 70,708
CDs > $100,000 30,173 36,385 26,886
Brokered 138,812 175,176 162,011
------------ ------------ ------------
Total deposits 405,212 421,389 385,757
Borrowings:
Federal Home Loan Bank 35,000 35,000 -
Other 1,140 1,140 36,210
------------ ------------ ------------
Total borrowings 36,140 36,140 36,210
Other liabilities 2,353 2,549 2,544
------------ ------------ ------------
Total liabilities 443,705 460,078 424,511
Shareholders' equity:
Preferred stock - No par
value:
Authorized 500,000 shares,
11,000 shares issued and
outstanding 10,562 10,514 -
Common stock and additional
paid in capital - No par
value
Authorized - 18,000,000
shares
Issued and outstanding -
3,419,736 shares 43,502 43,493 42,833
Accumulated earnings
(deficit) 3,724 199 (1,618)
Accumulated other
comprehensive income 934 1,093 649
------------ ------------ ------------
Total shareholders'
equity 58,722 55,299 41,864
------------ ------------ ------------
TOTAL LIABILITIES AND
SHAREHOLDERS' EQUITY $ 502,427 $ 515,377 $ 466,375
============ ============ ============
MACKINAC FINANCIAL CORPORATION AND SUBSIDIARIES
CONSOLIDATED STATEMENTS OF OPERATIONS
Three Months Ended
March 31,
---------------------------
(Dollars in thousands except per share data) 2010 2009
------------ -------------
(Unaudited) (Unaudited)
INTEREST INCOME:
Interest and fees on loans:
Taxable $ 5,191 $ 5,002
Tax-exempt 52 90
Interest on securities:
Taxable 397 459
Tax-exempt 7 1
Other interest income 40 2
------------ -------------
Total interest income 5,687 5,554
------------ -------------
INTEREST EXPENSE:
Deposits 1,457 1,778
Borrowings 208 281
------------ -------------
Total interest expense 1,665 2,059
------------ -------------
Net interest income 4,022 3,495
Provision for loan losses 900 550
------------ -------------
Net interest income after provision for loan
losses 3,122 2,945
------------ -------------
OTHER INCOME:
Service fees 223 243
Net security gains 215 -
Net gains on sale of secondary market
loans 316 58
Other 53 90
------------ -------------
Total noninterest income 807 391
------------ -------------
OTHER EXPENSE:
Salaries and employee benefits 1,720 1,597
Occupancy 345 378
Furniture and equipment 194 189
Data processing 189 220
Professional service fees 173 153
Loan and deposit 395 136
FDIC insurance assessment 222 125
Telephone 47 43
Advertising 72 78
Other 272 320
------------ -------------
Total noninterest expense 3,629 3,239
------------ -------------
Income before provision for income taxes 300 97
Provision for income taxes (3,411) 7
------------ -------------
NET INCOME 3,711 90
------------ -------------
Preferred dividend and accretion of discount 185 -
------------ -------------
NET INCOME AVAILABLE TO COMMON SHAREHOLDERS 3,526 90
============ =============
INCOME PER COMMON SHARE:
Basic $ 1.03 $ .03
============ =============
Diluted $ 1.03 $ .03
============ =============
MACKINAC FINANCIAL CORPORATION AND SUBSIDIARIES
LOAN PORTFOLIO AND CREDIT QUALITY
(Dollars in thousands)
Loan Portfolio Balances (at end of period):
March 31, December 31, March 31,
2010 2009 2009
------------- ------------- -------------
Commercial Loans
Real estate - operators of
nonresidential buildings $ 49,753 $ 48,689 $ 40,457
Hospitality and tourism 44,820 45,315 35,224
Real estate agents and managers 21,529 24,242 28,012
Operators of nonresidential
buildings 13,170 12,619 13,512
Other 138,964 150,214 151,732
------------- ------------- -------------
Total Commercial Loans 268,236 281,079 268,937
1-4 family residential real
estate 70,087 67,232 65,792
Consumer 4,044 4,290 3,627
Construction
Commercial 28,035 24,591 26,658
Consumer 6,909 7,118 5,762
------------- ------------- -------------
Total Loans $ 377,311 $ 384,310 $ 370,776
============= ============= =============
Credit Quality (at end of period):
March 31, December 31, March 31,
2010 2009 2009
------------ ------------ ------------
Nonperforming Assets:
Nonaccrual loans $ 9,027 $ 14,368 $ 12,461
Loans past due 90 days or more - - -
Restructured loans 869 869 592
------------ ------------ ------------
Total nonperforming loans 9,896 15,237 13,053
Other real estate owned 7,723 5,804 2,199
------------ ------------ ------------
Total nonperforming assets $ 17,619 $ 21,041 $ 15,252
============ ============ ============
Nonperforming loans as a % of
loans 2.62% 3.96% 3.52%
------------ ------------ ------------
Nonperforming assets as a % of
assets 3.51% 4.08% 3.27%
------------ ------------ ------------
Reserve for Loan Losses:
At period end $ 4,737 $ 5,225 $ 4,793
------------ ------------ ------------
As a % of loans 1.26% 1.39% 1.29%
------------ ------------ ------------
As a % of nonperforming loans 47.87% 34.29% 36.72%
------------ ------------ ------------
As a % of nonaccrual loans 52.48% 36.37% 38.46%
============ ============ ============
Charge-off Information (year to
date):
Average loans 384,640 374,796 370,943
------------ ------------ ------------
Net charge-offs 1,389 2,752 34
------------ ------------ ------------
Charge-offs as a % of
average loans .36% .73% .01%
------------ ------------ ------------
MACKINAC FINANCIAL CORPORATION AND SUBSIDIARIES QUARTERLY FINANCIAL
HIGHLIGHTS
QUARTER ENDED
-------------------------------------------------------------
(Unaudited)
-------------------------------------------------------------
March 31, December 31, September 30, June 30, March 31,
2010 2009 2009 2009 2009
--------- ------------ ------------- --------- ---------
BALANCE
SHEET
(Dollars in
thousands)
Total loans $ 377,311 $ 384,310 $ 384,100 $ 372,004 $ 370,776
Allowance
for loan
losses (4,737) (5,225) (4,081) (4,119) (4,793)
--------- ------------ ------------- --------- ---------
Total
loans,
net 372,574 379,085 380,019 367,885 365,983
Intangible
assets - - - 6 26
Total assets 502,427 515,377 513,180 506,304 466,375
Core
deposits 236,227 209,828 200,541 202,892 196,860
Noncore
deposits
(1) 168,985 211,561 218,040 210,260 188,897
--------- ------------ ------------- --------- ---------
Total
deposits 405,212 421,389 418,581 413,152 385,757
Total
borrowings 36,140 36,140 36,140 36,210 36,210
Total
shareholders'
equity 58,722 55,299 55,766 53,939 41,864
Total shares
outstanding 3,419,736 3,419,736 3,419,736 3,419,736 3,419,736
AVERAGE
BALANCES
(Dollars in
thousands)
Assets $ 508,495 $ 514,102 $ 513,687 $ 491,205 $ 454,740
Loans 384,640 386,203 370,310 371,609 370,943
Deposits 413,897 418,280 419,102 401,510 372,669
Equity 55,109 55,665 54,594 49,855 41,813
INCOME
STATEMENT
(Dollars in
thousands)
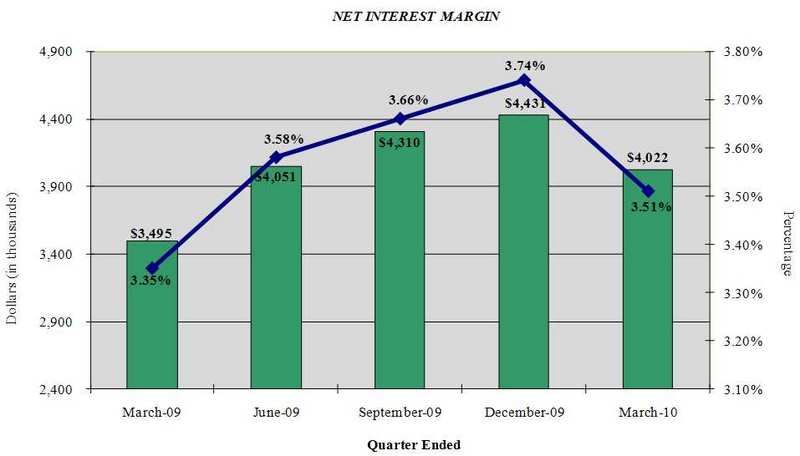
Net interest
income $ 4,022 $ 4,431 $ 4,310 $ 4,051 $ 3,495
Provision
for loan
losses 900 2,300 700 150 550
--------- ------------ ------------- --------- ---------
Net
interest
income
after
pro-
vision 3,122 2,131 3,610 3,901 2,945
Total
noninterest
income 807 1,503 2,418 439 391
Total
noninterest
expense 3,629 3,650 3,443 3,470 3,239
--------- ------------ ------------- --------- ---------
Income
before
taxes 300 (16) 2,585 870 97
Provision
for income
taxes (3,411) (22) 864 271 7
--------- ------------ ------------- --------- ---------
Net
income 3,711 6 1,721 599 90
--------- ------------ ------------- --------- ---------
Preferred
dividend
expense 185 186 185 138 -
--------- ------------ ------------- --------- ---------
Net income
available
to common
share-
holders $ 3,526 $ (180) $ 1,536 $ 461 $ 90
========= ============ ============= ========= =========
PER SHARE
DATA
Earnings $ 1.03 $ (.05) $ .45 $ .13 $ .03
Book value
per common
share 14.08 13.10 13.25 12.73 12.24
Market
value,
closing
price 4.72 4.64 4.10 4.50 4.00
ASSET
QUALITY
RATIOS
Nonperforming
loans/total
loans 2.62% 3.96 % 3.00% 2.66% 3.52%
Nonperforming
assets/total
assets 3.51 4.08 3.38 2.93 3.27
Allowance
for loan
losses/
total
loans 1.26 1.36 1.06 1.11 1.29
Allowance
for loan
losses/non-
performing
loans 47.87 34.29 35.40 41.71 36.72
PROFITABILITY
RATIOS
Return on
average
assets 2.81% (.14)% 1.19% .38% .08%
Return on
average
equity 25.95 (1.28) 11.16 3.71 .87
Net interest
margin 3.51 3.74 3.66 3.58 3.35
Efficiency
ratio 78.12 71.03 70.09 76.55 82.36
Average
loans/average
deposits 92.93 92.33 88.36 92.55 99.54
CAPITAL
ADEQUACY
RATIOS
Tier 1
leverage
ratio 9.85% 9.75 % 9.74% 9.65% 7.86%
Tier 1
capital to
risk
weighted
assets 12.48 11.92 12.18 11.94 9.31
Total
capital to
risk
weighted
assets 13.69 13.17 13.19 13.00 10.56
Average
equity/
average
assets 10.84 10.83 10.63 10.15 9.19
Tangible
equity/
tangible
assets 10.84 10.83 10.87 10.65 8.97
(1) Noncore deposits includes Internet CDs, brokered deposits and CDs
greater than $100,000
Contact Information: Contact: Investor Relations (888) 343-8147 Website: www.bankmbank.com