Mackinac Financial Corporation Reports Third Quarter and Nine Months 2007 Results


MANISTIQUE, MI--(Marketwire - October 25, 2007) - Mackinac Financial Corporation (NASDAQ: MFNC), the bank holding company for mBank (the "Bank") today announced third quarter 2007 income of $8.055 million or $2.35 per share compared to net income of $.690 million, or $.20 per share for the third quarter of 2006. Net income for the first nine months of 2007 totaled $9.636 million, or $2.81 per share, compared to $1.378 million, or $.40 per share, for the same period in 2006. The results of operations for the first nine months of 2007 include the recognition of a deferred tax benefit in the amount of $7.500 million, $470,000, of proceeds from the settlement of a lawsuit against the Corporation's former accountants, and a provision for loan losses of $400,000. The third quarter provision was impacted by one commercial credit which originated prior to the current management team. The loan, which currently is performing as agreed, is secured solely by a hotel property. The borrower has indicated their intent to default the loan unless a request for restructuring is granted. An appraisal was obtained as part of negotiations with the borrower which indicated some deterioration in the value of the underlying asset. These facts, coupled with our continued growth in outstanding loans, led management to conclude that a provision is necessary. During the comparable nine month period in 2006, the Bank recorded a $600,000 negative provision for loan losses in recognition of improved credit quality, as well as a $500,000 provision for the benefit of income taxes. Excluding these items provides a more revealing picture of operating results. The adjusted figures show net income in the first nine months of 2007 of $2.066 million, or $.60 per share, compared to an adjusted net income of $.278 million, or $.08 per share, for the same period in 2006. The adjusted 2007 third quarter figures show net income of $.955 million, or $.28 per share, compared to $.190 million, or $.06 per share, in the third quarter of 2006.

Paul Tobias, Chairman and Chief Executive Officer, commented, "We are extremely pleased that we have attained the earnings momentum necessary for us to recognize the deferred tax benefit related to NOL and tax credit carry-forwards. We have established, with our current asset base, the foundation for continued profitability as evidenced by our sixth consecutive quarter of core earnings."

Tobias continued, "Our core earnings have been enhanced with increases in our net interest margin due to our strong pricing discipline. Growth within our organization is secondary to our increased profitability objectives. We continue to monitor the progress of Michigan's economy and ongoing foreclosure trends related to consumer mortgage lending. As a bank focused on commercial lending, we are also monitoring, as part of our normal underwriting discipline, the valuation of our commercial real estate collateral and its importance in our loan grading system. While we are aware of the increased credit issues within our industry and within Michigan, we have not experienced any significant deterioration in our overall credit quality and our nonperforming assets are well below peer levels. We were not participants in the subprime mortgage industry."

Total assets of the Corporation at September 30, 2007 were $401.213 million, up 10.47 percent from the $363.191 million in total assets reported at September 30, 2006. Third quarter-end total assets were up 4.81 percent from the $382.791 million of total assets at year-end 2006.

Total loans at September 30, 2007 were $344.149 million, a 17.61% increase from the $292.614 million at September 30, 2006. Total loans at the end of the third quarter of 2007 increased $21.658 million, or 6.69 percent from year-end 2006 total loans of $322.581 million. Tobias stated, "We are satisfied with our net loan growth thus far in 2007 and remain optimistic about future growth opportunities given our continued new loan production and pipeline activity. We experienced significant loan paydowns and refinancings earlier in 2007 due in part to our decision to hold the line on pricing and our unwillingness to compromise credit quality in the midst of an economic slowdown. We continue to have new loan opportunities, but feel it is prudent to exercise growth constraints in times of economic uncertainty. We expect to continue to grow loans over our long term planning horizon, but we have placed the emphasis on deposit growth and margin improvement in the current credit environment."

Total deposits of $321.371 million at September 30, 2007 were up 9.50 percent from deposits of $293.494 million on September 30, 2006. Deposits were up $8.950 million, 2.87 percent from year-end 2006 deposits of $312.421 million. Total 2007 deposit growth reflects decreases in noncore funding of $10.079 million and increases in core deposits of $19.029 million, or 9.53%. Mr. Tobias added, "The growth of core deposit balances continues to be a primary focal point in order to increase margin contribution. In 2007, we have been successful in the growth of core deposits to fund 100% of current year loan growth. Continued growth of core deposits, especially transactional account balances, will have the biggest impact on increased profitability and franchise value. We continue to build a culture that focuses on profitable relationships anchored by core deposits."

Nonperforming loans at the end of the third quarter of 2007 totaled $3.172 million (.92% of loans), an increase of $.233 million from 2006 year end balances. This 2007 increase in nonperforming assets is not indicative of significant deterioration in portfolio credit quality and is still relatively low by comparative peer standards. Current nonperforming loan balances include one large commercial credit relationship which represents 56% of the total, approximately $1.8 million. The loans associated with this relationship originated before the current management team was in place. We have allocated specific reserve balances to these loans, which we believe covers our potential principal loss. Tobias, commenting on credit quality stated, "We remain confident that our credit process is a major strength. This process includes an aggressive early resolution process for nonperforming assets, which limits our losses."

The net interest margin continues to show steady improvement, increasing from 3.36% in the third quarter of 2006 to 3.71% in the third quarter of 2007. Mr. Tobias commented, "The steady margin improvement is a clear illustration of the positive results achieved from loan and deposit pricing decisions and an improved deposit mix."

Shareholders' equity at September 30, 2007 totaled $38.697 million, or $11.29 per share, compared to $28.226 million, or $8.23 per share on September 30, 2006.

Tobias concluded, "We are pleased with our nine months earnings results. Our emphasis continues to be on core deposit growth. We recently expanded our deposit gathering efforts with courier services to small and medium sized businesses in addition to selective second quarter staffing additions. We continue to review opportunities to improve noninterest income. We have been moderately successful in generating fees from sales of loans to the secondary market, as well as the guaranteed portion of SBA loans. The contribution from increased noninterest income, expense control, and our diligence in pricing will move us toward our profitability objectives. We remain committed to our goal of increased profitability and shareholder value."

Mackinac Financial Corporation is a registered bank holding company which owns mBank. The Bank has 12 offices; eight in the Upper Peninsula, three in the Northern Lower Peninsula and one in Oakland County, Michigan. The Company's banking services include commercial lending and treasury management products and services geared toward small to mid-sized businesses; as well as checking and savings accounts, time deposits, interest bearing transaction accounts, safe deposit facilities, real estate mortgage lending, and direct and indirect consumer financing.

Forward-Looking Statements

This release contains certain forward-looking statements. Words such as "anticipates," "believes," "estimates," "expects," "intends," "should," "will," and variations of such words and similar expressions are intended to identify forward-looking statements: as defined by the Private Securities Litigation Reform Act of 1995. These statements reflect management's current beliefs as to expected outcomes of future events and are not guarantees of future performance. These statements involve certain risks, uncertainties and assumptions that are difficult to predict with regard to timing, extent, likelihood and degree of occurrence. Therefore, actual results and outcomes may materially differ from what may be expressed or forecasted in such forward-looking statements. Factors that could cause a difference include among others: changes in the national and local economies or market conditions; changes in interest rates and banking regulations; the impact of competition from traditional or new sources; and the possibility that anticipated cost savings and revenue enhancements from mergers and acquisitions, bank consolidations, branch closings and other sources may not be fully realized at all or within specified time frames as well as other risks and uncertainties including but not limited to those detailed from time to time in filings of the Company with the Securities and Exchange Commission. These and other factors may cause decisions and actual results to differ materially from current expectations. Mackinac Financial Corporation undertakes no obligation to revise, update, or clarify forward-looking statements to reflect events or conditions after the date of this release.


               MACKINAC FINANCIAL CORPORATION AND SUBSIDIARIES
                    SELECTED FINANCIAL HIGHLIGHTS

(Dollars in thousands, except per share data)
                                            For The Period Ended
                                     -------------------------------------
                                      September    December    September
                                         30,          31,          30,
                                        2007         2006         2006
                                     -----------  -----------  -----------
                                     (Unaudited)               (Unaudited)
Selected Financial Condition Data
 (at end of period):
Total assets                         $   401,213  $   382,791  $   363,191
Total loans                              344,149      322,581      292,614
Total deposits                           321,371      312,421      293,494
Borrowings and subordinated
 debentures                               38,239       38,307       38,307
Total shareholders' equity                38,697       28,790       28,226

Selected Statements of Income Data
 (nine months and year ended):
Net interest income                  $    10,007  $    11,593  $     8,566
Income before taxes                        2,136        1,216          878
Net income                                 9,636        1,716        1,378
Income per common share - Basic             2.81          .50          .40
Income per common share - Diluted           2.81          .50          .40

Three Months Ended:
Net interest income                  $     3,560  $     3,027  $     2,952
Income before taxes                          555          338          190
Net income                                 8,055          338          690
Income per common share - Basic             2.35          .10          .20
Income per common share - Diluted           2.35          .10          .20

Selected Financial Ratios and Other
 Data (nine months and year ended):
Performance Ratios:
Net interest margin                         3.62%        3.51%        3.53%
Efficiency ratio                           79.94        93.95        93.83
Return on average assets                    3.32          .49          .54
Return on average equity                   42.07         6.19         6.71

Average total assets                 $   387,597  $   347,927  $   341,646
Average total shareholders' equity   $    30,627  $    27,744  $    27,440
Average loans to average deposits
 ratio                                    103.89%       99.77%       98.86%

Common Share Data (at end of
 period):
Market price per common share        $      8.75  $     11.50  $     10.56
Book value per common share          $     11.29  $      8.40  $      8.23
Common shares outstanding              3,428,695    3,428,695    3,428,695
Weighted average shares outstanding    3,428,695    3,428,695    3,428,695

Other Data (at end of period):
Allowance for loan losses            $     5,022  $     5,006  $     5,316
Non-performing assets                $     3,623  $     2,965  $     2,091
Allowance for loan losses to total
 loans                                      1.46%        1.55%        1.82%
Non-performing assets to total
 assets                                      .90%         .77%         .58%
Number of:
   Branch locations                           13           13           13
   FTE Employees                             105           99           97


               MACKINAC FINANCIAL CORPORATION AND SUBSIDIARIES
                       CONSOLIDATED BALANCE SHEETS


                                      September     December    September
                                         30,          31,          30,
                                         2007         2006         2006
                                     -----------  -----------  -----------
                                     (unaudited)               (unaudited)
ASSETS

Cash and due from banks              $     7,364  $     4,865  $     5,537
Federal funds sold                           947        5,841       11,949
                                     -----------  -----------  -----------
   Cash and cash equivalents               8,311       10,706       17,486

Interest-bearing deposits in other
 financial institutions                    6,995          856          889
Securities available for sale             17,973       32,769       36,129
Federal Home Loan Bank stock               3,794        3,794        4,152

Loans:
   Commercial                            285,680      261,726      238,481
   Mortgage                               54,962       58,014       51,341
   Installment                             3,507        2,841        2,792
                                     -----------  -----------  -----------
     Total Loans                         344,149      322,581      292,614
       Allowance for loan losses          (5,022)      (5,006)      (5,316)
                                     -----------  -----------  -----------
   Net loans                             339,127      317,575      287,298

Premises and equipment                    12,733       12,453       12,643
Other real estate held for sale              451           26           26
Other assets                              11,829        4,612        4,568
                                     -----------  -----------  -----------

TOTAL ASSETS                         $   401,213  $   382,791  $   363,191
                                     ===========  ===========  ===========

LIABILITIES AND SHAREHOLDERS' EQUITY
Liabilities:
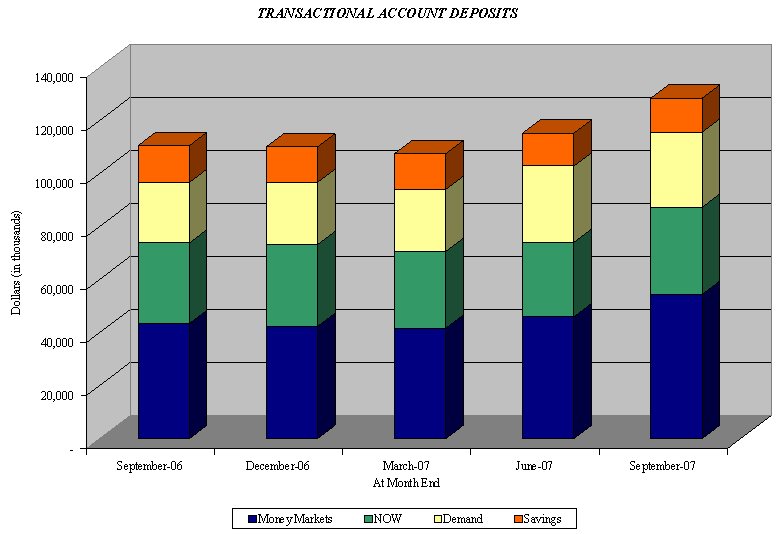
   Non-interest-bearing deposits     $    28,325  $    23,471  $    22,826
   Interest-bearing deposits:
     NOW and Money Market                 87,262       73,188       73,797
     Savings                              12,831       13,365       13,915
     CDs < $100,000                       90,220       89,585       85,236
     CDs > $100,000                       24,432       23,645       20,305
     Brokered                             78,301       89,167       77,415
                                     -----------  -----------  -----------
       Total deposits                    321,371      312,421      293,494

   Borrowings                             38,239       38,307       38,307
   Other liabilities                       2,906        3,273        3,164
                                     -----------  -----------  -----------
     Total liabilities                   362,516      354,001      334,965

Shareholders' equity:
   Preferred stock - No par value:
     Authorized 500,000 shares, no
      shares outstanding
   Common stock and additional paid
    in capital - No par value
     Authorized - 18,000,000 shares
     Issued and outstanding -
      3,428,695 shares                    42,810       42,722       42,646
     Accumulated deficit                  (4,107)     (13,745)     (14,083)
     Accumulated other comprehensive
      (loss)                                  (6)        (187)        (337)
                                     -----------  -----------  -----------

       Total shareholders' equity         38,697       28,790       28,226
                                     -----------  -----------  -----------

TOTAL LIABILITIES AND SHAREHOLDERS'
 EQUITY                              $   401,213  $   382,791  $   363,191
                                     ===========  ===========  ===========


                MACKINAC FINANCIAL CORPORATION AND SUBSIDIARIES
                  CONSOLIDATED STATEMENTS OF OPERATIONS

                             Three Months Ended      Nine Months Ended
                                September 30,           September 30,
                            ----------------------  ----------------------
                               2007        2006        2007        2006
                            ----------  ----------  ----------  ----------

INTEREST INCOME:
  Interest and fees on
   loans:
     Taxable                $    6,929  $    5,635  $   19,610  $   15,316
     Tax-exempt                    118         189         432         575
  Interest on securities
     Taxable                       263         306         857         852
     Tax-exempt                      -           5           -          87
  Other interest                   209         268         575         631
                            ----------  ----------  ----------  ----------
     Total interest income       7,519       6,403      21,474      17,461
                            ----------  ----------  ----------  ----------

INTEREST EXPENSE:
   Deposits                      3,443       2,951       9,932       7,540
   Borrowings                      516         500       1,535       1,355
                            ----------  ----------  ----------  ----------
     Total interest expense      3,959       3,451      11,467       8,895
                            ----------  ----------  ----------  ----------

Net interest income              3,560       2,952      10,007       8,566
Provision for loan losses          400           -         400        (600)
                            ----------  ----------  ----------  ----------
Net interest income after
 provision for loan losses       3,160       2,952       9,607       9,166
                            ----------  ----------  ----------  ----------

OTHER INCOME:
   Service fees                    169         133         515         365
   Net gains on sale of
    secondary market loans         165          66         364         149
   Proceeds from settlement
    of lawsuit                       -           -         470           -
   Other                            62          41         302         193
                            ----------  ----------  ----------  ----------
     Total other income            396         240       1,651         707
                            ----------  ----------  ----------  ----------
OTHER EXPENSE:
   Salaries and employee
    benefits                     1,695       1,487       5,106       4,577
   Occupancy                       322         333         983         943
   Furniture and equipment         178         159         501         470
   Data processing                 196         176         577         512
   Professional service
    fees                            78         341         403         955
   Loan and deposit                 63          78         214         305
   Telephone                        68          55         185         155
   Advertising                      97          70         280         247
   Other                           304         303         873         831
                            ----------  ----------  ----------  ----------
     Total other expense         3,001       3,002       9,122       8,995
                            ----------  ----------  ----------  ----------

Income before income taxes         555         190       2,136         878
Provision for (benefit of)
 income taxes                   (7,500)       (500)     (7,500)       (500)
                            ----------  ----------  ----------  ----------
NET INCOME                  $    8,055  $      690  $    9,636  $    1,378
                            ==========  ==========  ==========  ==========
INCOME PER COMMON SHARE:
   Basic                    $     2.35  $      .20  $     2.81  $      .40
                            ==========  ==========  ==========  ==========
   Diluted                  $     2.35  $      .20  $     2.81  $      .40
                            ==========  ==========  ==========  ==========


               MACKINAC FINANCIAL CORPORATION AND SUBSIDIARIES
                   LOAN PORTFOLIO AND CREDIT QUALITY

(Dollars in thousands)

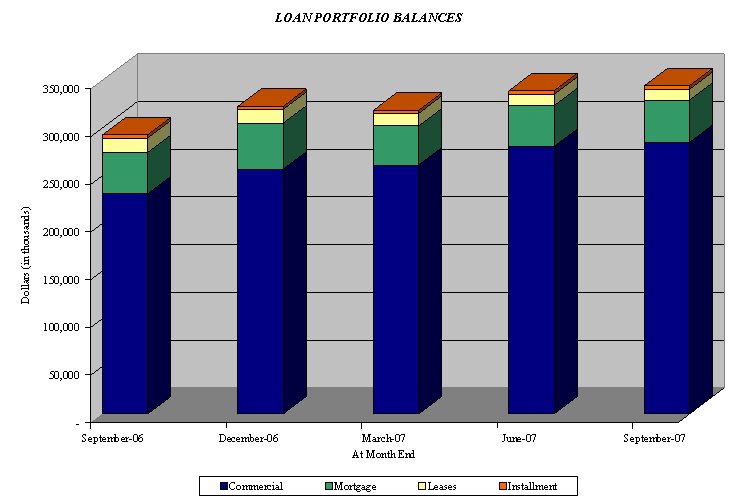
Loan Portfolio Balances (at end of period):

                                  September 30, December 31,  September 30,
                                      2007          2006          2006
                                  ------------- ------------- -------------
Commercial Loans
Real estate - operators of
 nonresidential buildings         $      43,422 $      44,308 $      35,965
Hospitality and tourism                  37,479        30,826        37,287
Real estate agents and managers          25,662        25,071        19,744
Offices of holding companies             10,831         4,989         1,496
Other                                   122,460       120,523       110,894
                                  ------------- ------------- -------------
   Total Commercial Loans               239,854       225,717       205,386

1-4 family residential real
 estate                                  54,962        58,014        51,341
Construction                             45,826        36,009        33,095
Consumer                                  3,507         2,841         2,792
                                  ------------- ------------- -------------

   Total Loans                    $     344,149 $     322,581 $     292,614
                                  ============= ============= =============

Average loans for the period      $     327,810 $     278,953 $     271,351
                                  ============= ============= =============


Credit Quality (at end of period):

                                  September 30, December 31,  September 30,
                                      2007          2006          2006
                                  ------------- ------------- -------------
Nonperforming Assets :
Nonaccrual loans                  $      3,136  $      2,899  $      2,065
Loans past due 90 days or more              36            40             -
Restructured loans                           -             -             -
                                  ------------  ------------  ------------
   Total nonperforming loans             3,172         2,939         2,065
Other real estate owned                    451            26            26
                                  ------------  ------------  ------------
   Total nonperforming assets     $      3,623  $      2,965  $      2,091
                                  ============  ============  ============
Nonperforming loans as a % of
 loans                                     .92%          .91%          .71%
                                  ------------  ------------  ------------
Nonperforming assets as a % of
 assets                                    .90%          .77%          .58%
                                  ------------  ------------  ------------
Reserve for Loan Losses:
At period end                     $      5,022  $      5,006  $      5,316
                                  ------------  ------------  ------------
As a % of loans                           1.46%         1.55%         1.82%
                                  ------------  ------------  ------------
As a % of nonperforming loans           158.32%       170.33%       257.43%
                                  ------------  ------------  ------------
As a % of nonaccrual loans              160.14%       172.68%       257.43%
                                  ------------  ------------  ------------
Net charge-offs as a % of average
 loans                                     .12%          .08%          .07%
                                  ============  ============  ============


               MACKINAC FINANCIAL CORPORATION AND SUBSIDIARIES
                   QUARTERLY FINANCIAL HIGHLIGHTS

                                         QUARTER ENDED
                                          (Unaudited)
                     -----------------------------------------------------
                     September    June       March    December   September
                        30,        30,        31,        31,        30,
                       2007       2007       2007       2006       2006
                     ---------  ---------  ---------  ---------  ---------
BALANCE SHEET
 (Dollars in
 thousands)

Total loans          $ 344,149  $ 338,896  $ 318,421  $ 322,581  $ 292,614
Allowance for loan
 losses                 (5,022)    (4,920)    (4,975)    (5,006)    (5,316)
                     ---------  ---------  ---------  ---------  ---------
   Total loans, net    339,127    333,976    313,446    317,575    287,298
Intangible assets          143        163        182        205        237
Total assets           401,213    393,319    375,644    382,791    363,191
Core deposits          218,638    211,773    201,529    199,609    195,774
Noncore deposits (1)   102,733    109,473    102,883    112,812     97,720
                     ---------  ---------  ---------  ---------  ---------
   Total deposits      321,371    321,246    304,412    312,421    293,494
Total borrowings        38,239     38,307     38,307     38,307     38,307
Total shareholders'
 equity                 38,697     30,485     29,932     28,790     28,226
Total shares
 outstanding         3,428,695  3,428,695  3,428,695  3,428,695  3,428,695

AVERAGE BALANCES
 (Dollars in
 thousands)

Assets               $ 400,105  $ 382,065  $ 380,403  $ 366,566  $ 362,632
Loans                  340,391    324,721    318,072    301,508    289,210
Deposits               327,293    309,469    309,619    294,755    296,608
Equity                  32,184     30,412     29,254     28,646     28,041

INCOME STATEMENT
 (Dollars in
 thousands)

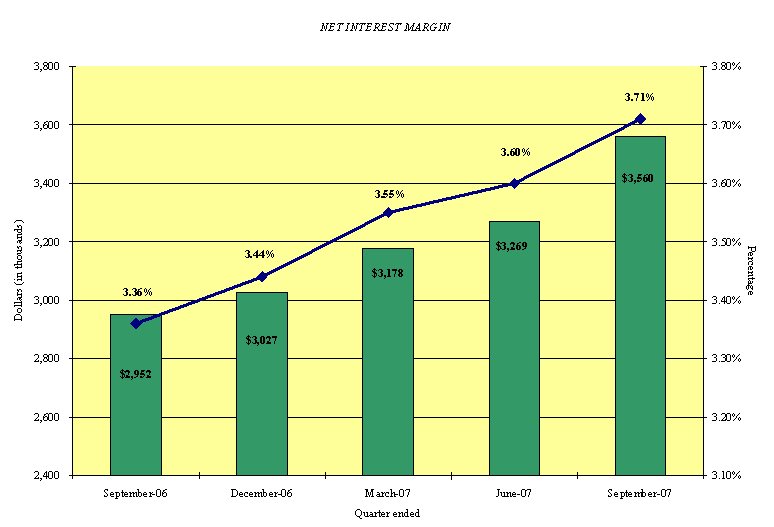
Net interest income  $   3,560  $   3,269  $   3,178  $   3,027  $   2,952
Provision for loan
 losses                    400          -          -       (261)         -
                     ---------  ---------  ---------  ---------  ---------
   Net interest
    income after
    provision            3,160      3,269      3,178      3,288      2,952
Total noninterest
 income                    396        342        913        276        240
Total noninterest
 expense                 3,001      3,065      3,056      3,226      3,002
                     ---------  ---------  ---------  ---------  ---------
Income before taxes        555        546      1,035        338        190
Provision for income
 taxes                  (7,500)         -          -          -       (500)
                     ---------  ---------  ---------  ---------  ---------
Net income           $   8,055  $     546  $   1,035  $     338  $     690
                     =========  =========  =========  =========  =========

PER SHARE DATA

Earnings - basic     $    2.35  $     .16  $     .30  $     .10  $     .20
Earnings - diluted        2.35        .16        .30        .10        .20
Book value               11.29       8.89       8.73       8.40       8.23
Market value,
 closing price            8.75       9.45       9.26      11.50      10.56

ASSET QUALITY RATIOS

Nonperforming
 loans/total loans         .92%      1.49%      1.53%       .91%       .71%
Nonperforming
 assets/total assets       .90       1.30       1.33        .77        .58
Allowance for loan
 losses/total loans       1.46       1.45       1.56       1.55       1.82
Allowance for loan
 losses/nonperformi-
 ng loans               158.32      97.45     102.32     170.33     257.43

PROFITABILITY RATIOS

Return on average
 assets                   7.99%       .57%      1.10%       .37%       .75%
Return on average
 equity                  99.30       7.20      14.35       4.68       9.76
Net interest margin       3.71       3.60       3.55       3.44       3.36
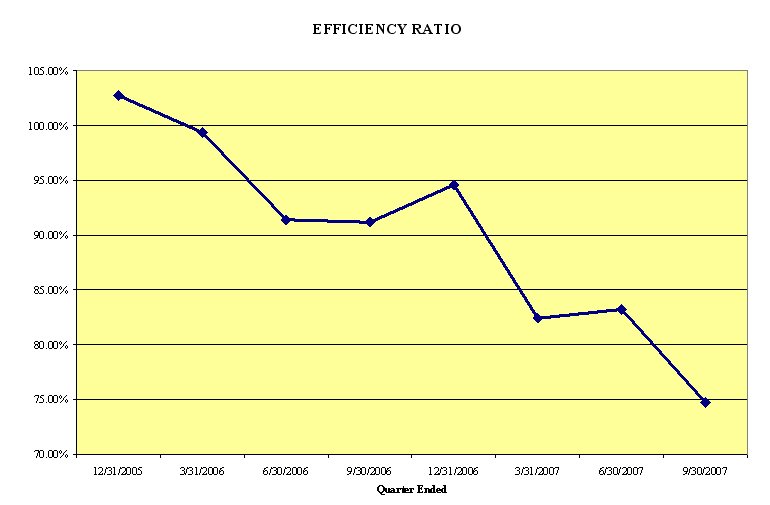
Efficiency ratio         74.71      83.21      82.40      94.60      91.17
Average
 loans/average
 deposits               104.00     104.93     102.73     102.29      97.51

CAPITAL ADEQUACY
 RATIOS

Tier 1 leverage
 ratio                    8.03%      7.97%      7.85%      7.85%      7.81%
Tier 1 capital to
 risk weighted
 assets                   9.03       8.85       9.16       8.77       9.36
Total capital to
 risk weighted
 assets                  10.28      10.10      10.41      10.02      10.62
Average
 equity/average
 assets                   8.04       7.96       7.69       7.81       7.73
Tangible
 equity/tangible
 assets, period end       9.61       7.71       7.92       7.47       7.71

(1)  Noncore deposits includes Internet CDs, brokered deposits and CDs
greater than $100,000

Contact Information: Contact: Investor Relations (888) 343-8147 Website: www.bankmbank.com