TORONTO, ONTARIO--(Marketwired - Aug. 14, 2013) - Appia Energy Corp. (the "Company" or "Appia") is pleased to announce that a Technical Report, in accordance with National Instrument NI 43-101 ("NI 43-101") reporting standards, entitled "Update Report on the Appia Energy Corp. Uranium-Rare Earth Property, Elliot Lake District, North-Central Ontario, Canada" dated July 30, 2013 has been filed on SEDAR (www.sedar.com). The report was completed by Watts, Griffis and McOuat ("WGM"), Consulting Geologists and Engineers, Toronto, Canada. Qualified Persons and Independent Consultants Al Workman, P.Geo was responsible for all sections of the Report and jointly responsible with Kurt Breede, P.Eng for the uranium-rare earth Mineral Resource Estimate for the Teasdale Zone and the Banana Lake Zone. John Goode, P.Eng was responsible for the Mineral Processing and Metallurgical Testing section of the Report.
The report focusses on the Teasdale Zone as no work has been done on the Banana Lake Zone or other zones since the July 18, 2011 Report.
Teasdale Lake Zone
The last Historical Resource Estimate for the Teasdale Lake Zone was prepared in 2007, is not NI 43-101 compliant and should not be relied upon for investment purposes. The reported tonnage was 17.5 million tons at an average grade of 1.2 lbs. U3O8 containing 20.8 million lbs. of U3O8.
The estimate of the Mineral Resources in the Teasdale Zone (Table 1) was initially reported in Workman and Breede (2011) based on drilling carried out by Appia during 2007-2008 and prepared using a polygonal model and geological constraints including a minimum bed thickness of 2.44 m (8 ft.) which takes into consideration the continuity of grade within the various mineralized beds and historical mining practices. The mineralized zone was geologically constrained by the well-defined markers provided by the upper surface of the highest mineralized bed and the lower surface of the basal bed. The resources were reported for each of the three geological units that comprise the mineralized zone: Upper Reef ("UR"), Intermediate Quartzite ("IQ") and Lower Reef ("LR"), as well as the average grade across all three units. As a result of the inclusion of the UR to incorporate its significant rare earth elements ("REE") content as well as the IQ, neither of which were mined historically, all drill hole intersections substantially exceeded the minimum thickness. No grade cut-off or high capping was used for this estimate as the grades were themselves quite robust and the utilization of a cut-off grade would require complex economic modelling of individual metals that is not required at this time.
Appia's most recent diamond drilling on the Teasdale Zone in 2012 comprised 16 holes from surface totaling 8,130 metres of drilling, with drill assay results materially increasing the size of the Teasdale Deposit under NI 43-101 reporting standards.
The current Mineral Resource estimate for the Teasdale Zone encompasses the most recent drilling which was carried out under the close scrutiny of WGM and under the supervision of QP Alan MacEachern. WGM revisited the project site in July, 2013 for discussions with Mr. MacEachern and visited a selection of drill sites for confirmation purposes. All work was found to have been completed in accordance with WGM's instructions and in accordance with industry best practices standards.
The sampling procedure utilized by Appia's personnel during the drill program is summarized as follows:
- the core was geologically logged and sections were selected for analysis based on geology and radiometric activity using a hand-held RS-125 Super-SPEC portable gamma ray spectrometer manufactured by Radiation Solutions of Mississauga, Ontario, Canada
- the mineralized core intervals were split in the core shack in Elliot Lake using a diamond core saw - one half of the drill core was bagged, a pre-numbered sample tag was placed in the bag and the samples was sealed before being sent to Activation Laboratories (ActLabs) in Ancaster, Ontario for analysis;
- the remaining half of the core was retained in the core tray as a permanent record;
- at the lab, the samples were dried, crushed and pulverized in preparation for the analysis for uranium, thorium, REEs, silver and 28 trace elements as well as the major oxides; and,
- the trays of split drill core are stored in core racks that are inside a locked building in Elliott Lake.
Appia analysed a total of 1,213 samples from the 16 diamond drill holes during the course of the 2012 drilling program. In addition, Appia included quality assurance/quality control samples made up of 27 duplicate samples, 13 blanks and 22 certified standards. Appia's control samples comprised approximately 1 sample in every 20. The samples were analysed at the Actlabs accredited geochemical laboratory located in Ancaster, Ontario. All samples were digested using a fusion technique. Trace elements, REEs, uranium and thorium contents were instrumentally measured using a mass spectrometer whereas major oxide contents were instrumentally determined by Induced Coupled Plasma. These procedures assure high-precision assays with an excellent range of effectiveness between the upper and lower detection limits.
Collectively only 24 drill holes have been assayed for rare earths, so the current Mineral Resource estimate has been restricted to the area of influence from these intersections, and the historical drill holes completed by others have been necessarily excluded. A cut-off value of $100 per tonne was used, based on a projected uranium price of US$70 per lb. U3O8 and a combined total REE ("TREE") price of US$78 per kg.
Table 1
Summary of Teasdale Zone Uranium and Rare Earth Mineral Resource Estimate
| Zone | Tonnes ('000) |
Tons ('000) |
TREE (lbs/ton) |
U3O8
(lbs/ton) |
Average Thickness (m) | Contained TREE ('000 lbs) |
Contained U3O8
('000 lbs) |
||||
| Indicated Resources | |||||||||||
| UR | 6,733 | 7,422 | 4.20 | 0.484 | 4.61 | 31,199 | 3,593 | ||||
| IQ | 3,006 | 3,314 | 1.98 | 0.259 | 2.27 | 6,578 | 0.857 | ||||
| LR | 3,355 | 3,699 | 2.68 | 0.958 | 2.60 | 9,912 | 3,544 | ||||
| Total | 13,095 | 14,435 | 3.30 | 0.554 | 9.48 | 47,689 | 7,995 | ||||
| Inferred Resources | |||||||||||
| UR | 18,326 | 20,201 | 3.87 | 0.421 | 4.33 | 78,080 | 8,498 | ||||
| IQ | 10,209 | 11,254 | 1.64 | 0.184 | 2.78 | 18,464 | 2,070 | ||||
| LR | 9,972 | 10,992 | 3.33 | 0.869 | 2.71 | 36,631 | 9,564 | ||||
| Total | 38,507 | 42,447 | 3.14 | 0.474 | 9.82 | 133,175 | 20,115 | ||||
| Notes: | 1. | Mineral Resources effective 30 July, 2013 |
|
| 2. | Mineral Resources are estimated at a cut-off value of $100 per tonne, using a uranium price of US$70/lb U3O8, a TREE price of $78/kg, and a C$:US$ exchange rate of 1:0.9. TREE includes all the REE elements from lanthanum to lutetium plus yttrium. |
||
| 3. | Mineral Resources which are not Mineral Reserves do not have demonstrated economic viability. The estimate of Mineral Resources may be materially affected by environmental, permitting, legal, title, taxation, socio-political, marketing, or other relevant issues. There are no known specific problems at this date. |
||
| 4. | The quantity and grade of reported Inferred Resources in this estimation are uncertain in nature and there has been insufficient exploration to define these Inferred Resources as an Indicated or Measured Mineral Resource and it is uncertain if further exploration will result in upgrading them to an Indicated or Measured Mineral Resource category. |
||
| 5. | The Mineral Resources were estimated using the Canadian Institute of Mining, Metallurgy and Petroleum standards on Mineral Resources and Reserves, Definitions and Guidelines prepared by the CIM Standing Committee on Reserve Definitions and adopted by CIM Council December 11, 2005. |
||
| 6. | Specific Gravity of 2.85 tonnes/m3 (or 3.14 tons/m3) was used. |
||
| 7. | Indicated amounts may not precisely sum due to rounding. |
Table 2
Individual REE Resource Grade Composition Summary
| Zone | Light REE (grams/tonne) | Heavy REE (grams/tonne) | |||||||||||||||||||||||||||||
| La | Ce | Pr | Nd | Sm | Eu | Gd | Tb | Dy | Ho | Er | Tm | Yb | Lu | Hf | Y | ||||||||||||||||
| Indicated Resources | |||||||||||||||||||||||||||||||
| UR | 540 | 951 | 93.9 | 313 | 51.7 | 1.9 | 32.8 | 3.9 | 17.2 | 2.7 | 7.0 | 0.9 | 5.5 | 0.8 | 6.8 | 72.9 | |||||||||||||||
| IQ | 256 | 452 | 44.9 | 148 | 24.4 | 1.0 | 14.7 | 1.8 | 7.7 | 1.2 | 3.1 | 0.4 | 2.5 | 0.4 | 3.6 | 30.6 | |||||||||||||||
| LR | 332 | 596 | 59.4 | 201 | 35.1 | 1.7 | 23.2 | 3.0 | 14.2 | 2.3 | 5.9 | 0.8 | 4.5 | 0.6 | 3.3 | 58.1 | |||||||||||||||
| Total | 422 | 745 | 73.8 | 247 | 41.1 | 1.7 | 26.2 | 3.2 | 14.3 | 2.3 | 5.8 | 0.8 | 4.6 | 0.7 | 5.2 | 59.4 | |||||||||||||||
| Inferred Resources | |||||||||||||||||||||||||||||||
| UR | 498 | 876 | 85.9 | 285 | 47.2 | 1.8 | 29.3 | 3.5 | 15.9 | 2.5 | 6.5 | 0.9 | 5.3 | 0.8 | 6.8 | 67.9 | |||||||||||||||
| IQ | 213 | 374 | 37.0 | 122 | 20.0 | 0.8 | 12.3 | 1.4 | 6.4 | 1.0 | 2.6 | 0.4 | 2.2 | 0.3 | 3.3 | 26.5 | |||||||||||||||
| LR | 417 | 747 | 73.9 | 249 | 43.4 | 1.9 | 28.5 | 3.6 | 16.4 | 2.6 | 6.6 | 0.9 | 5.2 | 0.7 | 4.5 | 66.4 | |||||||||||||||
| Total | 401 | 709 | 69.9 | 232 | 39.0 | 1.6 | 24.6 | 3.0 | 13.5 | 2.1 | 5.5 | 0.7 | 4.4 | 0.6 | 5.3 | 56.5 | |||||||||||||||
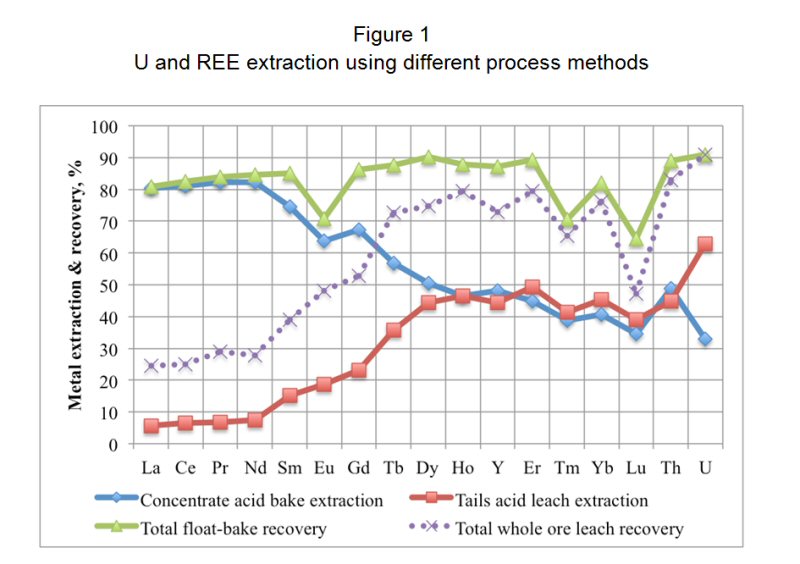
Based on preliminary metallurgical testing, the favoured flowsheet option includes a simple grind, a flotation process to recover a high grade concentrate, pre-leach and acid baking of the flotation concentrate and acid leaching of the flotation tailings. With the REE total content being six times the uranium content of the Indicated Resources, the recovery of the REEs is a very significant factor in determining the economic value of the resources. Testwork carried out at SGS Canada facilities indicated a recovery rate of approximately 90% for uranium and most REEs in the 80% to 90% range. It is believed that planned additional testwork and data analysis will substantiate these data and probably lead to improved recovery.
To see Figure 1, please select the following link:
http://media3.marketwire.com/docs/appia1_800.jpg
Note: The uppermost line with triangle markers illustrates recoveries from the favoured float-bake process option compared to other leaching options.
The 2012 drill program of in-fill and step-out drilling met with a high degree of success in confirming the resources where they were predicted by the geological model. A significant portion of the Inferred Resource was upgraded to Indicated Resources, and additional resources were defined. WGM has recommended a continuation of the exploration drilling and proposed a 14 diamond drill-hole program to increase the size of the area tested. Based on the geological model, WGM believes that a large percentage of the holes will intersect economically interesting mineralization. In light of the encouraging results of the metallurgical testing program carried out by SGS Lakefield, additional testing is recommended to focus on the beneficiation, pre-leach and acid bake and tailings leach route.
The Company is reviewing the Technical Report and is considering the next stage of the Teasdale Zone exploration and evaluation. The outlook for uranium prices is positive and the successful recovery of the REEs, particularly the heavy elements of the total rare earths encountered is very encouraging. Factors favourable for the project include the following:
- new mine infrastructure development would be in brownfields areas already disturbed by industrial and mining activity;
- water, electrical, transportation and communications infrastructure is in place or close at hand;
- the processing of Elliot Lake ore for uranium recovery is well known. Based on test results, the recovery of TREE appears to face no significant technical uncertainties;
- no First Nations land claims are in the immediate area of the project;
- Appia bears no responsibility (liability) in any manner for potential future impacts arising out of historical mining operations and waste disposal; and,
- the Cameco uranium refinery is located approximately 50 km away, near Blind River.
Historical Estimates
Historical estimates thought to be authored by Doug Sprague, P.Eng., Chief Geologist for Rio Algom Ltd. ("RIO") and shown on a RIO map (Rio Algom, 1979), were based on mine data as well as a series of deep drill holes completed by Kerr McGee and other exploration companies in widely separated areas of the Property. RIO's estimates increased the total remaining uranium resource to approximately 200 million pounds of U3O8. These historical resources, located in five separate zones down-dip from past-producing mines, are summarized as:
Table 3
1979 historical U3O8 estimates on Appia's Elliot Lake Properties
| Zone | Quantity (tons) |
Grade (lbs U3O8/ton) |
Contained U3O8
(lbs) |
| Teasdale Lake | 17,458,200 | 1.206 | 20,787,200 |
| Gemico Block #3 | 42,800,000 | 0.38 | 16,264,000 |
| Gemico Block #10 | 20,700,000 | 0.75 | 15,525,000 |
| Banana Lake Zone | 175,800,000 | 0.76 | 133,608,000 |
| Canuc Zone | 7,000,000 | 1.86 | 13,020,000 |
| Total | 263,758,200 | 0.76 | 199,204,200 |
The foregoing historical resources were not estimated in accordance with definitions and practices established for the estimation of Mineral Resources and Mineral Reserves by the Canadian Institute of Mining and Metallurgy ("CIM"). As such, the historical resources are not compliant with Canada's security rule, NI 43-101, and are unreliable for investment decisions. Neither Appia nor its Qualified Persons have done sufficient work to classify the historical resources as mineral resources under current mineral resource terminology and are not treating the historical resources as current mineral resources. Nevertheless, most of the historical resources were estimated by mining companies active in the Elliot Lake camp using assumptions, methods and practices that were accepted at the time, and based on corroborative mining experience.
Based on more recent drilling by Appia during 2007, a subsequent Mineral Resource estimate for the Banana Lake Zone was prepared in 2011 by WGM in accordance with the provisions of NI 43-101. Some of Appia's drilling included holes that were wedged from historical drill holes that Appia re-entered. This resource, first reported in Workman and Breede (2011), is summarized in Table 4.
Table 4
Summary of Banana Lake Zone Mineral Resource Estimate
| Category | Tons ('000) |
Specific Gravity. (tons/m3) |
lbs U3O8/ton | Total lbs U3O8
('000) |
||
| Inferred Resources | 30,315 | 3.14 | 0.912 | 27,638 | ||
| Notes: | 1. | Effective, 1 April, 2011 |
| 2. | Mineral Resources which are not Mineral Reserves do not have demonstrated economic viability. The estimate of Mineral Resources may be materially affected by environmental, permitting, legal, title, taxation, socio-political, marketing, or other relevant issues. | |
| 3. | The quantity and grade of reported Inferred Resources in this estimation are uncertain in nature and there has been insufficient exploration to define these Inferred Resources as an Indicated or Measured Mineral Resource and it is uncertain if further exploration will result in upgrading them to an Indicated or Measured Mineral Resource category. | |
| 4. | The Mineral Resources were estimated using the Canadian Institute of Mining, Metallurgy and Petroleum standards on Mineral Resources and Reserves, Definitions and Guidelines prepared by the CIM Standing Committee on Reserve Definitions and adopted by CIM Council December 11, 2005. | |
| 5. | A cut-off grade of 0.6 lb U3O8 was used | |
| 6. | Specific Gravity of 2.85 tonnes/m3 (or 3.14 tons/m3) was used. | |
| 7. | Indicated amounts may not precisely sum due to rounding. |
Mr. Al Workman, P.Geo., Vice-President of WGM, a Qualified Person as defined in NI 43-101, has reviewed and approved the technical information in this news release.
Appia is a public issuer in Canada, but is currently not listed on a stock exchange. The Company filed a Long Form Non-Offering Prospectus on December 12, 2012. The prospectus and the Technical Report which is the subject of this news release can be found at www.sedar.com. Appia currently has 41.6 million common shares outstanding. Private placements to date have been in a range of $1.00 to $1.50 per share.
Cautionary Note Regarding Forward-Looking Information: This news release contains forward-looking statements that involve risks and uncertainties, which may cause actual results to differ materially from the statements made. When used in this document, the words "may", "would", "could", "will", "intend", "plan", "anticipate", "believe", "estimate", "expect" and similar expressions are intended to identify forward-looking statements. Such statements reflect our current views with respect to future events and are subject to risks and uncertainties. Many factors could cause actual results to differ materially from the statements made, including those factors discussed in filings made by us with the Canadian securities regulatory authorities. Should one or more of these risks and uncertainties, such as actual results of current exploration programs, the general risks associated with the mining industry, the price of uranium and rare earth elements, currency and interest rate fluctuations, increased competition and general economic and market factors, occur or should assumptions underlying the forward looking statements prove incorrect, actual results may vary materially from those described herein as intended, planned, anticipated, or expected. We do not intend and do not assume any obligation to update these forward-looking statements, except as required by law. Shareholders are cautioned not to put undue reliance on such forward-looking statements.
Contact Information:
Tom Drivas
President, CEO and Director
416-876-3957
416-218-9772 (FAX)
appia@appiaenergy.ca
Appia Energy Corp.
Frank van de Water
Chief Operating Officer
416-546-2707
fvandewater@on.aibn.com