TRUCKEE, CA--(Marketwire - Aug 7, 2012) - Clear Capital (www.clearcapital.com), a premium provider of real estate analytics and asset valuation, today released its Home Data Index™ (HDI) Market Report with data through July 2012. The HDI Market Report takes a broad array of public and proprietary data sources to provide the most timely and relevant analysis available. Report highlights include:
- National home prices in July picked up the pace of growth over both the rolling quarter and year.
- The West extended run of leading gains, shifting growth to higher priced market segments.
- MSAs continued to make progress overall, while potentially volatile trends emerged in some lower priced, hard hit markets.
- One third of top metros posted double digit yearly gains, while bottom 15 metros generally saw prices stabilize.
"July home price trends continued to show promise at a time when the strength of the broader economy is in question on many fronts," said Dr. Alex Villacorta, Director of Research and Analytics at Clear Capital. "The national housing market defied the drag of a softening economy with increasing gains of 2.0% over the last rolling quarter. Housing gains in the West continued to lead the nation, and more importantly, for the second month in a row, the price rebound has broken out of the low price tier segments into higher priced homes. As the pool of buyers expands, the West continues to position for the next phase of recovery.
"While significant risks remain at large, housing now has the potential to enter a positive feedback loop. Price increases could lead to increased confidence. This could motivate buyers, propelling the recovery in spite of the potential economic slowdown outside the housing market. Of course it's still possible that housing could experience a pull back if contagion from other economic sectors bleeds through, but right now there appears to be a healthy level of resilience."
Rolling Quarter Results: Short Term Gains Fuel Recovery
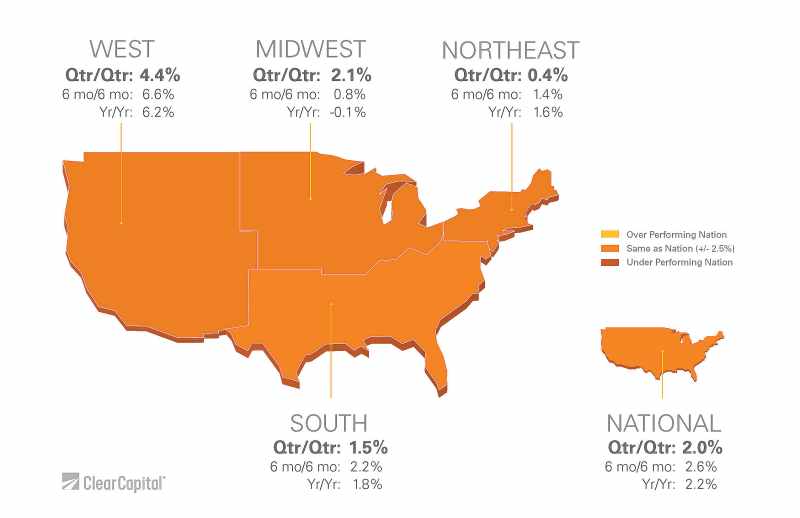
National home prices advanced by 2.0% over the quarter, picking up momentum over last month's quarterly gains of 1.7%. Strengthening short term trends were echoed in the West and Midwest, with 4.4% and 2.1% quarterly growth, respectively. Meanwhile, the South held its ground with quarterly gains of 1.5%, and the Northeast saw price growth of 0.4%, a slight step back from last month's 0.8% quarterly gains.
A drop in REO saturation in the Northeast over the last quarter of nearly three percentage points to a low rate of 7.7%, contributed to the softening quarterly gains. Typically a reduction in the percentage of distressed sales would have a positive impact on prices, but in the case of the Northeast, lower rates of REO sales in part reduced momentum in low tier gains (those homes selling for $169,000 and less). Low tier quarterly growth fell to 0.7% from last month's quarterly gains of 1.8%, taking some wind out of the sails of the region's progress overall. Given the low distressed sale environment, continued progress in the Northeast will be more dependent on mid and higher priced homes picking up over the next several months.
Nonetheless, quarterly growth across regions hasn't been this robust since October 2011 when prices experienced a short burst in gains, lacking endurance to bring positive long term trends. Conversely, two out of four regions have now seen rolling quarterly growth over the last two months, and three out of four regions have experienced quarterly gains over the last 5 months, fueling yearly gains.
Year-over-Year Results: Strongest Gains in Nearly Two Years
Yearly growth for the broader national market expanded to 2.2% in July, 0.5 percentage points higher than June. Boosting growth at the national level, the West saw home prices roll up an impressive 6.2% over the previous year. The South and the Northeast also contributed to national price growth, with 1.8% and 1.6% yearly gains, respectively. While the Midwest has yet to post long term growth, the slight decline of 0.1% improved over last month's yearly losses of 0.6%.
July marked the third consecutive month of national yearly gains, with longer term price trends at the national level last seen this strong in September 2010, when the First-Time Homebuyer Tax Credit temporarily drove prices higher. Without external stimulus driving demand, this latest round of gains is particularly encouraging. Strengthening fundamentals have finally allowed prices to move beyond stability and into a seemingly sustainable growth mode, providing reason for consumers to feel more confidence in housing overall.
Confidence in housing will be key to future progress, giving buyers a reason to get off the sidelines, resulting in higher demand that could feed additional gains, and creating a positive feedback loop. Certainly the alternative is still possible, where a hiccup in consumers' outlook could stall progress, further diminishing the willingness of a homebuyer to make a purchase.
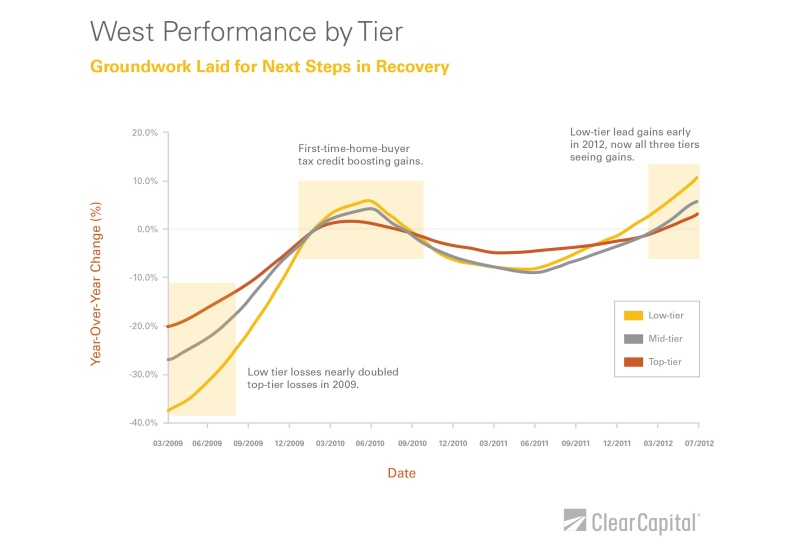
The West Sets Up for Next Phase of Recovery
Buyers appear to be feeling more positive in the West, as price gains broke out of the lower priced segment ($140,000 and less) and into higher priced homes (sales greater than $347,000). The migration of price gains indicates the emergence of a more broad-based demand, which will ultimately be necessary for a more mature recovery.
Gains in the West appear to have moved beyond the first phase of the recovery, a first in, first out path as seen in Graph 2. Initially, low price tier homes led the downturn, accumulating yearly losses of 36.5% by March 2009. Subsequently the low tier segment was the first to shake off losses in March 2012, as investors started capitalizing on discounted deals with attractive cash flow potential. Over the last six months, low tier momentum strengthened, and as of July, prices had been bolstered by 10.0% growth year-over-year.
Now at the start of a more advanced recovery, mid and top tier price segments in the West reported yearly gains in July of 5.0% and 2.7%, respectively. These gains indicate the buyer pool in the West has expanded beyond the segment focused on investment opportunities in low tier homes, to the owner occupied segment purchasing higher priced residences.
Ultimately, the investment sector has limited bandwidth. While they've helped to jumpstart a recovery in many markets across the country, it isn't realistic to expect sustainable growth from this segment alone. A more robust recovery will require a revival in demand across price tiers and buyer pools, as is starting to happen in the West, and will be tested over the next several months.
The Highest Performing 15 MSAs
Overall, the top 15 metros came in strong for July on both a quarterly and yearly basis, with average returns of 7.8% and 8.3%, respectively. Five of the top 15 metros rolled up double digit growth over the last year, a solid indication of a rebound well under way in many top markets. Phoenix continued its impressive run as the leader in annual gains for four consecutive months, with the highest yearly growth of 23.8%.
While the top two performers on a quarterly basis, Birmingham and Milwaukee, each accumulated more than 15.0% growth, Birmingham's yearly gains of 1.3% were far lower than the top 15 group's average. And Milwaukee actually experienced losses of 3.0% over the previous year.
Taking a closer look at the top two metros reveals elastic trends that could produce volatility moving forward, based on low price points contributing to the seemingly large percentage gains over the quarter. Birmingham and Milwaukee's overall median price-per-square-foot sit at $62 and $81, respectively. While these prices are significantly below the national median price-per-square-foot of $105 and contribute to sensitivity in percentage changes, their even lower distressed sale prices further amplify the effects. Birmingham and Milwaukee's REO-only segments' median price-per-square-foot are each at $26, and considering their 33.5% and 27.8% REO saturation rates respectively, it doesn't take much of a swing in price to significantly alter the percentage change for the markets.
As hard hit markets start to rebound, elasticity and volatility could become more prevalent as minor price changes to low cost markets significantly sway percentages.
| Highest Performing Metro Markets | ||||||||
| Qtr/Qtr Rank |
Metropolitan Statistical Area | Qtr/Qtr % +/- |
Yr/Yr | REO Saturation | ||||
| 1 | Birmingham, AL - Hoover, AL | 16.7% | 1.3% | 33.5% | ||||
| 2 | Milwaukee, WI - Waukesha, WI - West Allis, WI | 15.8% | -3.0% | 27.8% | ||||
| 3 | Seattle, WA - Tacoma, WA - Bellevue, WA | 10.5% | 6.5% | 13.5% | ||||
| 4 | Louisville, KY | 8.9% | 5.9% | 19.0% | ||||
| 5 | Phoenix, AZ - Mesa, AZ - Scottsdale, AZ | 8.1% | 23.8% | 20.6% | ||||
| 6 | San Jose, CA - Sunnyvale, CA - Santa Clara, CA | 7.6% | 8.8% | 15.4% | ||||
| 7 | Columbus, OH | 7.3% | 18.7% | 23.4% | ||||
| 8 | Washington, DC - Arlington, VA - Alexandria, VA | 7.3% | 12.8% | 9.2% | ||||
| 9 | Jacksonville, FL | 5.7% | 8.0% | 27.8% | ||||
| 10 | San Francisco, CA - Oakland, CA - Fremont, CA | 5.6% | 7.3% | 22.3% | ||||
| 11 | Baltimore, MD - Towson, MD | 5.0% | 4.6% | 9.2% | ||||
| 12 | Minneapolis, MN - St. Paul, MN - Bloomington, WI | 4.9% | 13.3% | 27.1% | ||||
| 13 | Miami, FL - Ft. Lauderdale, FL - Miami Beach, FL | 4.7% | 11.9% | 27.1% | ||||
| 14 | Detroit, MI - Warren, MI - Livonia, MI | 4.6% | 0.1% | 49.8% | ||||
| 15 | Las Vegas, NV - Paradise, NV | 4.4% | 3.8% | 38.9% | ||||
The Lowest Performing 15 MSAs
On average, the lowest performing MSAs were nearly unchanged over both the previous rolling quarter and year, with losses of just 0.9% and 0.1%, respectively. In fact, nine out of the lowest 15 metros saw price changes of less than 1.0% over the last quarter. Stability in the lowest performing metros offers encouragement that even markets lagging in recovery are starting to find a bottom, creating a stronger foundation for the progression of the recovery at the national level.
| Lowest Performing Major Markets | ||||||||
| Qtr/Qtr Rank |
Metropolitan Statistical Area | Qtr/Qtr % +/- |
Yr/Yr | REO Saturation | ||||
| 1 | Memphis, TN | -5.5% | -10.3% | 44.0% | ||||
| 2 | Honolulu, HI | -3.1% | -0.1% | 7.9% | ||||
| 3 | Dayton, OH | -2.7% | 5.6% | 30.5% | ||||
| 4 | Providence, RI - New Bedford, MA - Fall River, MA | -2.0% | -10.6% | 12.2% | ||||
| 5 | Raleigh, NC - Cary, NC | -1.6% | -5.9% | 16.3% | ||||
| 6 | Charlotte, NC - Gastonia, NC - Concord, NC | -1.1% | -4.2% | 14.2% | ||||
| 7 | New Orleans, LA - Metairie, LA - Kenner, LA | -0.9% | -3.3% | 17.8% | ||||
| 8 | Hartford, CT - West Hartford, CT - East Hartford, CT | -0.4% | 7.2% | 5.8% | ||||
| 9 | Tampa, FL - St. Petersburg, FL - Clearwater, FL | 0.1% | 7.3% | 24.1% | ||||
| 10 | Fresno, CA | 0.2% | 3.0% | 36.0% | ||||
| 11 | Nashville, TN - Davidson, TN - Murfreesboro, TN | 0.3% | 1.4% | 18.3% | ||||
| 12 | Rochester, NY | 0.3% | 1.3% | 2.6% | ||||
| 13 | Dallas, TX - Fort Worth, TX - Arlington, TX | 0.6% | 2.6% | 22.0% | ||||
| 14 | St. Louis, MO | 0.8% | 2.1% | 26.4% | ||||
| 15 | Boston, MA - Cambridge, MA - Quincy, MA | 0.8% | 1.8% | 7.0% | ||||
While the recovery will continue to take place market-by-market, July home price trends were largely positive. A solid foundation for future progress has been established in the lowest performing markets, while many markets are already in the early stages of recovery, and some, like the West are seeing a more advanced recovery unfolding.
About the Clear Capital Home Data Index (HDI) Market Report
The Clear Capital HDI Market Report provides insights into market trends and other leading indices for the real estate market at the national and local levels. A critical difference in the value of the HDI Market Report is the capability of Clear Capital to provide more timely and granular reporting than other home price index providers.
The Clear Capital HDI Market Report:
- Offers the real estate industry (investors, lenders, and servicers), government agencies, and the public insight into the most recent pricing conditions, not only at the national and metropolitan level, but within local markets as well.
- Is built on the most recent information available from recorder/assessor offices, and then further enhanced by adding the company's proprietary streaming market data for the most comprehensive geographic coverage and local insights available.
- Reflects nationwide coverage of sales transactions and aggregates this comprehensive dataset at ten different geographic levels, including hundreds of metropolitan statistical areas (MSAs) and sub-ZIP code boundaries.
- Includes equally-weighted distressed bank owned sales (REOs) from around the country to give the most real world look of pricing dynamics across all sales types.
- Allows for the most current market data by providing more frequent updates with patent-pending rolling quarter technology. This ensures decisions are based on the most up-to-date information available.
Clear Capital Home Data Index Methodology
- Generates the timeliest indices in patent pending rolling quarter intervals that compare the most recent four months to the previous three months. The rolling quarters have no fixed start date and can be used to generate indices as data flows in, significantly reducing the multi-month lag time experienced with other indices.
- Includes both fair market and institutional (real estate owned) transactions, giving equal weight to all market transactions and identifying price tiers at a market specific level. By giving equal weight to all transactions, the HDI is truly representative of each unique market.
- Results from an address-level cascade create an index with the most granular, statistically significant market area available.
- Provides weighted repeat sales and price-per-square-foot index models that use multiple sale types, including single-family homes, multi-family homes, and condominiums.
About Clear Capital
Clear Capital (www.clearcapital.com) is a premium provider of data and solutions for real estate asset valuation and risk assessment for large financial services companies. Our products include appraisals, broker price opinions, property condition inspections, value reconciliations, quality assurance services, home data indices, and automated valuation models. Clear Capital's combination of progressive technology, high caliber in-house staff, and a well-trained network of more than 40,000 field experts sets a new standard for accurate, up-to-date, and well documented valuation data and assessments. The Company's customers include the largest U.S. banks, investment firms, and other financial organizations.
The information contained in this report is based on sources that are deemed to be reliable; however no representation or warranty is made as to the accuracy, completeness, or fitness for any particular purpose of any information contained herein. This report is not intended as investment advice, and should not be viewed as any guarantee of value, condition, or other attribute.
Contact Information:
Media Contact:
Alanna Harter
Marketing Manager
Clear Capital
530.550.2515
alanna.harter@clearcapital.com