TRUCKEE, CA--(Marketwire - Sep 5, 2012) - Clear Capital (www.clearcapital.com), a premium provider of data and real estate asset valuation, investment, and risk assessment, today released its Home Data Index™ (HDI) Market Report with data through August 2012. The HDI Market Report uses a broad array of public and proprietary data sources providing the most timely and relevant analysis available.
Report highlights include:
- National price gains strengthened, marking the fourth consecutive month of yearly gains.
- Breaking a cycle of growth through 2012, national REO saturation declined over the quarter to levels not seen since April 2008.
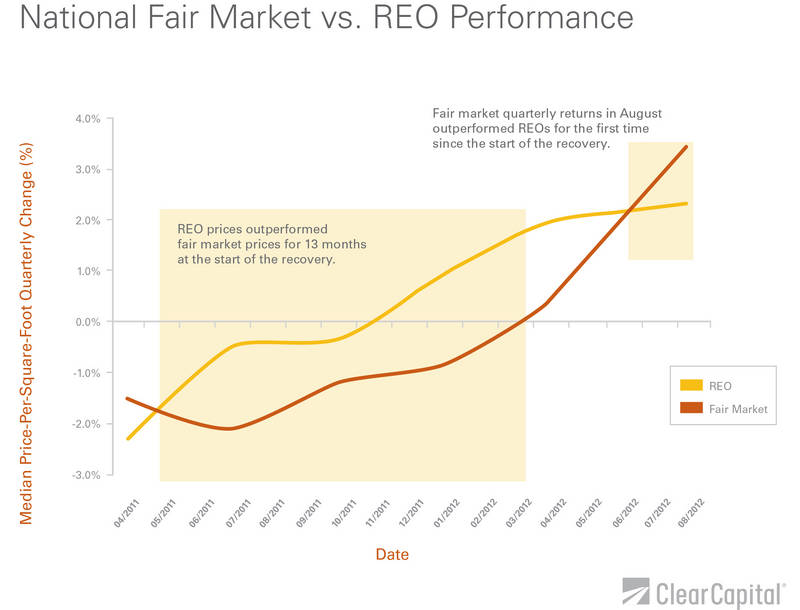
- Fair market prices outpaced REO prices over the last rolling quarter for the first time since April 2011, signaling the start to a more mature recovery.
- Is eminent domain in San Bernardino County, CA necessary? Trends draw parallels to Maricopa County, AZ.
"Home price trends in August remained positive, posting the fourth consecutive yearly gain," said Dr. Alex Villacorta, Director of Research and Analytics at Clear Capital. "This month, three notable trends shifted: Growth in the fair market segment outpaced the REO segment over the last rolling quarter; through the first half of 2012, REO saturation was on the rise while August saw a drop to the lowest levels since 2008; and non-investor home buyers made up a larger chunk of the sales mix. The spark from the investor community has ignited activity in the owner-occupied sector of the market. In other words, historical market forces are at play.
"The shift could certainly have far reaching effects, even on smaller markets like San Bernardino County, where they are considering the use of eminent domain to relieve underwater borrowers. A comparison of price trends in San Bernardino County and Maricopa County, part of the Phoenix MSA, suggests eminent domain may be unnecessary. Phoenix has become the benchmark for recovering markets over the last year, which sheds light on where an organic trajectory of the San Bernardino market could be headed."
Rolling Quarter Results
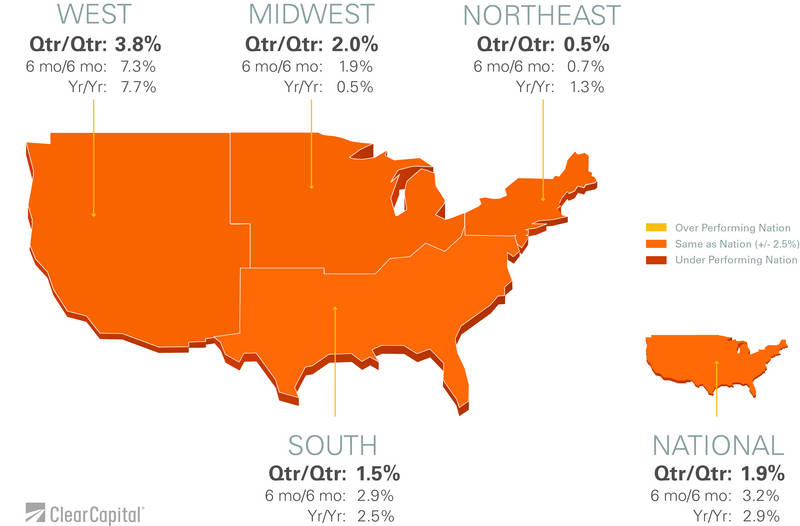
National gains of 1.9% on a rolling quarterly basis left momentum nearly unchanged at the broad market level, when compared to last month's quarterly gains of 2.0%. A more notable shift occurred in the national REO saturation rate, where a decline of 6.4 percentage points over the previous quarter dropped the current rate down to a relatively low 20.5%. This is the first decline in 2012 and the lowest national REO saturation rate since April 2008 (16.3%), reflecting a 49% reduction from the peak REO saturation rate of 40.2% seen in Q1 2009. REO saturation declined as a result of declines in REO sale volumes and increases in fair market sale volumes. While the impetus of Phase One of the recovery was strength in REO-only price trends as REO saturation rose, August gains were driven by the fair market segment as REO saturation declined. Sustained growth in the fair market segment could build a foundation for Phase Two of the recovery.
All four regions posted rolling quarterly gains, as the West continued its strong recovery with 3.8% growth. The Midwest, South and Northeast each trailed with 2.0%, 1.5%, and 0.5% price increases, respectively. Following the trends at the national level, each region recorded reduced REO saturation rates over the quarter.
Year-over-Year Results
National home prices edged up 2.9% over the last year, marking the fourth consecutive month of yearly gains. The overall market continued to strengthen its position in August, with rates of growth outpacing those in July by 0.7 percentage points. Continued growth on this non-seasonally influenced metric shows fundamental strength fueling gains, rather than a boost from the summer buying season.
Each of the four regions tacked on annual gains in August, as well. The West took the biggest step forward in expanding prices over the year by 7.7%, and had the most notable regional momentum of 1.5 percentage points over July. The South and Northeast trailed the West with yearly gains of 2.5% and 1.3%, respectively. The Midwest made some progress over the last year, with prices up 0.5%, the first gain on a yearly basis for the region since April 2010.
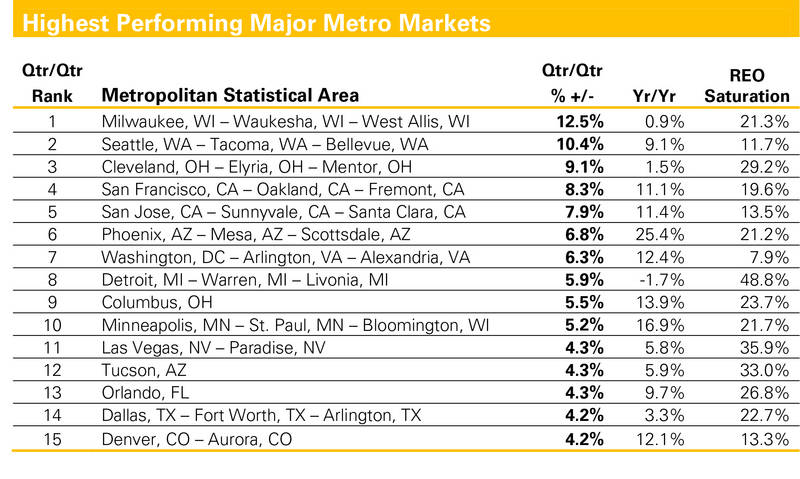
Highest Performing 15 MSAs
Top metro markets continued to advance over both the rolling quarter and year. While each of the highest performing 15 metros saw quarterly gains over 4%, seven markets posted double digit yearly gains. On average 9.2% in yearly gains were supported by short term average quarterly gains of 6.6%. On both counts, progress continues to be made by the strongest metros.
| Highest Performing Major Metro Markets | ||||||||
| Qtr/Qtr Rank |
Metropolitan Statistical Area |
Qtr/Qtr % +/- |
Yr/Yr |
REO Saturation |
||||
| 1 | Milwaukee, WI - Waukesha, WI - West Allis, WI | 12.5% | 0.9% | 21.3% | ||||
| 2 | Seattle, WA - Tacoma, WA - Bellevue, WA | 10.4% | 9.1% | 11.7% | ||||
| 3 | Cleveland, OH - Elyria, OH - Mentor, OH | 9.1% | 1.5% | 29.2% | ||||
| 4 | San Francisco, CA - Oakland, CA - Fremont, CA | 8.3% | 11.1% | 19.6% | ||||
| 5 | San Jose, CA - Sunnyvale, CA - Santa Clara, CA | 7.9% | 11.4% | 13.5% | ||||
| 6 | Phoenix, AZ - Mesa, AZ - Scottsdale, AZ | 6.8% | 25.4% | 21.2% | ||||
| 7 | Washington, DC - Arlington, VA - Alexandria, VA | 6.3% | 12.4% | 7.9% | ||||
| 8 | Detroit, MI - Warren, MI - Livonia, MI | 5.9% | -1.7% | 48.8% | ||||
| 9 | Columbus, OH | 5.5% | 13.9% | 23.7% | ||||
| 10 | Minneapolis, MN - St. Paul, MN - Bloomington, WI | 5.2% | 16.9% | 21.7% | ||||
| 11 | Las Vegas, NV - Paradise, NV | 4.3% | 5.8% | 35.9% | ||||
| 12 | Tucson, AZ | 4.3% | 5.9% | 33.0% | ||||
| 13 | Orlando, FL | 4.3% | 9.7% | 26.8% | ||||
| 14 | Dallas, TX - Fort Worth, TX - Arlington, TX | 4.2% | 3.3% | 22.7% | ||||
| 15 | Denver, CO - Aurora, CO | 4.2% | 12.1% | 13.3% | ||||
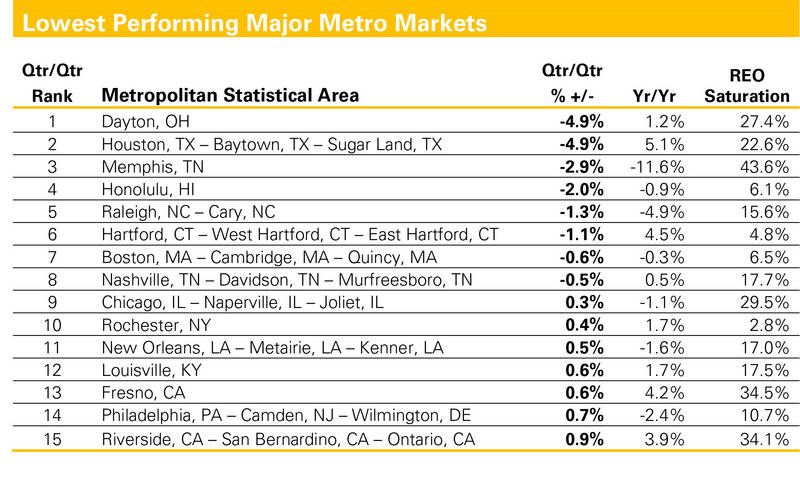
Lowest Performing 15 MSAs
Prices in the lowest performing metros remained mostly level in August with minor losses of 0.9% on average over the last rolling quarter. Nine metros posted less than 1.0% change overall. On a yearly basis, average home values for the lowest ranked group didn't move the needle, with 0.0% change. As the lowest performing metros experience stabilization, the foundation to the recovery strengthens. This group offers further evidence that the market has bottomed not for just a few major markets, but the majority of major markets.
Individually, a few markets revealed diverging yearly trends. The Riverside/San Bernardino area showed signs of improvement overall, with prices increasing over the quarter and year as REO saturation fell. Memphis, on the other hand, sustained the steepest price declines over the year, in part as a result of increasing levels of REO saturation of more than 4.0 percentage points over the quarter. While early in the recovery, some markets experienced rising prices alongside REO saturation, struggling markets like Memphis have yet to acclimate to a highly distressed sale environment.
| Lowest Performing Major Metro Markets | ||||||||
| Qtr/Qtr Rank |
Metropolitan Statistical Area |
Qtr/Qtr % +/- |
Yr/Yr |
REO Saturation |
||||
| 1 | Dayton, OH | -4.9% | 1.2% | 27.4% | ||||
| 2 | Houston, TX - Baytown, TX - Sugar Land, TX | -4.9% | 5.1% | 22.6% | ||||
| 3 | Memphis, TN | -2.9% | -11.6% | 43.6% | ||||
| 4 | Honolulu, HI | -2.0% | -0.9% | 6.1% | ||||
| 5 | Raleigh, NC - Cary, NC | -1.3% | -4.9% | 15.6% | ||||
| 6 | Hartford, CT - West Hartford, CT - East Hartford, CT | -1.1% | 4.5% | 4.8% | ||||
| 7 | Boston, MA - Cambridge, MA - Quincy, MA | -0.6% | -0.3% | 6.5% | ||||
| 8 | Nashville, TN - Davidson, TN - Murfreesboro, TN | -0.5% | 0.5% | 17.7% | ||||
| 9 | Chicago, IL - Naperville, IL - Joliet, IL | 0.3% | -1.1% | 29.5% | ||||
| 10 | Rochester, NY | 0.4% | 1.7% | 2.8% | ||||
| 11 | New Orleans, LA - Metairie, LA - Kenner, LA | 0.5% | -1.6% | 17.0% | ||||
| 12 | Louisville, KY | 0.6% | 1.7% | 17.5% | ||||
| 13 | Fresno, CA | 0.6% | 4.2% | 34.5% | ||||
| 14 | Philadelphia, PA - Camden, NJ - Wilmington, DE | 0.7% | -2.4% | 10.7% | ||||
| 15 | Riverside, CA - San Bernardino, CA - Ontario, CA | 0.9% | 3.9% | 34.1% | ||||
Rivalry underway? Homeowners challenge investor enthusiasm.
Dwindling REO saturation at the national and regional levels was echoed in performance of REO and fair market segments on a median price-per-square-foot basis. Fair market prices experienced quarterly growth that outpaced REO prices across the board. This is the first time non-distressed prices have led quarterly gains at the national level since April 2011. While seasonal uptick in summer time purchasing is expected, up until August, the recovery had been largely driven by investor activity in the distressed side of the market. It is encouraging to see owner-occupied home buyers gaining confidence in the market.
Increasing prices for non-distressed homes offer evidence that the market may be entering Phase Two of the housing recovery. Investment business models over the last year have mostly focused on discounted properties, concentrated in the REO segment. While investment activity had been increasing as a percentage of all purchases over the last five years, 2012 is setting up for a reversal. Investment purchases as a percentage of total sales in 2012 year-to-date are down about 30% from 2011 levels.
Gains in the fair market segment signal owner-occupied home buyers are rivaling the investment segment of the market. Given the REO segment alone is unlikely to sustain long term growth, gains in the fair market segment signal a start to a mature recovery.
Should this short term trend sustain over the next several months, improved consumer confidence in the housing market could begin to create a positive feedback loop. Higher confidence could bring those on the sidelines back into the game, boosting prices further. In this scenario, the recovery stands a chance of avoiding a major interruption through the typically slow winter months.
Eminent Domain: Is it necessary?
Micro markets like San Bernardino are also experiencing the positive shift in the fair market segment price performance. The County's fair market price trends outperformed REO prices by 4.2 percentage points on a rolling quarterly, median price-per-square-foot basis. Nonetheless, even as the market begins to recover, many homeowners remain underwater.
The market's struggles have prompted local policy makers to formally consider an unprecedented housing relief proposal involving the use of eminent domain. Under the proposed plan, underwater mortgages held in private securities would be seized, and loan balances reduced to levels more aligned with current prices, with the goal of relieving underwater homeowners. The proposal has sparked considerable debate on the effects, benefits, and beneficiaries of such a program. Here we ask: Is it necessary?
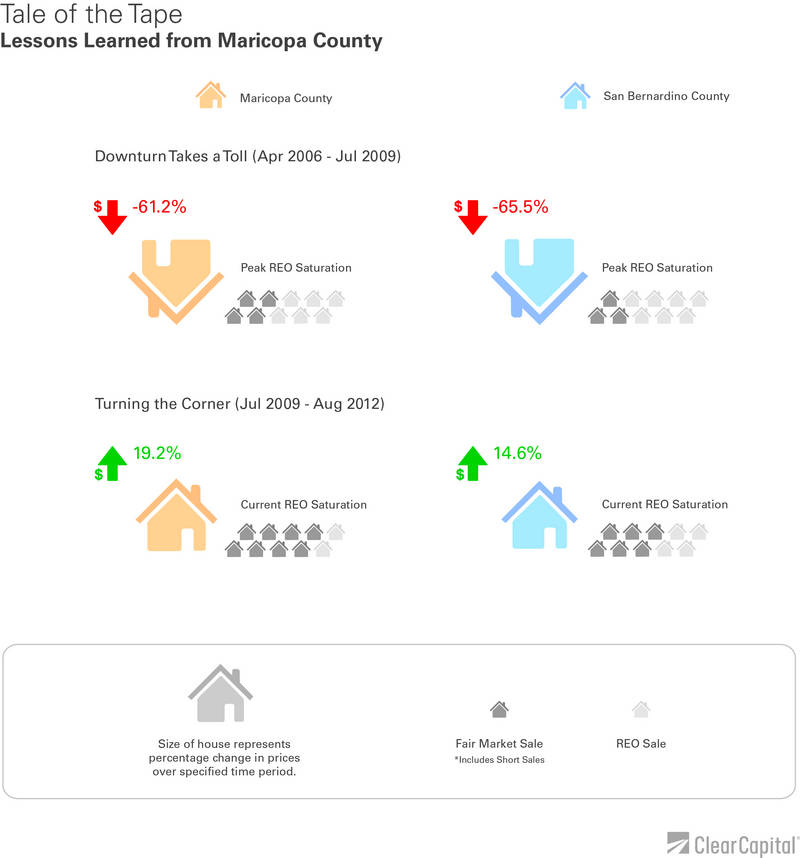
Like Maricopa County, AZ, San Bernardino's recent signs of improvement appear to support a recovery well underway. A subset of the Phoenix MSA, Maricopa County offers a strong comparison, given it was one of the hardest hit markets in the country and has now become one of the strongest in terms of recovery.
San Bernardino and Maricopa counties have similar stories. Each market became heavily distressed as the foreclosure crisis unraveled, and prices fell dramatically from the peak, with declines reaching over 60% for each market.
The counties continue to show parallels. Over the last 3 years, each has seen prices rebound off their lows, with San Bernardino gaining 14.6% and Maricopa up 19.2%. Over the last year, both markets saw prices expand, though Maricopa's 25.0% growth outpaced San Bernardino's 4.7%.
Quarterly trends are also positive for both counties, with Maricopa up 6.8% and San Bernardino up 1.2%. Each market has seen prices respond favorably to a shifting composition in sale types. San Bernardino's REO sales as a percentage of all sales have been nearly cut in half, while Maricopa has seen a 66.6% reduction.
Although the Counties' housing markets are not identical, they appear to be on similar trajectories. Severe price declines and high REO saturation rates have subsided, gains are now taking place, and the sale mix continues to tilt away from REOs toward fair market transactions. Maricopa County has proven that a hard hit market can indeed begin to heal organically.
While the effects of an eminent domain strategy on the broader market are yet to be seen, data through August suggests the budding recovery in San Bernardino has potential to continue to elevate prices, thus alleviating some of the negative equity for homeowners without intervention.
About the Clear Capital Home Data Index (HDI) Market Report
The Clear Capital HDI Market Report provides insights into market trends and other leading indices for the real estate market at the national and local levels. A critical difference in the value of the HDI Market Report is the capability of Clear Capital to provide more timely and granular reporting than other home price index providers.
The Clear Capital HDI Market Report:
- Offers the real estate industry (investors, lenders, and servicers), government agencies, and the public insight into the most recent pricing conditions, not only at the national and metropolitan level, but within local markets as well.
- Is built on the most recent information available from recorder/assessor offices, and then further enhanced by adding the company's proprietary streaming market data for the most comprehensive geographic coverage and local insights available.
- Reflects nationwide coverage of sales transactions and aggregates this comprehensive dataset at ten different geographic levels, including hundreds of metropolitan statistical areas (MSAs) and sub-ZIP code boundaries.
- Includes equally-weighted distressed bank owned sales (REOs) from around the country to give the most real world look of pricing dynamics across all sales types.
- Allows for the most current market data by providing more frequent updates with patent pending rolling quarter technology. This ensures decisions are based on the most up-to-date information available.
Clear Capital Home Data Index Methodology
- Generates the timeliest indices in patent pending rolling quarter intervals that compare the most recent four months to the previous three months. The rolling quarters have no fixed start date and can be used to generate indices as data flows in, significantly reducing the multi-month lag time experienced with other indices.
- Includes both fair market and institutional (real estate owned) transactions, giving equal weight to all market transactions and identifying price tiers at a market specific level. By giving equal weight to all transactions, the HDI is truly representative of each unique market.
- Results from an address-level cascade create an index with the most granular, statistically significant market area available.
- Provides weighted repeat sales and price-per-square-foot index models that use multiple sale types, including single-family homes, multi-family homes, and condominiums.
About Clear Capital
Clear Capital (www.clearcapital.com) is a premium provider of data and solutions for real estate asset valuation and risk assessment for large financial services companies. Our products include appraisals, broker price opinions, property condition inspections, value reconciliations, automated valuation models, quality assurance services, and home data indices. Clear Capital's combination of progressive technology, high caliber in-house staff, and a well-trained network of more than 40,000 field experts sets a new standard for accurate, up-to-date, and well documented valuation data and assessments. The Company's customers include the largest U.S. banks, investment firms and other financial organizations.
The information contained in this report is based on sources that are deemed to be reliable; however no representation or warranty is made as to the accuracy, completeness, or fitness for any particular purpose of any information contained herein. This report is not intended as investment advice, and should not be viewed as any guarantee of value, condition, or other attribute.
Contact Information:
Media Contact:
Alanna Harter
Marketing Manager
Clear Capital
530.550.2515
alanna.harter@clearcapital.com