TRUCKEE, CA--(Marketwire - Jul 10, 2012) - Clear Capital® (www.clearcapital.com), a premium provider of data and real estate asset valuation, investment and risk assessment, today released its Home Data Index™ (HDI) Market Report with data through June 2012. The HDI Market Report uses a broad array of public and proprietary data sources providing the most timely and relevant analysis available. Methodology details included below.
Report highlights include:
- June saw further support for a housing price recovery in sustained momentum with broad-based advances.
- The nation's home prices rebounded with quarterly and yearly gains of 1.7%.
- Regional performance improved across the board.
- The West led the regions in price recovery and forecasted growth, offering insight to the next chapter of recovery.
- The Midwest gained ground over the rolling quarter, recovering from the persistent price declines over the last year.
- Home price forecast through 2012 shows continued growth for the nation, regions, and a majority of the top MSAs.
"June home price trends provided further evidence that housing has turned the corner, with the momentum of the recovery picking up speed," said Dr. Alex Villacorta, Director of Research and Analytics at Clear Capital. "Prices continue to climb at the national level, with each of the four regions showing improvements over last month. The West continued as the front runner in terms of overall market correction, with growth branching out from the low tier to mid and higher priced homes. Seeing price growth expand to other sub-markets is a key step in the evolution of this recovery. Even the Midwest started to catch up to the other regions, shedding the drag of recent declines."
"Looking forward over the rest of 2012, we expect to see national, regional, and most metro markets improve by varying degrees. And while it's encouraging to see broad-based advancements coupled with positive forecasts, we remain cautiously optimistic. The current strength in housing fundamentals remains vulnerable to domestic and global economic challenges," Villacorta added. "But right now the market is the strongest it's been since the start of the downturn, and barring a major economic meltdown, we expect to see this organic growth sustain and strengthen through the end of the year."
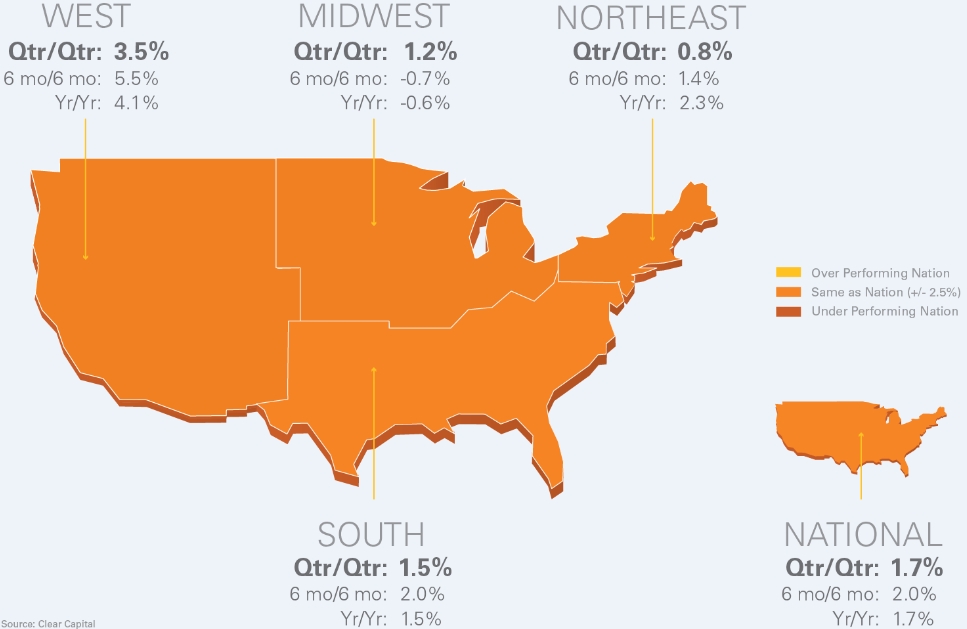
Chart 1: Observed Results
| Qtr/Qtr % +/- | 6 mo/6 mo | Yr/Yr | ||||
| West | 3.5% | 5.5% | 4.1% | |||
| Midwest | 1.2% | -0.7% | -0.6% | |||
| Northeast | 0.8% | 1.4% | 2.3% | |||
| South | 1.5% | 2.0% | 1.5% | |||
| National | 1.7% | 2.0% | 1.7% | |||
Rolling Quarter Results: Broad-Based Strength Unfolding
Quarterly home values in June made all-around improvements, a continuation of the positive momentum seen in May. National quarterly gains of 1.7% came in 1.3 percentage points stronger than the May HDI Market Report, and the nation's performance was echoed at the regional levels.
The West made the largest contribution to national trends, with quarter-over-quarter growth of 3.5%, an increase of 0.8 percentage points over last month's report. With four consecutive months of quarterly gains, the West has held the lead in short term growth since May. Giving the West an additional boost, growth spread across all price tiers, an important next step in the progression of this recovery.
The recovery has generally started in lower priced segments for most markets seeing gains, however demand in the West is now outpacing supply and driving prices up in the low, mid, and even high priced homes. Over the last quarter, low tier gains came in at 3.6% (sales less than $140,000), mid tier gains were 3.1% (homes selling between $140,000 and $347,000), and top tier gains registered at 3.2% (sales higher than $347,000). So far, the West is the only region to see appreciation across all price tiers. As a result, the West widened the gap in June, and is now 2.0 percentage points ahead of the South, the next closest region.
The South continued to see growth in June of 1.5% over the quarter, and the trend strengthened slightly over May's rate of expansion of 1.2%. Meanwhile the quarterly performance in the Northeast doubled over the previous month, extending gains by 0.8% in June.
The Midwest's quarterly home prices saw the largest jump over the previous month, posting growth of 1.2%. When compared to May's quarterly losses of 2.0%, it's clear June brought a welcomed boost to the region that now appears to be catching up to the others over the short run. Trailing close behind the South, the Midwest surpassed the Northeast in gains on a quarter-over-quarter basis.
Typical for a market in the early stages of recovery, low tier sales in the Midwest (sales less than $101,000) saw the biggest quarterly gains of 2.2%, nearly a 4.0 percentage point advance over last month's losses. And in contrast to the West, where an accelerated recovery is underway across all price tiers, the mid and top tier segments of the Midwest continue to lag behind the gains of the low tier homes with quarterly growth of 1.6% and 0.4%, respectively.
Year-over-Year Prices: Improving and Expected to Grow Through 2012
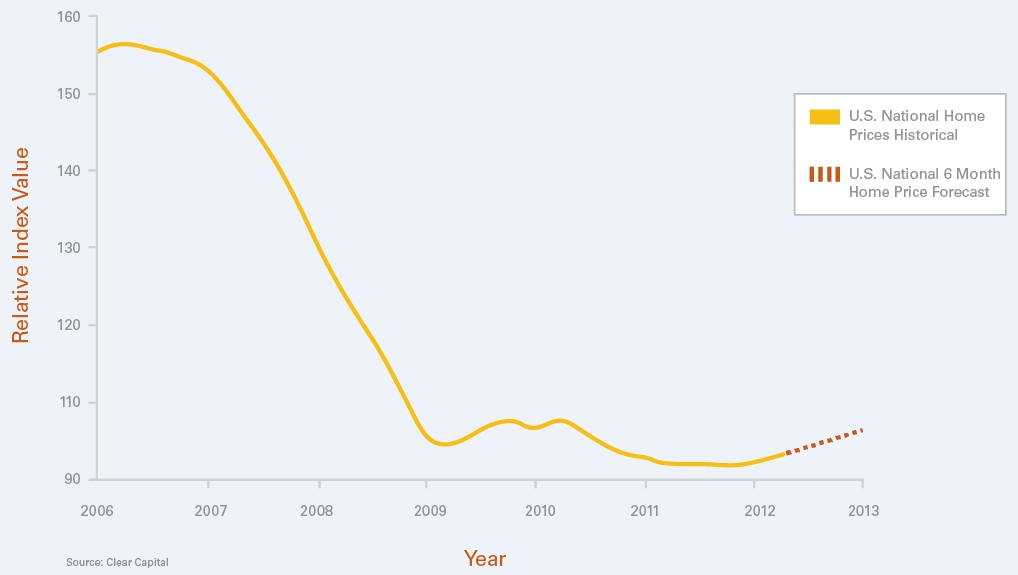
National home prices appreciated by 1.7% over the previous year, picking up notable momentum over last month's marginal gains of 0.1%. The progress is expected to extend over the second half of 2012, with additional growth of 2.5% forecasted through the end of the year. The current and future expected growth at the national level is a direct result of broad-based regional gains increasing in momentum, coupled with progress expanding across sectors, as seen in the West.
Falling in line with short term trends, the West made the largest contribution to national gains over the last year, posting annual price advances of 4.1%. The superior performance, fueled by expanded gains across price tiers, is expected to continue through 2012 with an additional 5.75% growth over the next two quarters.
Meanwhile, Northeast home prices tacked on 2.3% over the last year. This region, having experienced moderate yearly growth over the last nine months is also expected to see additional gains of 1.8% through the end of 2012.
The South saw prices inflate 1.5% over the last year, an improvement over the annual growth of 0.9% shown in last month's Market Report. The accelerating trend is expected to continue, with the South forecasted to see home prices notch up another 1.9% by year's end.
Certainly the Midwest made improvements in long term price trends, but just missed turning a gain with year-over-year losses of 0.6%. Although the region continued to see prices slide, the losses tapered significantly over the previous month's declines of 3.1%. And the correction should continue, with projected gains for the Midwest of 1.1% for the last half of 2012. While the shift in long term trends for the Midwest has yet to create tailwinds for the national performance, the previous drag associated with continued losses has been alleviated.
MSA Market Analysis and Forecast: Far More Metros Advancing than Declining
The top 50 metro markets generally made positive headway in June. The large majority of markets saw quarterly gains, while only seven markets saw prices slide. Of those markets that posted quarterly losses, only four saw declines greater than 1.0%. And while this recovery will continue to take place market by market, the relatively moderate losses among this group are encouraging.
The remaining 43 MSAs turned out growth over the last quarter, with average gains of 3.0% doubling the rate of average declines. Additionally, 10 of the 43 advancing markets saw quarter-over-quarter price growth exceed 5.0%, providing evidence the recovery is also picking up steam on a metro market level.
Columbus, OH, posted double-digit gains of 13.0%, but it's worth noting that gains alone don't tell the whole story behind this market's trends. Volatility for Columbus, OH is typical, having seen 14 quarterly price swings greater than 5.0% since the start of the downturn in 2006. Also worth considering is the relatively low median price-per-square-foot of $69, as compared to the national median price-per-square-foot of $105. Given the low price point, seemingly small shifts in price trends can have larger effects on percentage changes. While the growth for Columbus, OH is notable, chances are these trends won't be lasting.
Phoenix, on the other hand, has been a market showing consistent signs of strength for the past 10 months. With current quarterly growth of 8.7% and annual gains of 20.4%, the positive trends in this market are supported on a more sustainable basis.
The rolling quarter and annual performance for the top 50 MSAs, including REO saturation and forecast through 2012 are shown in Chart 3.
Chart 3: MSA Prices, REO Saturation, and Forecast through 2012
| Top 50 Major Markets | ||||||||||
| Qtr/Qtr Rank |
|
Metropolitan Statistical Area | Qtr/Qtr % +/- |
|
Yr/Yr | REO Saturation | 2012 Yr End Forecast |
|||
| 1 | Seattle, WA - Tacoma, WA - Bellevue, WA | 8.4% | 2.2% | 16.1% | 14.4% | |||||
| 2 | Phoenix, AZ - Mesa, AZ - Scottsdale, AZ | 8.7% | 20.4% | 22.8% | 10.4% | |||||
| 3 | Las Vegas, NV - Paradise, NV | 4.7% | 1.0% | 42.2% | 9.3% | |||||
| 4 | Miami, FL - Ft. Lauderdale, FL - Miami Beach, FL | 5.4% | 11.6% | 27.6% | 8.1% | |||||
| 5 | San Francisco, CA - Oakland, CA - Fremont, CA | 5.5% | 4.8% | 24.8% | 7.3% | |||||
| 6 | Washington, DC - Arlington, VA - Alexandria, VA | 6.3% | 10.1% | 11.6% | 7.0% | |||||
| 7 | San Jose, CA - Sunnyvale, CA - Santa Clara, CA | 8.1% | 6.5% | 17.6% | 6.6% | |||||
| 8 | Minneapolis, MN - St. Paul, MN - Bloomington, WI | 5.2% | 13.1% | 35.3% | 6.5% | |||||
| 9 | Jacksonville, FL | 6.3% | 6.4% | 27.1% | 5.0% | |||||
| 10 | Baltimore, MD - Towson, MD | 2.9% | 0.4% | 10.9% | 4.7% | |||||
| 11 | Hartford, CT - West Hartford, CT - East Hartford, CT | 3.1% | 9.1% | 6.6% | 4.5% | |||||
| 12 | NY, NY - No. New Jersey, NJ - Long Island, NY | 2.8% | 4.7% | 6.7% | 4.0% | |||||
| 13 | Denver, CO - Aurora, CO | 3.6% | 10.2% | 18.3% | 3.9% | |||||
| 14 | Tampa, FL - St. Petersburg, FL - Clearwater, FL | 1.3% | 8.2% | 23.6% | 3.8% | |||||
| 15 | Sacramento, CA - Arden, CA - Roseville, CA | 2.3% | 1.1% | 33.8% | 3.8% | |||||
| 16 | Columbus, OH | 13.0% | 14.3% | 27.4% | 3.5% | |||||
| 17 | Tucson, AZ | 2.7% | 0.3% | 37.6% | 3.4% | |||||
| 18 | Bakersfield, CA | 2.2% | 4.9% | 38.0% | 3.2% | |||||
| 19 | Houston, TX - Baytown, TX - Sugar Land, TX | 1.3% | 5.2% | 21.0% | 3.2% | |||||
| 20 | Orlando, FL | 1.4% | 8.5% | 29.7% | 3.1% | |||||
| 21 | Chicago, IL - Naperville, IL - Joliet, IL | 1.6% | -0.2% | 32.8% | 3.1% | |||||
| 22 | Riverside, CA - San Bernardino, CA - Ontario, CA | 1.9% | 1.9% | 37.4% | 3.0% | |||||
| 23 | Virginia Beach, VA - Norfolk, VA - Newport News, VA | 1.5% | 3.3% | 16.3% | 2.8% | |||||
| 24 | Louisville, KY-IN | 1.5% | 5.2% | 22.0% | 2.6% | |||||
| 25 | Los Angeles, CA - Long Beach, CA - Santa Ana, CA | 1.5% | 0.1% | 28.0% | 2.6% | |||||
| 26 | San Diego, CA - Carlsbad, CA - San Marcos, CA | 2.4% | 1.1% | 23.4% | 2.6% | |||||
| 27 | Pittsburgh, PA | 3.2% | 11.5% | 6.1% | 2.4% | |||||
| 28 | Portland, OR - Vancouver, WA - Beaverton, OR | 2.0% | 3.3% | 18.3% | 2.4% | |||||
| 29 | Fresno, CA | 0.9% | 3.1% | 39.3% | 2.3% | |||||
| 30 | Memphis, TN | -0.8% | -6.4% | 41.6% | 2.2% | |||||
| 31 | Boston, MA - Cambridge, MA - Quincy, MA | 1.3% | 3.2% | 9.5% | 1.7% | |||||
| 32 | Dayton, OH | 0.8% | 7.6% | 31.2% | 1.6% | |||||
| 33 | Richmond, VA | 1.7% | 3.4% | 19.5% | 1.3% | |||||
| 34 | Dallas, TX - Fort Worth, TX - Arlington, TX | 1.1% | 3.4% | 20.7% | 1.2% | |||||
| 35 | New Orleans, LA - Metairie, LA - Kenner, LA | 0.1% | -1.6% | 18.2% | 1.1% | |||||
| 36 | Cleveland, OH - Elyria, OH - Mentor, OH | 0.1% | 0.3% | 34.6% | 1.0% | |||||
| 37 | Honolulu, HI | -1.4% | 2.2% | 8.6% | 0.9% | |||||
| 38 | Oxnard, CA - Thousand Oaks, CA - Ventura, CA | 0.8% | -2.8% | 29.8% | 0.8% | |||||
| 39 | Nashville, TN - Davidson, TN - Murfreesboro, TN | 1.4% | 2.4% | 19.4% | 0.8% | |||||
| 40 | Cincinnati, OH - Middletown, OH | 0.6% | -2.9% | 24.2% | 0.4% | |||||
| 41 | Milwaukee, WI - Waukesha, WI - West Allis, WI | 5.8% | -2.9% | 32.4% | 0.4% | |||||
| 42 | Rochester, NY | -0.3% | 3.7% | 4.0% | 0.0% | |||||
| 43 | Providence, RI - New Bedford, MA - Fall River, MA | -4.9% | -8.7% | 14.2% | -0.3% | |||||
| 44 | Philadelphia, PA - Camden, NJ - Wilmington, DE | 0.7% | -3.7% | 14.1% | -0.5% | |||||
| 45 | Birmingham, AL - Hoover, AL | 2.5% | -9.3% | 40.2% | -0.6% | |||||
| 46 | St. Louis, MO-IL | 0.2% | -1.4% | 28.9% | -1.1% | |||||
| 47 | Detroit, MI - Warren, MI - Livonia, MI | -0.9% | -4.0% | 52.2% | -1.7% | |||||
| 48 | Raleigh, NC - Cary, NC | -1.1% | -4.1% | 16.1% | -2.0% | |||||
| 49 | Charlotte, NC - Gastonia, NC - Concord, NC | -1.2% | -4.9% | 13.5% | -2.4% | |||||
| 50 | Atlanta, GA - Sandy Springs, GA - Marietta, GA | 0.9% | -12.2% | 44.0% | -3.2% | |||||
Forecast Market Analysis:
Looking ahead to the forecast for the rest of 2012, metro markets from the Western region should see some of the highest gains. Four out of the top five forecasted MSAs reside in the West, with Seattle and Phoenix leading the way.
Seattle's forecast tops all others, with prices expected to roll up another 14.4% by year's end. With total losses since the height of the market at 44.5%, Seattle saw the downturn progress at a relatively slow and steady pace. While some markets bottomed out as early as 2009, the deepest of Seattle's losses weren't seen until November 2011. However Seattle saw peak REO saturation of just 28.0%, a stark contrast to markets like Phoenix where REO saturation soared to 63.0% by mid 2009.
Since 2009 Phoenix has made significant progress, and is expected to see current price gains bolstered by another 10.4% by year's end. Having been hit hard early on with one of the highest levels of REO saturation in the country, Phoenix sustained heavy declines of 63.0% by mid 2009, after which prices began to stabilize. And since bottoming, prices have rebounded 21.3%. While initial gains for Phoenix were concentrated in the low tier segment, they have now spread to mid and top tier home segments as well, much like the West. So not only is the market expected to see gains for the last half of the year, those gains will be continued momentum for a recovery well underway.
Atlanta, while also hit hard over the last six years, is not yet positioned to snap back like Seattle and Phoenix. Unlike other markets in recovery, the low tier segment in Atlanta saw yearly declines of 11.5%. Consequently, projections through the end of 2012 show Atlanta sustaining the largest declines of all the MSAs. However, the anticipated losses of 3.2% seem mild in comparison to Atlanta's total declines of 53.5% from peak prices in 2006.
Considering only eight out of 50 MSAs have negative projections through 2012, the housing market is on track to see progress outweigh minor setbacks. The progression of the recovery, however, remains vulnerable to peripheral risks in the jobs market, an uncertain regulatory environment, and global economic threats. The market is undoubtedly healing as the recovery unfolds, and is now the strongest it's been since the collapse in 2006. Excluding a major economic obstacle, an extended housing rebound should continue through year's end.
About the Clear Capital Home Data Index (HDI) Market Report
The Clear Capital HDI Market Report provides insights into market trends and other leading indices for the real estate market at the national and local levels. A critical difference in the value of the HDI Market Report is the capability of Clear Capital to provide more timely and granular reporting than other home price index providers.
The Clear Capital HDI Market Report:
- Offers the real estate industry (investors, lenders, and servicers), government agencies, and the public insight into the most recent pricing conditions, not only at the national and metropolitan level, but within local markets as well.
- Is built on the most recent information available from recorder/assessor offices, and then further enhanced by adding the company's proprietary streaming market data for the most comprehensive geographic coverage and local insights available.
- Reflects nationwide coverage of sales transactions and aggregates this comprehensive dataset at ten different geographic levels, including hundreds of metropolitan statistical areas (MSAs) and sub-ZIP code boundaries.
- Includes equally-weighted distressed bank owned sales (REOs) from around the country to give the most real world look of pricing dynamics across all sales types.
- Allows for the most current market data by providing more frequent updates with patent-pending rolling quarter technology. This ensures decisions are based on the most up-to-date information available.
Clear Capital Home Data Index Methodology
- Generates the timeliest indices in patent pending rolling quarter intervals that compare the most recent four months to the previous three months. The rolling quarters have no fixed start date and can be used to generate indices as data flows in, significantly reducing the multi-month lag time experienced with other indices.
- Includes both fair market and institutional (real estate owned) transactions, giving equal weight to all market transactions and identifying price tiers at a market specific level. By giving equal weight to all transactions, the HDI is truly representative of each unique market.
- Results from an address-level cascade create an index with the most granular, statistically significant market area available.
- Provides weighted repeat sales and price-per-square-foot index models that use multiple sale types, including single-family homes, multi-family homes, and condominiums.
About Clear Capital
Clear Capital (www.clearcapital.com) is a premium provider of data and solutions for real estate asset valuation and risk assessment for large financial services companies. Our products include appraisals, broker price opinions, property condition inspections, value reconciliations, home data indices, and automated valuation models. Clear Capital's combination of progressive technology, high caliber in-house staff, and a well-trained network of more than 40,000 field experts sets a new standard for accurate, up-to-date, and well documented valuation data and assessments. The Company's customers include the largest U.S. banks, investment firms and other financial organizations.
The information contained in this report is based on sources that are deemed to be reliable; however no representation or warranty is made as to the accuracy, completeness, or fitness for any particular purpose of any information contained herein. This report is not intended as investment advice, and should not be viewed as any guarantee of value, condition, or other attribute.
Contact Information:
Media Contact:
Alanna Harter
Marketing Manager, Clear Capital
530.550.2515