TRUCKEE, CA--(Marketwire - Nov 8, 2012) - Clear Capital (www.clearcapital.com), a premium provider of data and real estate asset valuation, investment, and risk assessment, today released its Home Data Index™ (HDI) Market Report with data through October 2012. The HDI Market Report uses a broad array of public and proprietary data sources providing the most timely and relevant analysis available.
Report highlights include:
- Housing trends were a tailwind for President Obama's second term win. Recent gains gave voters hope for a sustained housing recovery.
- The Obama Administration must lead phase two of the recovery by collaborating with industry to reduce regulatory uncertainty.
- Heading into the election, home price gains were steadfast in the face of uncertainty. National, regional, and metro gains accelerated in October.
"Now that the election is finally behind us, there should be no more political risk in addressing the housing problem head-on. President Obama's housing policies must evolve to turn the recovery's sprint into a marathon," said Dr. Alex Villacorta, Director of Research and Analytics at Clear Capital. "With a re-election secured, President Obama has the opportunity to stimulate lending activity by being bolder on policy. National gains of 4.6% over the year were enough to grab the attention of voters, and rightfully so.
"Even with the higher than historical annual average returns, lenders are still understandably cautious in the current environment of regulatory uncertainty. And that's left the middle class out in the cold, enticed by record affordability levels but unable to qualify for a loan. President Obama's opportunity is now to press policy makers to clear up regulations. Only then will lenders have confidence to fully re-engage in the housing market."
Housing helped President Obama keep his job and his home.
While each candidate ignored the political landmine of housing policy, voters clearly couldn't. Whether directly or indirectly, it would be hard to find a voter who hadn't been adversely affected by the housing collapse, and many are still at risk. While prices are up 4.6% over the year, they remain 37.6% below the peak. Given these losses, a home purchased for $200,000 in 2006 would likely be worth just $124,800 today. Obviously housing is a central issue for many voters, and we still have a long road ahead of us.
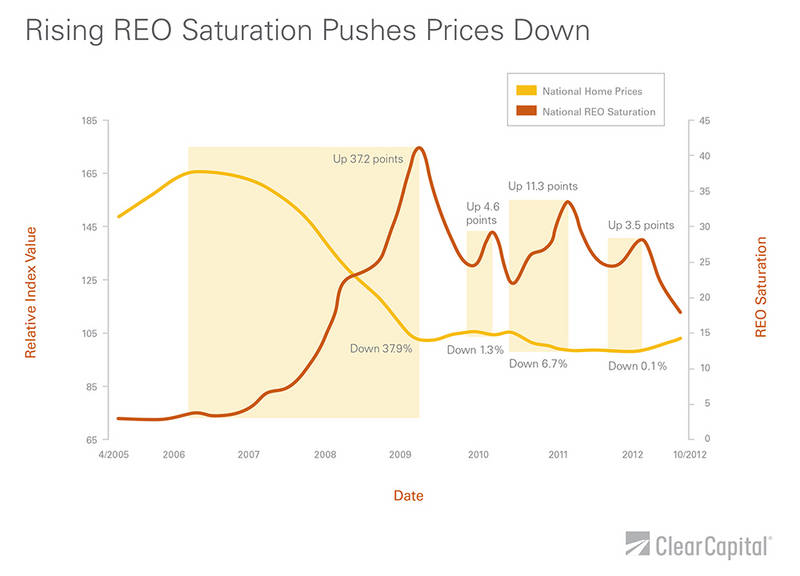
But recent progress gave voters confidence that gains would continue under an Obama Administration. In addition to national prices being up 4.6% over the year, REO saturation in October declined to just 18.1%. Since the peak in 2009, REO saturation dropped 23 percentage points.
After leading the economy into the Great Recession, housing progress is finally considered one of the only bright spots in a slow economic recovery. The quickest way to pull the economy out of the hangover from the Great Recession is for President Obama to support the middle class through housing. And that's just what they were counting on.
Obama's second term: Opportunity meets challenge
Now that the President is free from the shackles of the election, he must focus on bold action that will drive a sustained recovery; a recovery that will directly benefit the middle class who re-elected him.
The Obama Administration's current policies have helped. Since 2009 just over 1 million loan modifications, through HAMP, and 1.5 million refinances of underwater mortgages, through HARP, have taken place. These programs have helped reduce the pipeline of delinquent loans feeding the shadow REO inventory. Declines in REO saturation coincide with rising home prices, as seen most recently (Graph 1). Yet, since 2009, each time REO saturation climbed, prices have dropped.
Looking ahead, the Obama Administration's true opportunity (and challenge) is in bringing Wall Street and Main Street together. Lifting the paralyzing veil of uncertainty clouding the credit markets can't come soon enough. A successful outcome will produce regulatory clarification and collaboration between government agencies and the industry. After signing Dodd-Frank in 2010, key provisions like the Qualified Mortgage (QM) and Qualified Residential Mortgage (QRM) are still up in the air. This regulatory uncertainty exposes the industry to higher risk, putting private investors of mortgages on their heels. As a result, fewer potential buyers get loans. If regulations are clarified in a reasonable way, credit will thaw. This will support phase two of the housing recovery, as more of the middle class can qualify for home loans.
October Housing Trends: Persistent gains stubbornly refuse to give up.
Quarterly price gains picked up momentum in October, after a soft September. While current quarterly gains are all under 5.0%, October marks the fifth consecutive month of quarter-over-quarter home price growth.
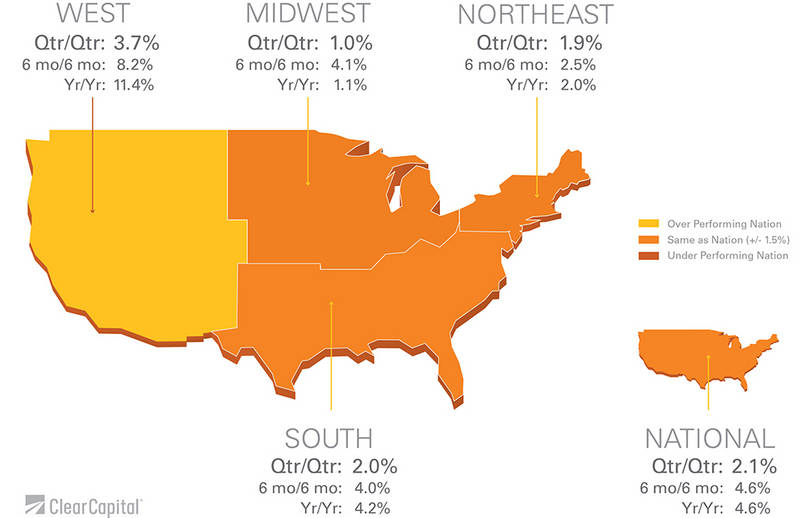
Nationally, prices edged up 2.1% over the rolling quarter, a slight uptick over September's rate of growth. The West came in strong again, with quarterly gains of 3.7%. The South posted gains of 2.0% over the rolling quarter.
Previously trailing in quarterly gains, the Northeast saw the largest jump in regional performance. Up 1.7 percentage points from September, the Northeast posted 1.9% growth quarter-over-quarter. Price gains across the low, mid, and top tier sectors all contributed to the region's quarterly improvement.
Meanwhile, the Midwest was the only region starting to feel winter's chill. Rolling quarterly growth of 1.0% was 0.9 percentage points lower than September's. Considering the Midwest has typically been the most volatile region, the slight slowdown in growth doesn't sound alarms. The Midwest tends to see quicker shifts in percentage change due to relatively low price points when compared to other regions. But there are certainly states within the Midwest, like Ohio, that have made notable progress. Ohio's recorded quarterly gains of 1.6% are secondary to its more substantial long term price growth of 15.0% since President Obama took office. Ohio is a great example of how housing was on the President's side.
Yearly home prices in October came in strong. National gains of 4.6% are the highest since August 2010, when the first-time-homebuyer tax credit was enticing buyers.
The West posted its first double digit yearly gains since 2006, at 11.4%. While the hard hit region showed little signs of slowing down, it has a long way to go. Current prices are still 42.9% below the peak. On par with quarterly trends, the Midwest saw yearly gains soften to 1.1%. This, in part, reflects higher prices a year ago when the region saw a short uptick.
October year-over-year home prices in the South and the Northeast made headway; each up at least 1.0 percentage point over September, to 4.2% and 2.0%, respectively. Virginia, a key swing state in the South, played an important role in President Obama's win. With yearly growth of 6.8%, Virginia outpaced its region by 2.6 points, so it's no surprise Virginia swung blue.
| Highest Performing Major Metro Markets | |||||||
| Qtr/Qtr | Metropolitan Statistical Area | Qtr/Qtr | Yr/Yr | REO Saturation | |||
| Rank | % +/- | ||||||
| 1 | Atlanta, GA - Sandy Springs, GA - Marietta, GA | 8.0% | 5.7% | 37.8% | |||
| 2 | Cleveland, OH - Elyria, OH - Mentor, OH | 7.1% | 4.9% | 27.4% | |||
| 3 | Seattle, WA - Tacoma, WA - Bellevue, WA | 7.0% | 15.9% | 9.2% | |||
| 4 | Honolulu, HI | 6.9% | 2.6% | 9.1% | |||
| 5 | San Jose, CA - Sunnyvale, CA - Santa Clara, CA | 6.8% | 15.8% | 9.8% | |||
| 6 | San Francisco, CA - Oakland, CA - Fremont, CA | 6.5% | 15.9% | 15.1% | |||
| 7 | Providence, RI - New Bedford, MA - Fall River, MA | 6.4% | 3.6% | 7.8% | |||
| 8 | Tucson, AZ | 6.0% | 12.8% | 30.6% | |||
| 9 | Phoenix, AZ - Mesa, AZ - Scottsdale, AZ | 5.8% | 29.5% | 19.9% | |||
| 10 | Minneapolis, MN - St. Paul, MN - Bloomington, WI | 5.3% | 18.2% | 19.1% | |||
| 11 | Las Vegas, NV - Paradise, NV | 4.7% | 11.9% | 36.8% | |||
| 12 | Sacramento, CA - Arden, CA - Roseville, CA | 4.6% | 9.7% | 22.6% | |||
| 13 | Washington, DC - Arlington, VA - Alexandria, VA | 4.6% | 12.9% | 6.0% | |||
| 14 | Milwaukee, WI - Waukesha, WI - West Allis, WI | 4.2% | 4.9% | 19.0% | |||
| 15 | Miami, FL - Ft. Lauderdale, FL - Miami Beach, FL | 4.2% | 14.4% | 26.3% | |||
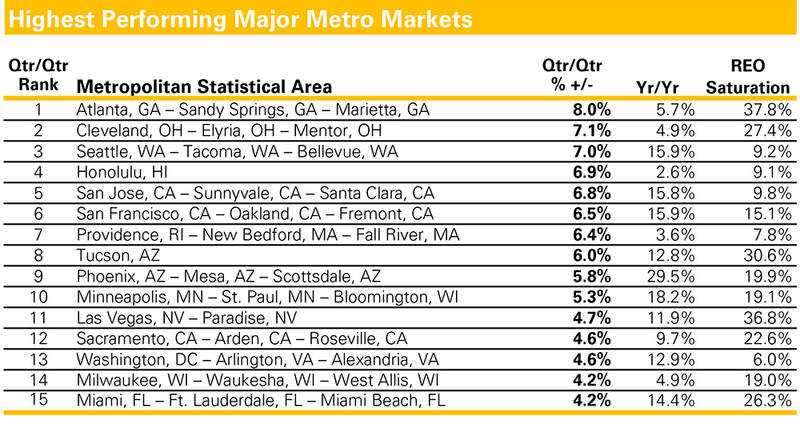
The highest performing metros are a diverse group. In October, strong markets like Phoenix and Seattle were bested by Atlanta. However, Atlanta is in the early stages of a recovery, highlighted by a relatively high REO saturation rate of 37.8%.
Atlanta's growth of 8.0% over the last rolling quarter represents a significant reversal for the market. Even though REO saturation remains the highest on the list, the new found growth was supported by a 9.7 percentage point drop over the last six months.
While trends are improving, Atlanta's price points are extremely low, with a median price-per-square-foot of just $58. That's nearly half the national median price-per-square-foot of $107. Even slight shifts in price can have a relatively large impact on percentage change for Atlanta.
And we can't overlook Cleveland's strong performance. Both quarterly and yearly gains, of 7.1% and 4.9%, respectively, outpaced national, regional, and state returns. The connection between housing progress in Cuyahoga County and Ohio voters' confidence in President Obama's ability to move the housing market forward is undeniable.
| Lowest Performing Major Metro Markets | |||||||
| Qtr/Qtr | Metropolitan Statistical Area | Qtr/Qtr | Yr/Yr | REO Saturation | |||
| Rank | % +/- | ||||||
| 1 | Columbus, OH | -3.2% | 0.4% | 26.7% | |||
| 2 | Charlotte, NC - Gastonia, NC - Concord, NC | -0.9% | -3.6% | 17.0% | |||
| 3 | New Orleans, LA - Metairie, LA - Kenner, LA | -0.5% | -2.0% | 18.7% | |||
| 4 | Dallas, TX - Fort Worth, TX - Arlington, TX | 0.1% | 0.5% | 25.0% | |||
| 5 | Hartford, CT - West Hartford, CT - East Hartford, CT | 0.2% | 1.2% | 3.8% | |||
| 6 | St. Louis, MO | 0.3% | 0.4% | 30.2% | |||
| 7 | Rochester, NY | 0.3% | 1.5% | 3.0% | |||
| 8 | Chicago, IL - Naperville, IL - Joliet, IL | 0.4% | -1.6% | 28.8% | |||
| 9 | Boston, MA - Cambridge, MA - Quincy, MA | 0.5% | 0.9% | 5.7% | |||
| 10 | Philadelphia, PA - Camden, NJ - Wilmington, DE | 0.6% | -2.3% | 7.0% | |||
| 11 | Memphis, TN | 1.3% | -5.1% | 40.8% | |||
| 12 | Oxnard, CA - Thousand Oaks, CA - Ventura, CA | 1.4% | 3.0% | 20.2% | |||
| 13 | Tampa, FL - St. Petersburg, FL - Clearwater, FL | 1.5% | 7.0% | 24.9% | |||
| 14 | Richmond, VA | 1.7% | 4.2% | 14.0% | |||
| 15 | Cincinnati, OH - Middletown, OH | 1.7% | 2.5% | 18.6% | |||
The group of lowest performing metros are a great example of how housing trends continue to differ market by market. While Ohio and Virginia are doing relatively well overall, we have markets like Columbus, Cincinnati, and Richmond lagging behind top performers, though each has posted yearly growth. The fact that the weakest markets are still posting yearly growth is a true testament to the state of the recovery and voters' confidence in President Obama's ability to sustain it.
And after coming in as one of the strongest 15 markets four times in 2012, Tampa landed on the list of lowest performing metros in October. Over the last year, the low tier segment has been a key growth driver for Tampa. But, losses of 5.3% over the last quarter in Tampa's low price segment (homes selling for $62,000 and less) created a drag on the overall market's quarterly gains of 1.5%. Additionally, Tampa's REO saturation rose nearly one percentage point over the last quarter. While this market continues to see measured growth, it's not on the same trajectory as other markets, like Atlanta.
Tampa is a great example of how seemingly small shifts in the status quo can disrupt the momentum of price gains. The housing recovery has been built upon the delicate balance between declining distressed sales and increased buyer activity. Until more of the middle class has access to credit, the recovery will be constrained. President Obama's work is far from done.
About the Clear Capital Home Data Index (HDI) Market Report
The Clear Capital HDI Market Report provides insights into market trends and other leading indices for the real estate market at the national and local levels. A critical difference in the value of the HDI Market Report is the capability of Clear Capital to provide more timely and granular reporting than other home price index providers.
The Clear Capital HDI Market Report:
- Offers the real estate industry (investors, lenders, and servicers), government agencies, and the public insight into the most recent pricing conditions, not only at the national and metropolitan levels, but within local markets as well.
- Is built on the most recent information available from recorder/assessor offices, and then further enhanced by adding the company's proprietary streaming market data for the most comprehensive geographic coverage and local insights available.
- Reflects nationwide coverage of sales transactions and aggregates this comprehensive dataset at ten different geographic levels, including hundreds of metropolitan statistical areas (MSAs) and sub-ZIP code boundaries.
- Includes equally-weighted distressed bank owned sales (REOs) from around the country to give the most real world look of pricing dynamics across all sales types.
- Allows for the most current market data by providing more frequent updates with patent pending rolling quarter technology. This ensures decisions are based on the most up-to-date information available.
Clear Capital Home Data Index Methodology
- Generates the timeliest indices in patent pending rolling quarter intervals that compare the most recent four months to the previous three months. The rolling quarters have no fixed start date and can be used to generate indices as data flows in, significantly reducing the multi-month lag time experienced with other indices.
- Includes both fair market and institutional (real estate owned) transactions, giving equal weight to all market transactions and identifying price tiers at a market specific level. By giving equal weight to all transactions, the HDI is truly representative of each unique market.
- Results from an address-level cascade create an index with the most granular, statistically significant market area available.
- Provides weighted repeat sales and price-per-square-foot index models that use multiple sale types, including single-family homes, multi-family homes, and condominiums.
About Clear Capital
Clear Capital (www.clearcapital.com) is a premium provider of data and solutions for real estate asset valuation and risk assessment for large financial services companies. Our products include appraisals, broker price opinions, property condition inspections, value reconciliations, automated valuation models, quality assurance services, and home data indices. Clear Capital's combination of progressive technology, high caliber in-house staff, and a well-trained network of more than 40,000 field experts sets a new standard for accurate, up-to-date, and well documented valuation data and assessments. The Company's customers include the largest U.S. banks, investment firms, and other financial organizations.
The information contained in this report is based on sources that are deemed to be reliable; however no representation or warranty is made as to the accuracy, completeness, or fitness for any particular purpose of any information contained herein. This report is not intended as investment advice, and should not be viewed as any guarantee of value, condition, or other attribute.
Contact Information:
Media Contact:
Alanna Harter
Marketing Manager
Clear Capital
530.550.2515
alanna.harter@clearcapital.com