Contact Information: Media Contact: Michelle Sabolich Atomic PR for Clear Capital (415) 402-0230
Clear Capital Reports 7.3% U.S. Home Price Gains, Softening REO Influences
National Price Gains Continue Positive Climb; Real Estate Owned (REO) Saturation Rates Decline; Los Angeles and Fresno Markets Show Positive Quarterly Price Gains for the First Time Since 2006; and Chicago Achieves Its Largest Quarterly Gain This Decade
| Source: Clear Capital
TRUCKEE, CA--(Marketwire - September 3, 2009) - Clear
Capital™ (www.clearcapital.com), a premium provider of data and
solutions for real estate asset valuation, investment and risk assessment,
today released its Home Data
Index™ (HDI) Market
Report. Patent pending rolling quarter technology significantly reduces the
multi-month lag time associated with other indices to help investors, loan
servicers and individual buyers and sellers make more informed, timely and
profitable decisions. This month's report features data compiled through
August 25, 2009.
Key report highlights include:
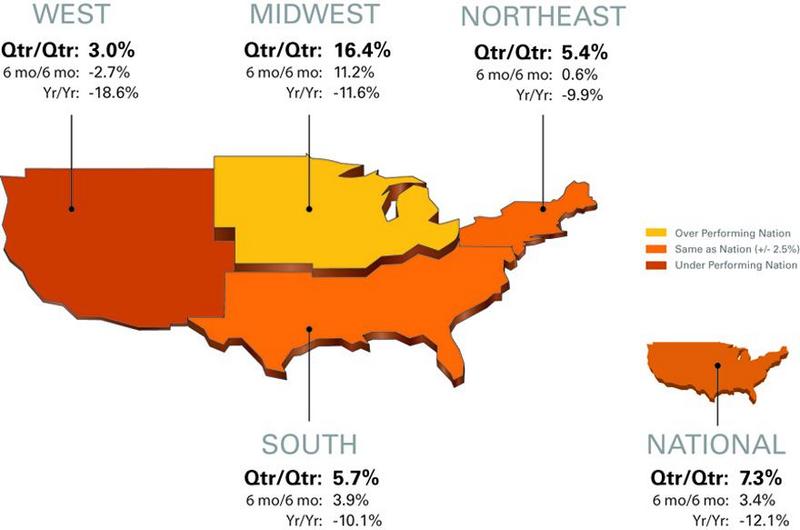
-- National / Four Region Overview: National quarterly price gains reach
7.3 percent, with the Midwest (16.4), South (5.7), Northeast (5.4), and
West (3.0) regions all continuing to post gains. The national REO
saturation rate (percentage of REOs sold to all properties sold in the last
rolling quarter) dropped more than three points since last month's report
to 30.1 percent.
-- Metropolitan Statistical Area (MSA) drilldown: REO saturation
levels decline with 28 of the 30 major markets improving over last month's
rates. Los Angeles and Fresno return first positive quarterly price gains
since mid-2006, while REO properties make up a smaller portion of
California sales.
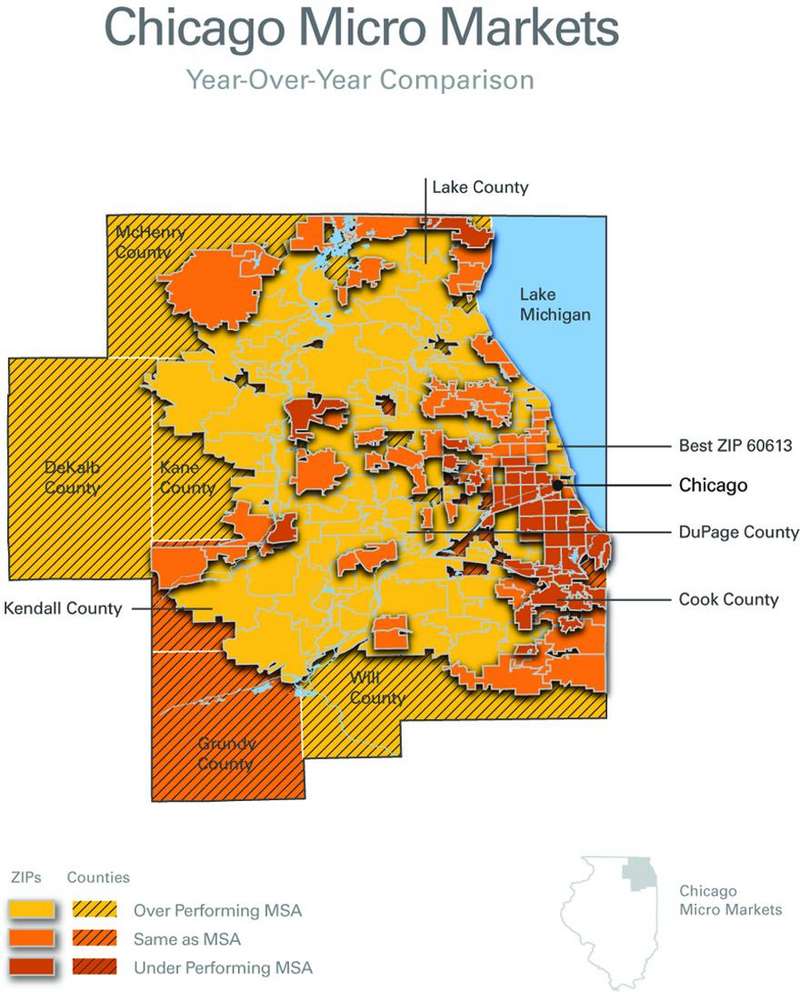
-- Micro Market Analysis: Up from record lows, the Chicago MSA achieves its
largest quarterly gain this decade (19.9%).
The Clear Capital HDI Market Report offers the industry, investors and
lenders a near real-time look at pricing conditions not only at the
national and metropolitan level, but within local markets. Clear Capital
data is built on the most recent data available from recorder/assessor
offices, and then further enhanced by adding the Company's proprietary
market data for the most comprehensive geographic coverage available.
"The price changes in this month's highest and lowest performing markets
lists speak to the extremely positive summer home buying season -- more
than what can be attributed to seasonality," said Kevin Marshall,
President of Clear Capital.
"While we do expect more REO inventory to hit the market as we close 2009,
this dramatic seasonal price and volume increase in sales of non-REO homes
could create positive momentum going into the normally slow fall and winter
seasons," said Marshall. "Buyers are getting nervous that they are missing
the bottom of the market, so they're choosing to get in the market now.
These factors greatly increase the chances of a springtime recovery next
year."
National/Four Region Market Overview (July 27, 2008 - Aug. 25, 2009)
Distressed sales have outpaced the inflow of new REOs over the
last quarter, softening the downward pressures introduced by REOs and
aiding recent price gains. This reduction in the REO saturation rate
improves the chances short term price gains could extend to robust,
longer-term price stabilization.
The national price gains of 7.3 percent for the most recent rolling quarter
along with this month's 3.2 point drop in REO saturation rates to 30.1
percent suggest improved conditions.
The Midwest, Northeast and South have similar yearly losses, which further
highlight the disparity still present in the REO-saturated West. However,
the West did continue to expand its quarterly price gain to 3.0 percent,
while reducing its quarterly REO saturation rate to 41.9 percent -- a 3.4
point reduction from last month.
Metro Markets (July 27, 2008 - Aug. 25, 2009)
Once again Cleveland earned the highest price gains driven by a shift in
its market's composition. Cleveland's REO saturation rates plummeted from a
late winter record of 58.5 percent to the current level of 35.2 percent.
This reflects a decline in REO sales volume (-29.9%) accompanied by an
82.5% increase in the number of fair market sales when compared to last
rolling quarter. In addition, combined sale volumes grew by 16.6 percent;
and the median sale price jumped from $50,000 to $97,500 over the same
period.
The magnitude of price gains among the rest of the highest performing
markets continues to climb as well. These gains represent a distinct shift
away from the consistently poor market conditions over the past several
years and place many of these markets within striking distance of returning
year-over-year gains.
All but one (St. Louis) of the markets on this month's list saw declining
REO saturation rates over last month's figures, indicating improved
conditions are spreading beyond the REO segment of the market.
Chicago (the subject of this month's micro market analysis) returned to REO
saturation levels the city saw last summer, which is nearly a ten percent
improvement over its peak of 42.3 percent last winter. Similar improvement
in pricing conditions placed Chicago in sixth position among the highest
performing major markets.
The number of major markets on the list with positive quarter-over-quarter
price gains grew to eleven this month. It's important to note that both the
Los Angeles and Fresno markets experienced quarterly gains for the first
time since mid-2006. The REO saturation rates for both of these California
markets also improved 3.1 and 4.1 percent over last month, respectively.
Phoenix, the focus of last month's micro market analysis and among the
longtime leaders of price declines, did not make this month's list with a
4.1 percent price gain for the quarter, and a 3.1 percent drop in REO
saturation to 58.5 percent.
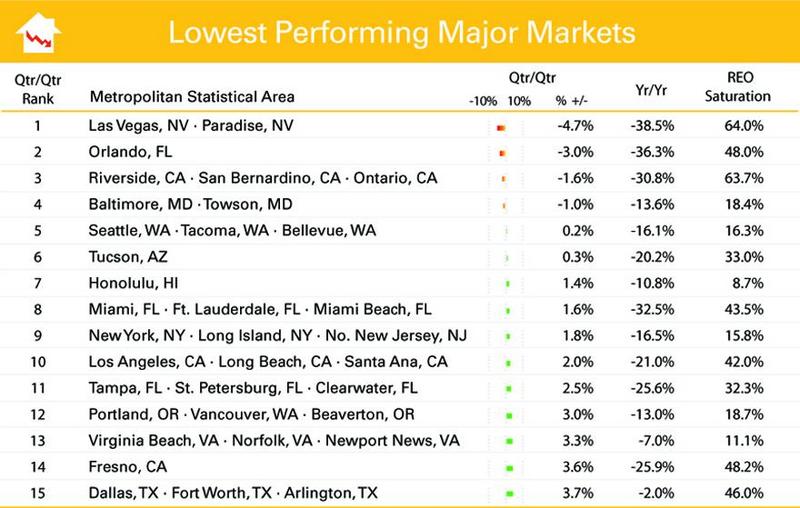
The lowest performing major markets also saw all fifteen markets experience
flat or improving REO saturation rates. The continued growth of positive
price gains might indicate the start of the long process of eroding the
stronghold REO properties have had in many of these markets.
Micro Markets (July 27, 2008 - Aug. 25, 2009)
This section highlights a single market every month with a deeper dive into
how the micro- and macro-markets relate to each other.
Chicago's current quarterly gain is its first in three years. The magnitude
(19.9%) of the gain was large enough to wipe out the losses of last winter,
returning home prices to 2008 holiday season levels. This was Chicago's
second largest quarterly price swing of the decade only surpassed by last
fall's price change of -20.3 percent. This gain is somewhat muted, however,
when put in perspective with Chicago's market at the beginning of this year
when it reached its peak price decline since 2006 (-54.1%). This month's
price increase moved the market 9.1 points in a positive direction to -45.0
percent.
Chicago's yearly losses have generally radiated from the city center out to
the suburbs, mostly avoiding the shores of Lake Michigan. DuPage County
experienced a price change of -13.6 percent over the last year, beating out
neighboring Cook County's -34.8 percent change.
Cook County's Lakeview area that surrounds Wrigley field (ZIP 60613) turned
in a 2.3 percent yearly gain -- the best in the Chicago metropolitan area.
In addition, Lakeview is currently experiencing a modest REO saturation
rate of 5.1 percent. Aside from appealing to sports fans, Lakeview's
quality homes, numerous retail and social locations, and close proximity to
the downtown business core have sustained home prices far better (-2.7%)
than the Chicago MSA (-45.0%) since the market's peak in 2006.
Clear Capital Home Data Index™ Methodology
The Clear Capital Home Data Index (HDI) provides weighted paired sales, and
price-per-square-foot index models that use multiple sale types, including
single-family homes, multi-family homes and condominiums. These models are
combined with an address-level cascade to provide sale-type-specific
analysis for thousands of geographic areas across the country. The indices
include both fair market and institutional (real estate owned)
transactions. They also provide indicators of REO activity such as REO
discount rates, REO days on market and REO saturation. The Clear Capital
HDI generates indices in patent pending rolling quarter intervals that
compare the most recent four months to the previous three months. The
rolling quarters have no fixed start date and can be used to generate
indices as data flows in, or at any arbitrary time period.
About Clear Capital
Clear Capital (www.clearcapital.com) is a premium provider of data and
solutions for real estate asset valuation and risk assessment for large
financial services companies. Our products include appraisals, broker-price
opinions, property condition inspections, value reconciliations, and home
data indices. Clear Capital's combination of progressive technology, high
caliber in-house staff and a well-trained network of more than 40,000 field
experts sets a new standard for accurate, up-to-date and well documented
valuation data and assessments. The Company's customers include 75 percent
of the largest U.S. banks, investment firms and other financial
organizations.
Legend
Address Level Cascade - Provides the most granular market data available.
From the subject property, progressively steps out from the smallest market
to larger markets until data density and statistical confidence are
sufficient to return a market trend.
Home Data Index (HDI) - Major intelligence offering that provides
contextual data augmenting other, human-based valuation tools. Clear
Capital's multi-model approach combines address-level accuracy with the
most current proprietary home pricing data available.
Metropolitan Statistical Area (MSA) - Geographic entities defined by the
U.S. Office of Management and Budget (OMB) for use by Federal statistical
agencies in collecting, tabulating, and publishing Federal statistics.
Paired Sales Model - Weighted linear model based on repeat sales of same
property over time.
Price Per Square Foot (PPSF) Model - Median price movement of sale prices
divided by square footage over a period of time -- most commonly a quarter.
Real Estate Owned (REO) Saturation - Calculates the percentage of REOs sold
as compared to all properties sold in the last rolling quarter.
Rolling Quarters - Patent pending rolling quarters compare the most recent
four months to the previous three months.
The information contained in this report is based on sources that are
deemed to be reliable; however no representation or warranty is made as to
the accuracy, completeness, or fitness for any particular purpose of any
information contained herein. This report is not intended as investment
advice, and should not be viewed as any guarantee of value, condition, or
other attribute.