TRUCKEE, CA--(Marketwire - March 4, 2010) - Clear Capital (www.clearcapital.com), a premium provider of data and solutions for real estate asset valuation, investment and risk assessment, today released its Home Data Index™ (HDI) Market Report. Patent pending rolling quarter technology significantly reduces the multi-month lag time associated with other indices to help investors, loan servicers and individual buyers and sellers make more informed, timely and profitable decisions.
Report highlights include:
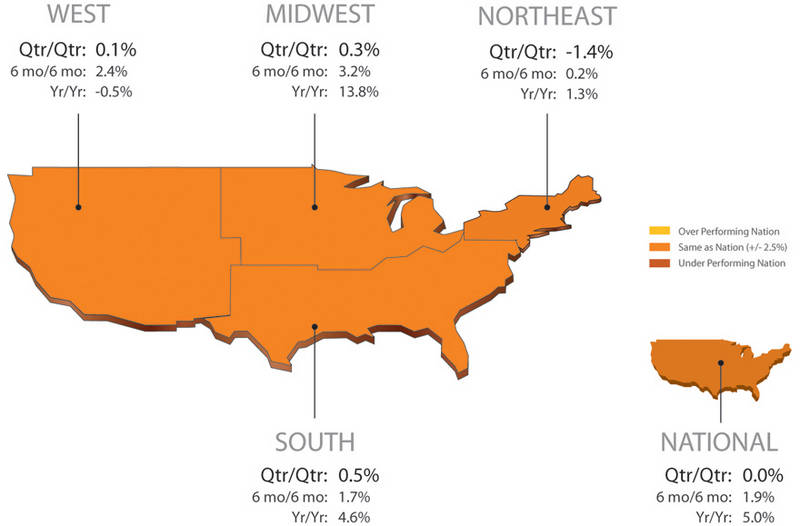
- National / Four Region Overview: With February numbers accounted for, the National yearly home prices continued to improve posting a 5.0% price change, while quarter-over-quarter price change was flat at 0.0%. All four U.S. regions posted very consistent quarterly price changes within 1.4% of the national figure.
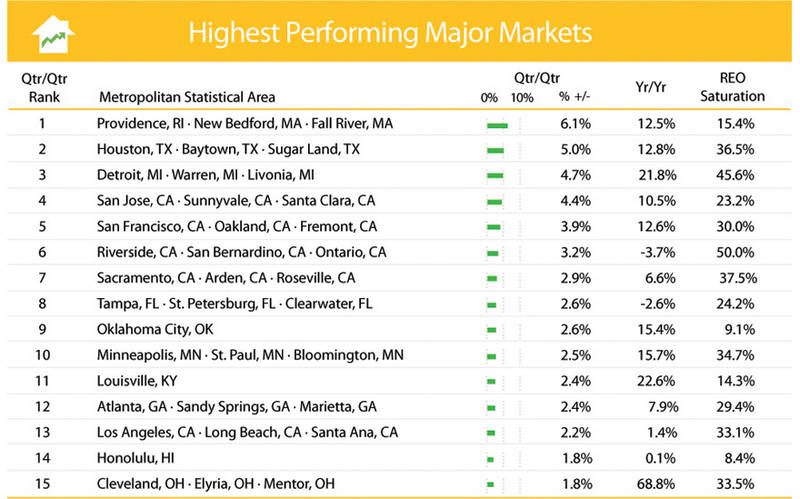
- Metropolitan Statistical Area (MSA) drilldown: Providence, R.I. rose to the top of the highest performing markets list with a 6.1% quarterly price change. Los Angeles, Calif. prices gained 2.2% for the quarter, giving California five of the 15 highest performing markets. REO saturation edged up in eleven of fifteen of these markets this month by an average of 1.3%.
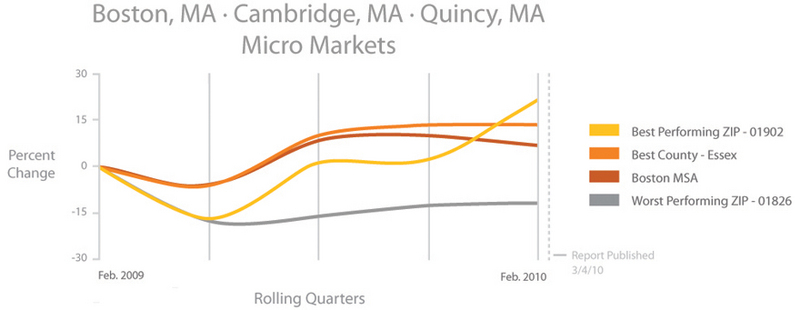
- Micro Market Analysis: The Boston, Mass. micro markets, one of the first to see prices drop at the beginning of the downturn, saw yearly home prices recover 6.9%.
The Clear Capital HDI Market Report offers the industry, investors and lenders a timely look at pricing conditions, not only at the national and metropolitan level, but within local markets as well. Clear Capital data is built on the most recent data available from recorder/assessor offices, and then further enhanced by adding the Company's proprietary market data for the most comprehensive geographic coverage available.
"Although many markets have seen a slow down in price gains, I'm encouraged that prices have remained positive through the first two months of the year despite all the negative economic news and threat of more REOs hitting the markets," said Dr. Alex Villacorta, Senior Statistician, Clear Capital. "If the increase in demand that preceded the end of the last tax credit is any indication, home prices may dip only slightly into negative territory before getting an added boost before the April tax credit deadline."
"We observed an expected increase in REO saturation this month as the flow of foreclosures continued to come into the market, while traditional non-distressed sales wait to be listed in the spring and summer months," added Villacorta.
National/Four Region Market Overview (Feb. 2009 - Feb. 2010)
This month's national year-over-year home price gains (5.0%) speak favorably to the improved market picture today compared to the first months of 2009 in which the availability of credit was limited, nearly all investments were rapidly losing value, and REOs flooded the market as institutions faced the risk of failure.
Steeply discounted REOs became attractive to investors and new home buyers with the stabilization of credit and subsequent bailouts, renewed gains in some segments of the market, and the offering of homebuyer tax credits. While the current inventory of short sales is significant and feeding concerns over shadow inventories, demand for discounted REOs has buoyed prices well into winter -- and should continue through the end of the current tax credit. This demand has been muted, however, by a slowdown in winter sales, pushing the current quarterly national gain flat (0.0%). Amid this current slowdown, REO saturation rose to 26.1 percent, a 1.3 percent increase over last month.
While the risk of additional inventories arriving later in 2010 should not be discounted, this inflow might arrive with a stronger springtime and summer buying season, helping to ease the shock as initial inventories feed into what could be a potentially competitive marketplace for REOs.
Metro Markets (Feb. 2009 - Feb. 2010)
Providence, R.I. -- the second highest performing major market from last month -- rose to the top of the list as Detroit, Mich. saw its previously elevated gains decline 9.9 percentage points, to a smaller 4.7 percent price change for this rolling quarter.
All of this month's highest performing markets -- with the exception of Cleveland, Ohio -- improved their yearly results compared to last month, and maintained positive quarterly gains. Despite the positive signs in the yearly results, the quarterly slowdown seen at the national level was exemplified among the highest performing markets with gains decreasing by an average of 2.5 percentage points compared to last month. Three MSAs -- Honolulu, Hawaii; Houston, Texas; and Tampa, Fla. -- did manage increased quarterly gains over last month, however, improving 2.0, 2.9 and 0.2 percent points, respectively. With other MSAs experiencing smaller quarterly gains, the Los Angeles, Calif. MSA managed to hold relatively stable compared to last month, allowing it to move up to thirteenth on this month's list. Including Los Angeles, California markets comprised one-third of this month's list.
Also of note, REO saturation edged up in eleven of the fifteen markets this month by an average of 1.3 percent. However, the large glut of the much discussed shadow inventory has not yet flooded the market, hinting that the banks are being very circumspect in how they release inventory.
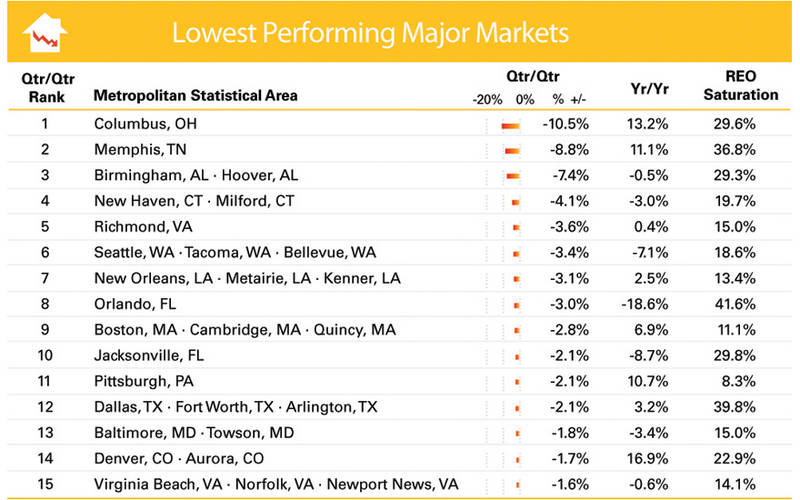
Yearly price gains extended among the lowest performing major markets, with eight markets returning positive gains compared to six on the list last month. However, quarterly prices continue to slide and REO saturation has started to increase among all but one of the markets (Baltimore, Md.). Columbus, Ohio, saw the highest month-over-month rise in REO saturation (4.3 percent) -- contributing to its rise to the top of the list.
New Haven, Conn.; New Orleans, La.; Boston, Mass.; and Dallas, Texas remained fairly stable over last month -- slightly improving their quarterly rates of decline. New Haven saw the largest yearly improvement compared to last month's report, reducing its yearly decline by 5.0 percentage points to -3.0 percent through the end of February.
Micro Markets (Feb. 2009 - Feb. 2010)
This section highlights a single market every month with a deeper dive into how the micro- and macro-markets relate to each other.
The Boston MSA, one of the first major markets to see prices drop at the beginning of the downturn, saw prices start falling in 2005 -- nearly a year ahead of the national decline. Between Boston's micro markets peak in mid-2005 until early 2009, home prices dropped 37.2 percent. Today, home prices have recovered 6.9 percent over last year's numbers, helping reduce the total loss from the market's peak to -28.6 percent. During the downturn, the Boston area has still been prone to seasonal price swings and has managed one quarterly gain each year, albeit very slightly sometimes -- an important consideration when making financial decisions in this marketplace.
Lynn, Mass. (ZIP code 01902) offers an example of how the strong gains of mid-to-late 2009 are prevalent in some of Boston's hardest hit urban areas. Home prices in Lynn fell 62.7 percent by May of 2009 from the market's peak. But over the last year, Lynn's 21.8 percent price change has outperformed the Boston area as buyers have shown interest in Lynn's steeply discounted homes. As a lower priced area with ample variety of homes and an industrial base, Lynn is subject to the market's volatility, both down and up, that frequently comes along with investor activity and more affordable housing.
With a -11.7 percent price change this past year, the northern outskirts of Dracut, Mass. (ZIP code 01826) have underperformed the Boston area. However, contrary to Lynn, Dracut has actually outperformed the greater Boston area since 2005, posting a price change of -27.8 percent. Dracut has benefited from the influences of newer local development, which seem to add a level of supply and pricing regulation to the market as developers maintain some control over pricing while holding inventory. While apparently missing out on the immediate price gains experienced in Lynn, Dracut's home prices haven't been as volatile during the downturn and could see a paced recovery in the future.
Clear Capital Home Data Index™ Methodology
The Clear Capital Home Data Index (HDI) provides weighted paired sales, and price-per-square-foot index models that use multiple sale types, including single-family homes, multi-family homes and condominiums. These models are combined with an address-level cascade to provide sale-type-specific analysis for thousands of geographic areas across the country. The indices include both fair market and institutional (real estate owned) transactions. They also provide indicators of REO activity such as REO discount rates, REO days on market and REO saturation. The Clear Capital HDI generates indices in patent pending rolling quarter intervals that compare the most recent four months to the previous three months. The rolling quarters have no fixed start date and can be used to generate indices as data flows in, or at any arbitrary time period.
About Clear Capital
Clear Capital (www.clearcapital.com) is a premium provider of data and solutions for real estate asset valuation and risk assessment for large financial services companies. Our products include appraisals, broker-price opinions, property condition inspections, value reconciliations, and home data indices. Clear Capital's combination of progressive technology, high caliber in-house staff and a well-trained network of more than 40,000 field experts sets a new standard for accurate, up-to-date and well documented valuation data and assessments. The Company's customers include 75 percent of the largest U.S. banks, investment firms and other financial organizations.
Legend
Address Level Cascade -- Provides the most granular market data available. From the subject property, progressively steps out from the smallest market to larger markets until data density and statistical confidence are sufficient to return a market trend.
Home Data Index (HDI) -- Major intelligence offering that provides contextual data augmenting other, human-based valuation tools. Clear Capital's multi-model approach combines address-level accuracy with the most current proprietary home pricing data available.
Metropolitan Statistical Area (MSA) -- Geographic entities defined by the U.S. Office of Management and Budget (OMB) for use by Federal statistical agencies in collecting, tabulating, and publishing Federal statistics.
Paired Sales Model -- Weighted linear model based on repeat sales of same property over time.
Price Per Square Foot (PPSF) Model -- Median price movement of sale prices divided by square footage over a period of time -- most commonly a quarter.
Real Estate Owned (REO) Saturation -- Calculates the percentage of REOs sold as compared to all properties sold in the last rolling quarter.
Rolling Quarters -- Patent pending rolling quarters compare the most recent four months to the previous three months.
The information contained in this report is based on sources that are deemed to be reliable; however no representation or warranty is made as to the accuracy, completeness, or fitness for any particular purpose of any information contained herein. This report is not intended as investment advice, and should not be viewed as any guarantee of value, condition, or other attribute.
Contact Information:
Media Contact:
Michelle Sabolich
Atomic PR for Clear Capital
415.593.1400