TRUCKEE, CA--(Marketwire - December 9, 2010) - Clear Capital (www.clearcapital.com) released its monthly Home Data Index™ (HDI) Market Report, providing the most current (through November 2010) and granular analysis of how local markets performed compared to the national downward trend in home prices.
The quarter-over-quarter price change at the national level (-5.8%) provides an alert of downward momentum. Understanding local market dynamics, however, is critical for managing home price risk. Prices variances increase with granularity, with individual micro markets often performing differently than the greater metro area, giving credence to the adage that real estate is local.
Report highlights include:
- Micro Market Analysis (Denver, CO): While current quarterly and yearly price changes indicate Denver is performing similarly to the nation, overall trending from the home pricing run-up to today shows that Denver is clearly outperforming national prices.
- Metropolitan Statistical Area (MSA) drilldown: Only Honolulu, HI and Washington D.C. maintain quarterly and yearly price gains. The six lowest performing markets experienced double-digit quarterly losses.
- National/Four Region Overview: National home price declines slow, but still show no firm signs of bottoming out. The South region is closing in on a double dip, only 2.3% above the lows it experienced in 2009.
- 13 of the top 50 metro markets measured have double dipped (up from six reported last month), indicating that their current price levels are the lowest since the housing downturn began. Markets currently experiencing a double dip include: Charlotte, NC; Jacksonville, FL; Las Vegas, NV; Miami, FL; Nashville, TN.; Orlando, FL; Philadelphia, PA.; Portland, OR; Richmond, VA; Seattle, WA; Tampa, FL; Tucson, AZ; and Virginia Beach, VA.
"It's encouraging that the immediate and dramatic decline in prices that we observed since mid August appears to be softening," said Dr. Alex Villacorta, Senior Statistician, Clear Capital. "But any optimism should be tempered by the fact that November's numbers show continued significant downward pressure for home prices. Nationally, prices are six percent above double dip territory, but are down eight percent since the momentum from the tax credit ended."
"From a local perspective, we continue to see individual markets distance themselves from national price levels in both positive and negative directions," added Dr. Villacorta. "For example, Washington, D.C. maintains its positive price growth with prices now 15 percent above last year's lows, while the four biggest Florida markets are now seeing new price lows since the housing downturn began."
Micro Market Analysis (Jan. 2002 - Dec. 2010)
Every month this section highlights a single market with a deeper dive into how the micro- and macro-markets relate to each other. View previously highlighted micro markets archived on the HDI Market Reports web page at www.clearcapital.com/company/market.cfm.
Denver Home Prices Outperform the Nation
- Denver home prices avoided the extreme run-up experienced nation-wide earlier this century.
- Having avoided the extremes of the recent housing bubble, home prices in Denver subsequently fell by much smaller margins (-29.9%) and have recovered more rapidly than the rest of the nation.
- Today, average home prices in Denver remain only 18.5 percent below its all-time peak experienced in August 2005. This is nearly half the national price change (-37% percent) since the peak.
The Denver Metropolitan Statistical Area (MSA) experienced a -5.2 percent quarterly price change, and remains 2.8 percent below their levels of one year ago. Denver's prices appear to closely follow national averages (-5.8% quarterly, -2.7% yearly, respectively). These similarities are misleading, however, as the rapid run up in the mile-high market dates back to the turn of century, compared to the 2006 peak experienced at the national level. Between 2003 and 2006 home prices in the Denver market grew only 1.4 percent, in stark contrast to the 40.0 percent national gains during the same period.
"There is not a rush for property located in Colorado which stabilizes our values," said Connie Kraska, real estate broker from Denver, CO. "Denver is stable, calm, inviting and desirable. The availability of jobs, affordability of housing, and location are keys to Denver's success."
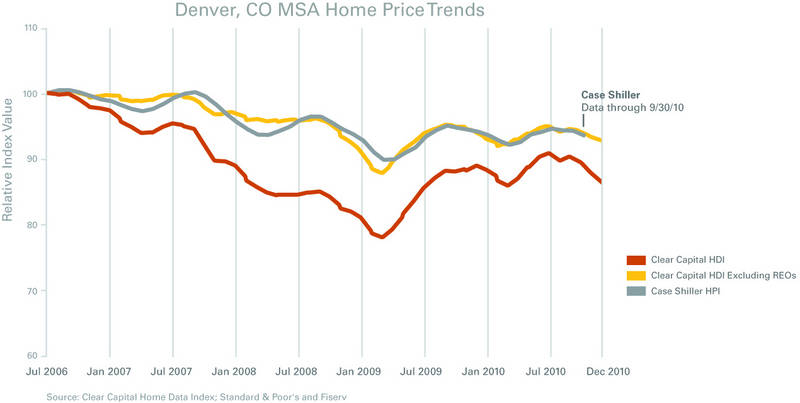
A Tale of Two Indexes
When measuring Denver data from the Clear Capital Home Data Index against that of the Case Shiller Home Price Index, some interesting conclusions can be drawn.
- In Denver, as in other markets across the nation, Case Shiller pricing trends tend to be more optimistic than Clear Capital's when distressed activity is an influential portion of the market.
- This Clear Capital HDI posted a further -4.8 percent price change in Denver home prices in the two months following the most recent Case Shiller Index released Sept. 30, 2010.
REO saturation in Denver currently stands at 26.0 percent of all sales, a sufficient proportion of activity to impact price trends. When Clear Capital's HDI is built without REO transactions, more moderated price declines are apparent. This more optimistic trend declined only 16.9 percent from peak in 2006 to the trough in 2009, a contrast to the 29.9 percent decline that exists when all sales are included. Similarly, Clear Capital's non-REO index for Denver shows prices changed -1.9 percent in the two months since the most recent Case Shiller Index release.
Including sales of both performing and non-performing (REO) properties provides a measure of market activity that's relevant to institutions managing distressed segments. All influences driving market pricing, including REO activity, are critical to understanding home pricing in Denver and across the nation.
Metro Markets (Nov. 2009 - Dec. 2010)
Mixed Results for Highest Performing Markets
- Honolulu, HI and Washington, D.C. hang on to quarterly and yearly price gains.
- Price declines shrink in six of the highest performing local markets.
- Orlando, FL reaches new price lows since the housing downturn began, despite making the highest performing markets list.
Most of the highest performing major markets experienced quarterly price declines, with Honolulu (2.4%) and Washington, D.C. (1.5%) being the exceptions. However, Pittsburgh PA; Fresno, CA; Orlando, FL; Birmingham, AL; Raleigh, NC; and Houston, TX all saw quarterly price declines lessen compared to last month's data. This moderation is an encouraging sign amidst a backdrop of overall bad news, as it indicates the rapid price declines experienced between August and October are beginning to slow in these markets.
Despite Orlando making the highest performing list, it is experiencing new low home prices since the housing downturn began. In addition, the three other largest Florida markets (Miami, Jacksonville and Tampa) are also experiencing record lows. Weakness in tourism, particularly in the gulf coast following the oil spill, and a stale condominium market all limited gains in early 2010.
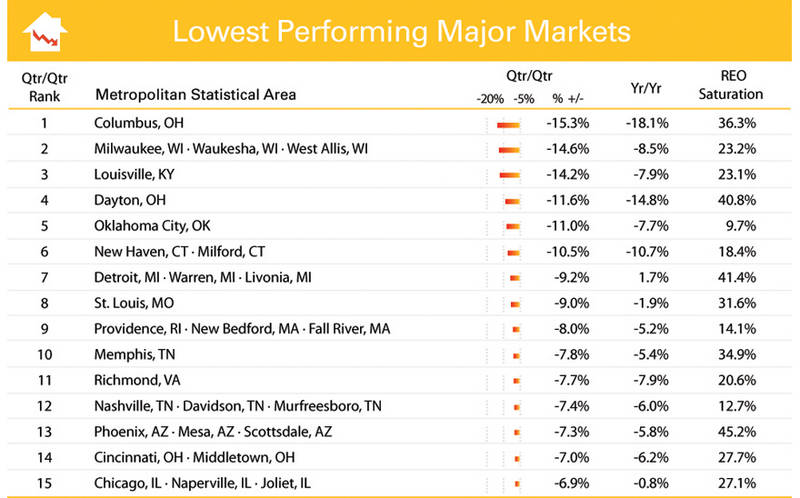
How Low Will They Go?
- The six lowest performing markets are experiencing double-digit quarterly losses.
- Twelve of the fifteen markets have yearly declines greater than five percent.
- Richmond, VA and Nashville, TN have entered double dip territory.
- Detroit, MI is the only market to experience positive yearly results, posting a 1.7% gain.
Compared to the highest performing markets list, where several of the markets saw declines slow compared to last month's report, many of the lowest performing markets saw their rates of price declines accelerate. This reinforces the importance of identifying local level market activity. Markets are increasingly reacting to current conditions individually, so generalizations of price trends at regional and national pricing levels can be misleading.
The markets of Richmond and Nashville entered double dip territory this month, with prices dropping 4.0 and 1.4 percent below their previous lows in early 2010 and early 2009, respectively. To incur a "double dip," prices would need to drop below their previous price lows experienced in 2009. The national average has seen home prices decline several times already since the market bottomed out in early 2009, yet current prices remain above this low point.
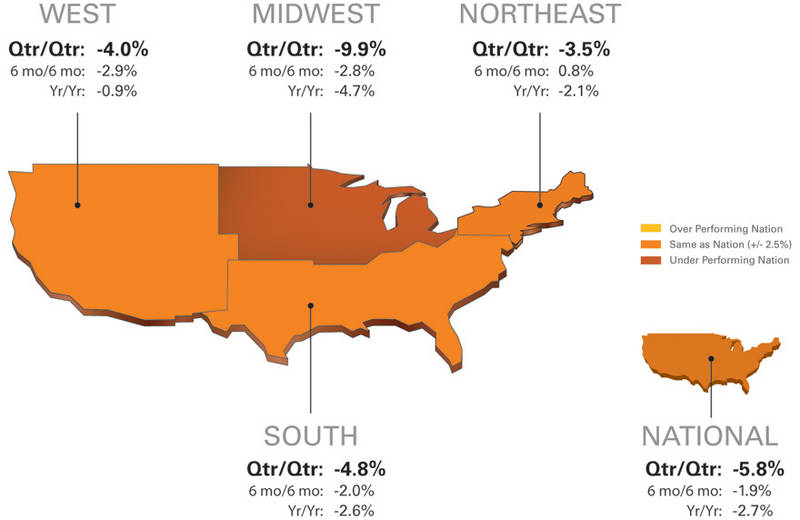
National/Four Region Market Overview (Nov. 2009 - Dec. 2010)
U.S. Home Price Declines Continue
- National home price declines decelerate, but show no sure signs of a bottom.
- National home prices remain 5.5 percent above record lows of early 2009.
- The Midwest region continued to lead quarterly price declines, posting near double-digit losses.
- The South region is the closest to setting new record lows, with prices just 2.3% above 2009 levels.
This month's -5.8 percent price change marks the third consecutive monthly report of national quarterly home price declines. With the price bubble created by the tax credits fully deflated, markets are affected by traditional economic conditions such as supply and demand, and the typically slower winter buying season. National prices remain 5.5 percent above the record lows of early 2009, but with an increasing number of local markets double dipping (setting new record lows) downward price pressure remains despite the slowing of declines for top performing areas.
The Midwest region continued its decline, dropping another 1.2 percentage points from last month's report to a -9.9 percent quarterly price change. The Columbus, OH and Milwaukee, WI micro markets lead the Midwest downward with -15.3 and -14.6 percent quarterly price changes respectively. The South region, which includes the underperforming Florida markets, has edged closer to new record lows. With prices only 2.3 percent above their 2009 levels and a quarter-over-quarter price change of -4.8 percent, the South region is getting closer to breaking through the double dip threshold.
A glimmer of good news: the -5.8 percent quarterly price change for the nation is only 0.8 percentage points lower than last month's report. Compared to a downward jump of 4.8 percentage points the month prior, this 0.8 point drop indicates the worst of this downward turn might have passed. Price trends from recent years indicate, however, winter price lows hang around through March, making it unlikely that there will be an end to these declines that started in August, until the second quarter of 2011 at the earliest.
About the Clear Capital Home Data Index (HDI) Market Report
The Clear Capital HDI Market Report has displayed consistent market trends as other leading indices (peak, trough, secondary trough and tax credit run-ups). Despite these consistencies, a critical difference is that HDI's methodology enables more timely and granular reporting. Clear Capital's ability to report today the significant drop in home prices, as well as the growing list of double dip markets, paints an ominous picture that will likely show up in other home data indices in the months to come.
The Clear Capital HDI Market Report:
- Offers the real estate industry (investors, lenders and servicers), government agencies and the public insight into the most recent pricing conditions, not only at the national and metropolitan level, but within local markets as well.
- Patent pending rolling quarter technology significantly reduces the multi-month lag time associated with other indices to help investors, loan servicers and individual buyers and sellers make more informed, timely and profitable decisions.
- Analysis is performed using the most recent data available from recorder/assessor offices, and then further enhanced by adding Clear Capital's proprietary market data for the most comprehensive geographic coverage and local insights available.
Clear Capital Home Data Index™ Methodology
- Generates the timeliest indices in patent pending rolling quarter intervals that compare the most recent four months to the previous three months. The rolling quarters have no fixed start date and can be used to generate indices as data flows in, significantly reducing the multi-month lag time experienced with other indices.
- Includes both fair market and institutional (real estate owned) transactions, giving equal weight to all market transactions and identifying price tiers at a market specific level. By giving equal weight to all transactions the HDI is truly representative of each unique market.
- An address-level cascade results in an index with the most granular, statistically significant market area available.
- Provides weighted repeat sales, and price-per-square-foot index models that use multiple sale types, including single-family homes, multi-family homes and condominiums.
About Clear Capital
Clear Capital (www.clearcapital.com) is a premium provider of data and solutions for real estate asset valuation and risk assessment for large financial services companies. Our products include appraisals, broker-price opinions, property condition inspections, value reconciliations, and home data indices. Clear Capital's combination of progressive technology, high caliber in-house staff and a well-trained network of more than 40,000 field experts sets a new standard for accurate, up-to-date and well documented valuation data and assessments. The Company's customers include the largest U.S. banks, investment firms and other financial organizations.
Legend
Address Level Cascade -- Provides the most granular market data available. From the subject property, progressively steps out from the smallest market to larger markets until data density and statistical confidence are sufficient to return a market trend.
Home Data Index (HDI) -- Powerful analytics tool that provides contextual data augmenting other, human-based valuation tools. Clear Capital's multi-model approach combines address-level accuracy with the most current proprietary home pricing data available.
Metropolitan Statistical Area (MSA) -- Geographic entities defined by the U.S. Office of Management and Budget (OMB) for use by Federal statistical agencies in collecting, tabulating, and publishing Federal statistics.
Repeat Sales Model -- Weighted linear model based on repeat sales of same property over time.
Price Per Square Foot (PPSF) Model -- Median price movement of sale prices divided by square footage over a period of time -- most commonly a quarter.
Real Estate Owned (REO) Saturation -- Calculates the percentage of REOs sold as compared to all properties sold in the last rolling quarter.
Rolling Quarters -- Patent pending rolling quarters compare the most recent four months to the previous three months.
The information contained in this report is based on sources that are deemed to be reliable; however no representation or warranty is made as to the accuracy, completeness, or fitness for any particular purpose of any information contained herein. This report is not intended as investment advice, and should not be viewed as any guarantee of value, condition, or other attribute.
Contact Information:
Media Contact:
Michelle Sabolich
Atomic PR for Clear Capital
415.593.1400