TRUCKEE, CA--(Marketwire - February 3, 2011) - Clear Capital (www.clearcapital.com) released its monthly Home Data Index™ (HDI) Market Report, and reports a quarter-over-quarter national price change of -1.6 percent. Despite the negative quarterly price change, the national index has demonstrated a positive trend since the start of 2011.
The HDI Market Report provides the most current (through January 2011), granular and relevant analysis of how local markets performed compared to the national trend in home prices. Clear Capital's latest release of its Home Data Index shows that U.S. home prices stopped declining in early January and have posted their first uptick since mid-August 2010.
"This recent national change in price direction is encouraging for the overall housing sector, yet it is still too early to determine whether this current uptick in home prices is a temporary reprieve or the start of a sustained recovery," said Dr. Alex Villacorta, senior statistician at Clear Capital. "This uptick is the first non-incentivized change in prices we've seen since the downturn began, and could provide great opportunity for buyers, sellers and investors alike. Although many markets still remain under significant downward pressure in light of increased distressed sale activities, it is clear that the severity of the downturns observed in October and November have subsided."
Turning of the Tide: Signs of upturn in U.S. home prices
Using sale transactions up through January, the HDI shows national home prices have turned the corner on their most recent decline. This change toward the positive for home prices is the first since mid-August, and signals the end of the pronounced price declines first observed by Clear Capital back in October and reported on more recently by the S&P/Case-Shiller 20 index as well as FHFA's non-seasonally adjusted national index. Furthermore, this observed change in prices is especially meaningful as the first months of the year are typically affected by the seasonal slowdown in sales activity, suggesting that buyer demand may be returning in anticipation of a potential start to a sustained recovery.
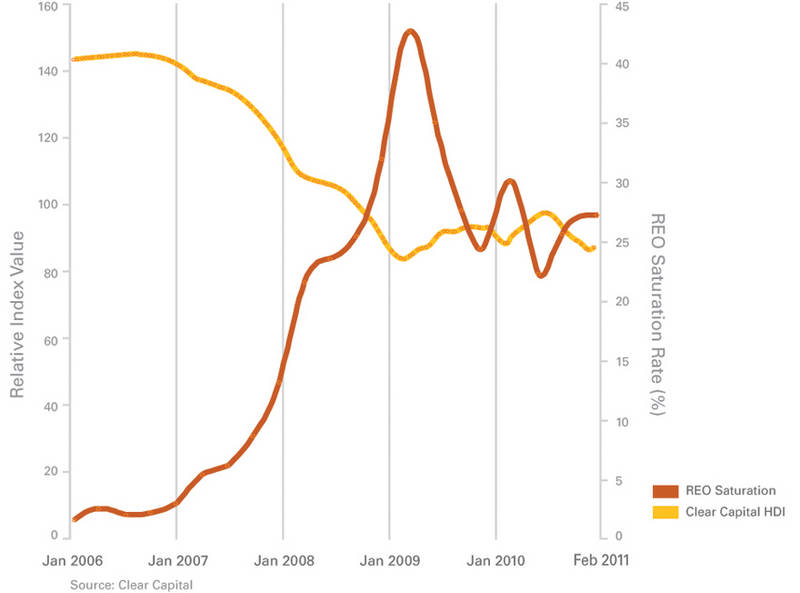
One primary driver that may explain the cause for the increase in prices is the slowing of the rate of sale of real estate owned (REO) properties.
REO Saturation Negatively Correlated to Clear Capital HDI
Illustrated in the graph above, every spike in REO saturation (REO saturation calculates the percentage of real estate owned properties sold as compared to all properties sold in the last rolling quarter) has corresponded with a decline in home prices, and vice versa. The most recent rolling quarter for REO saturation has slowed considerably after gaining 3.2 percent during Q3 2010, with national REO rates only climbing 1.4 percent. A decrease in REO saturation indicates that an increasing proportion of fair market transactions are occurring, and as the level of distressed transactions decrease, prices tend to increase since the overall market value for an area is less affected by distressed comparable sales. If this observed negative correlation persists, a leveling off of the national REO saturation rate could indicate that home prices are poised for further gains well ahead of the seasonal spring lift.
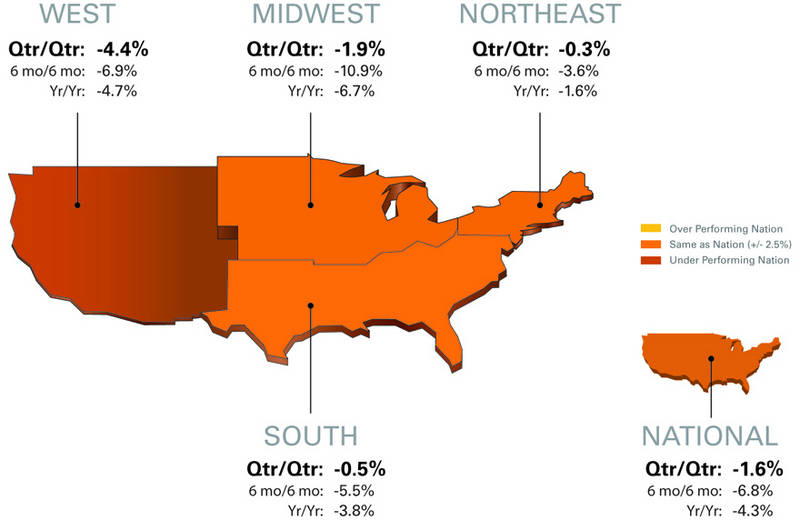
National/Four Region Market Overview (Jan. 2010 - Feb. 2011)
Prices Experience Positive Start to 2011
- Since Jan. 1, 2011, national home prices have experienced the first positive gains since mid-August 2010 (0.9% in the first three weeks of 2011).
- National quarterly decline of 1.6 percent is a significant improvement from November's quarterly decline of 5.8 percent, further indicating a halting of price drops.
- The year-over-year national decline continued downward, but only marginally, with the yearly price change reaching -4.3 percent through January, down from the -4.1 percent reported last month.
National home price declines reversed their downward trend this month, with the current rolling quarter-over-quarter declines (-1.6% price change) leveling off near zero. All regions except the West experienced flattening quarterly price changes. The South and the Northeast posted effectively unchanged quarterly price movements, while the Midwest quarterly price changes have improved 8.0 percentage points since the Dec. 9, 2010 report.
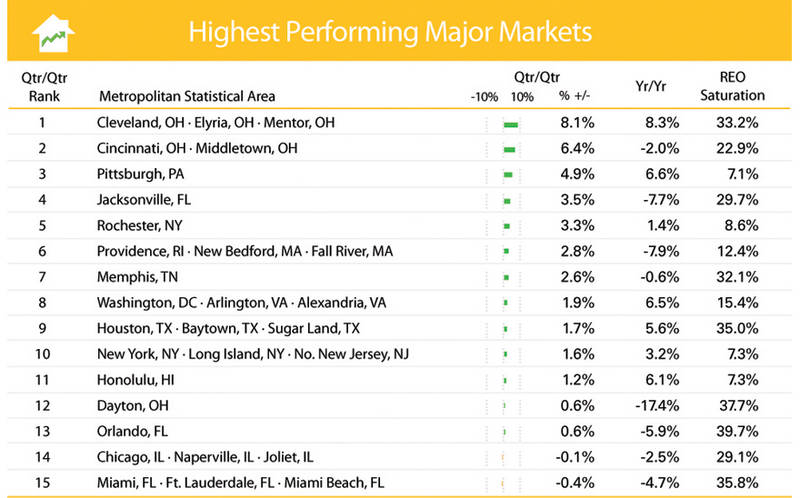
Metro Markets (Jan. 2010 - Feb. 2011)
Positive Near-term Result
- Marked improvement in near-term price changes with 13 of 15 markets posting positive quarter-over-quarter results.
- Four local MSAs experienced quarterly improvements of more than six percent compared to last month's report.
- The Honolulu, HI MSA was the only market on the list to experience reduced quarterly gains over last month's report.
Major markets in the U.S. are showing early signs of coming out of winter hibernation. Thirteen of the highest performing markets posted positive quarterly gains. Four MSAs posted large quarterly gains as compared to last month's report -- Cleveland (12.6) and Dayton (9.6), Ohio; along with Houston (6.8), and Chicago (6.3); experienced the biggest quarterly percentage point improvements.
Cleveland's improvement can be attributed to a softening of the local foreclosure market and median home prices in Cleveland are less than $100,000. This implies that even moderate fluctuations -- like an $8,000 swing -- can translate into considerable percentage changes for this area. Further, Cleveland home prices are still down more than 55 percent from its market peak in 2006, demonstrating the magnitude of how far this troubled housing market has fallen during the last five years.
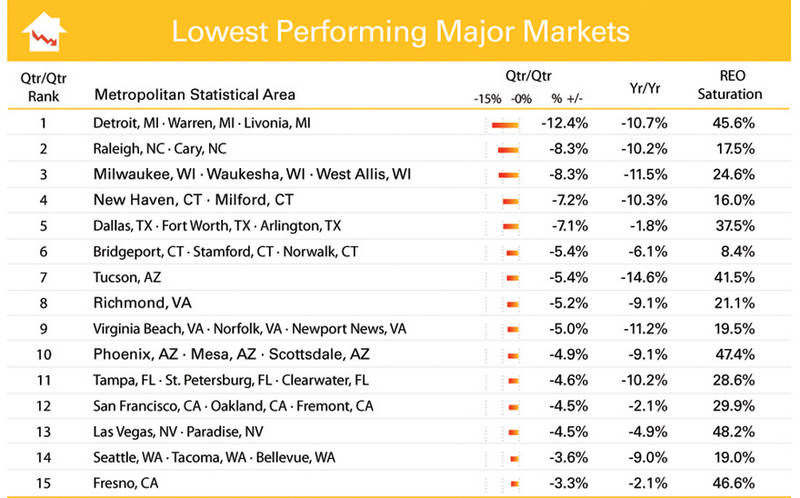
Today's Lows, Not so Low:
- Markets show signs of improvement; only the Detroit MSA experienced double-digit price declines
- Three-fifths of the lowest performing markets saw improved quarter-over-quarter results over last month.
In a clear sign of overall market improvement many of the lowest performing markets saw their quarterly rates of decline decelerate in this month's report. Nine of the fifteen markets listed above experienced improved quarterly results over last month's report. The price changes of these markets continue to flatten with the average quarterly decline less than 6.0 percent through January 2011. That's down from 8.3 percent last month (through December 2010), and 9.8 percent through November 2010.
Only Detroit, MI; Fresno, CA; Las Vegas, NV; Raleigh, NC; San Francisco, CA; and Tampa, FL experienced larger quarterly price declines over last month. Detroit's -12.4 percent quarterly price change is up 2.7 percentage points from the end of December as the MSA continues to be dogged by high levels of distressed housing activity and a troubled economic environment with double digit unemployment throughout the state.
About the Clear Capital Home Data Index (HDI) Market Report
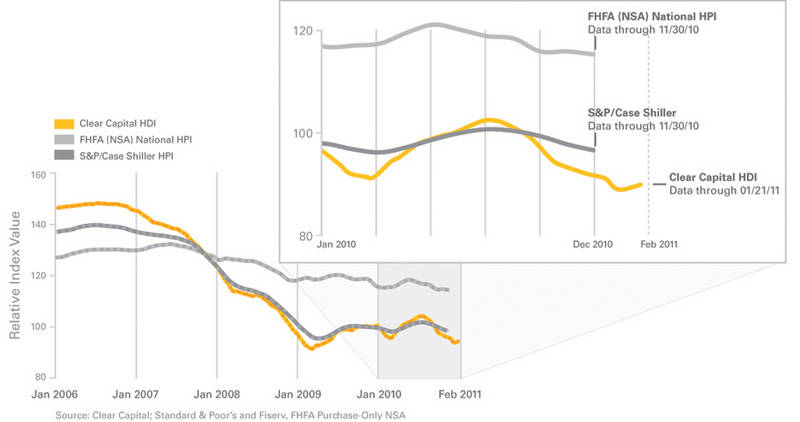
The Clear Capital HDI Market Report has displayed consistent market trends as other leading indices (peak, trough, secondary trough and tax credit run-ups). Despite these consistencies, a critical difference is that HDI's methodology enables more timely and granular reporting.
The Clear Capital HDI Market Report:
- Offers the real estate industry (investors, lenders and servicers), government agencies and the public insight into the most recent pricing conditions, not only at the national and metropolitan level, but within local markets as well.
- Data is built on the most recent information available from recorder/assessor offices, and then further enhanced by adding the company's proprietary streaming market data for the most comprehensive geographic coverage and local insights available.
- Reflects nationwide coverage of sales transactions and aggregates this comprehensive dataset at ten different geographic levels, including hundreds of metropolitan statistical areas (MSAs) and sub-ZIP code boundaries.
- Includes equally-weighted distressed bank owned sales (REOs) from around the country to give the most real world look of pricing dynamics across all sales types.
- Patent-pending rolling quarter technology allows for the most current market data by providing more frequent updates. This ensures decisions are based on the most up-to-date information available.
Clear Capital Home Data Index™ Methodology
- Generates the timeliest indices in patent pending rolling quarter intervals that compare the most recent four months to the previous three months. The rolling quarters have no fixed start date and can be used to generate indices as data flows in, significantly reducing the multi-month lag time experienced with other indices.
- Includes both fair market and institutional (real estate owned) transactions, giving equal weight to all market transactions and identifying price tiers at a market specific level. By giving equal weight to all transactions the HDI is truly representative of each unique market.
- An address-level cascade results in an index with the most granular, statistically significant market area available.
- Provides weighted repeat sales, and price-per-square-foot index models that use multiple sale types, including single-family homes, multi-family homes and condominiums.
About Clear Capital
Clear Capital (www.clearcapital.com) is a premium provider of data and solutions for real estate asset valuation and risk assessment for large financial services companies. Our products include appraisals, broker-price opinions, property condition inspections, value reconciliations, and home data indices. Clear Capital's combination of progressive technology, high caliber in-house staff and a well-trained network of more than 40,000 field experts sets a new standard for accurate, up-to-date and well documented valuation data and assessments. The Company's customers include 75 percent of the largest U.S. banks, investment firms and other financial organizations.
Legend
Address Level Cascade -- Provides the most granular market data available. From the subject property, progressively steps out from the smallest market to larger markets until data density and statistical confidence are sufficient to return a market trend.
Home Data Index (HDI) -- Powerful analytics tool that provides contextual data augmenting other, human-based valuation tools. Clear Capital's multi-model approach combines address-level accuracy with the most current proprietary home pricing data available.
Metropolitan Statistical Area (MSA) -- Geographic entities defined by the U.S. Office of Management and Budget (OMB) for use by Federal statistical agencies in collecting, tabulating, and publishing Federal statistics.
Repeat Sales Model -- Weighted linear model based on repeat sales of same property over time.
Price Per Square Foot (PPSF) Model -- Median price movement of sale prices divided by square footage over a period of time -- most commonly a quarter.
Real Estate Owned (REO) Saturation -- Calculates the percentage of REOs sold as compared to all properties sold in the last rolling quarter.
Rolling Quarters -- Patent pending rolling quarters compare the most recent four months to the previous three months.
The information contained in this report is based on sources that are deemed to be reliable; however no representation or warranty is made as to the accuracy, completeness, or fitness for any particular purpose of any information contained herein. This report is not intended as investment advice, and should not be viewed as any guarantee of value, condition, or other attribute.
Contact Information:
Media Contact:
Michelle Sabolich
Atomic PR for Clear Capital
415.593.1400