TRUCKEE, CA--(Marketwire - July 8, 2010) - Clear Capital (www.clearcapital.com), a premium provider of data and solutions for real estate asset valuation, investment and risk assessment, today released its Home Data Index™ (HDI) Market Report. Patent pending rolling quarter technology significantly reduces the multi-month lag time associated with other indices to help investors, loan servicers and individual buyers and sellers make more informed, timely and profitable decisions.
Report highlights include:
-
National / Four Region Overview: Across the U.S., home prices posted 5.2% quarter-over-quarter gains, placing prices firmly 8.8% above levels experienced one year ago. Regionally, the Midwest and South saw the largest quarterly price growth, while the West and Northeast show more stable quarterly gains.
-
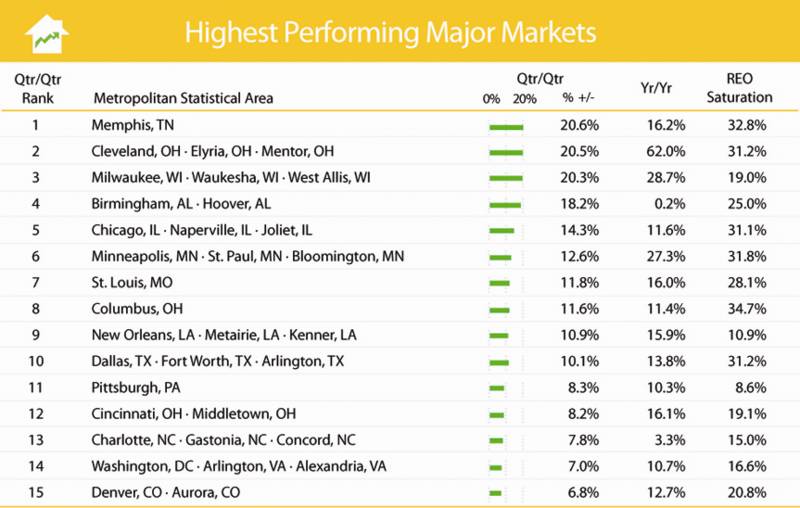
Metropolitan Statistical Area (MSA) drilldown: Home price gains across the U.S. were helped largely by the quarterly jump in prices by the top 15 highest performing major markets. Quarterly prices for the group are up an average 12.6%, while yearly price gains are up 17.1%.
-
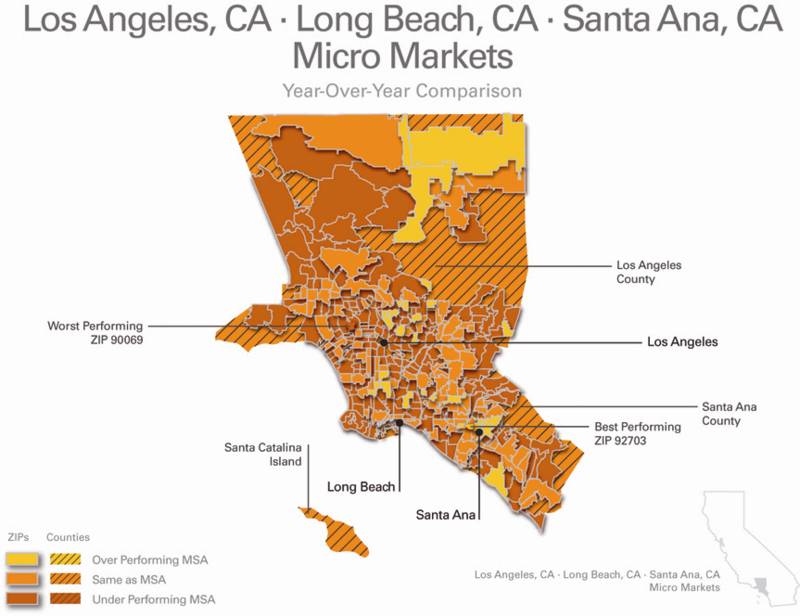
Micro Market Analysis: Home prices in the Los Angeles MSA rebounded 13.2% from its market bottom one year ago. While this surpassed the 8.8% gains seen nationally for the same period, conditions varied widely across this large and diverse market.
The Clear Capital HDI Market Report offers the industry, investors and lenders a timely look at pricing conditions, not only at the national and metropolitan level, but within local markets as well. Clear Capital data is built on the most recent data available from recorder/assessor offices, and then further enhanced by adding the Company's proprietary market data for the most comprehensive geographic coverage available.
"Price trends nationwide have seen a considerable upswing driven in large part by the flurry of recent sales attributed to the tax credit and springtime buying activity," said Dr. Alex Villacorta, Senior Statistician, Clear Capital. "This month's national quarterly gains are certainly a positive sign that many markets have responded to the tax credit incentive, but overall markets remain volatile as evidenced by the six month price change keeping mostly flat."
"Metro level markets are showing recent signs of healthy price growth, yet many of these markets are simply returning to their pre-winter levels, and some of the hardest hit areas remain as much as 54 percent below their 2006 peaks," added Dr. Villacorta. "While there is still a lot of ground to be made up, the 8.8 percent yearly gain is a strong lift off of the severe lows of last year, especially when you consider in the same time period unemployment and REO saturation levels hit their highest point in more than two decades."
National/Four Region Market Overview (June 2009 - June 2010)
Home prices across the nation made strong moves in a positive direction. Thanks to an increase in springtime sales and the continued residual effects of the federal housing home buyer tax credits, all four regions posted positive gains. Across the U.S., home prices rose 5.2 percent this quarter, bringing the nation back to within one percent of last fall's levels and placing prices firmly 8.8 percent above levels of a year ago. Regionally, the Midwest and South saw the largest quarterly price growth, while the West and Northeast show more stable quarterly gains.
The Midwest continued to lead the nation with quarterly price gains of 9.2 percent, pushing year-over-year gains to 17.2 percent off the deep lows of last year. The other three regions experienced yearly prices more consistent to the national year-over-year average (8.8%). Despite strong quarterly gains, all four regions remained within two percent of the levels achieved last fall, revealing the price volatility that was experienced this past winter.
As a whole, the REO saturation rate was reduced to 24.6 percent, a decline of 3.2 percentage points from what was reported last month. It's likely the effects of the April tax credit have been amplified with the onset of the springtime buying season, and while some have questioned the timing of this credit with concern about the downstream effects on demand, it's evident that the tax credit did succeed, at least in the near-term, in creating an environment more resilient to the ongoing foreclosure influences.
Metro Markets (June 2009 - June 2010)
The overall home price gains across the U.S. were aided largely by the quarterly jump in prices by the top 15 highest performing major markets. Last month's single digit price gains signaled the onset of these conditions, and have been replaced with double digit quarterly gains among the top ten markets. After the winter drop in home prices, the timing of the tax credit has added another leg to the price volatility experienced in recent years. However, with quarterly prices for the group up 12.6 percent and yearly price gains up 17.1 percent on average, the volatility is in the positive direction which has helped absorb some of the burden on the market maintained through the presence of distressed sales.
The larger markets of the West have remained more stable, falling off the highest performing market list as they exhibit smaller increases than the more volatile markets of the South and Midwest. This is apparent in Memphis, Tenn. and Cleveland, Ohio, which jumped into the number one and two ranked positions, respectively.
While the seasonal timing and incentivized price swings have played into the substantial quarterly price increases of these markets, it's important to measure the broader recovery of these markets by looking at longer time periods, as well as isolate the influence of the REO segment. In Cleveland, current home prices are still 54.6 percent below its market peak in 2005. While this is a very steep decline, it's actually recovered 21.3 percentage points compared to the peak of its decline (-75.9% price change) in early 2009. Further, if you remove REO sales from the equation, the quarterly price growth of the non-REO segment in Cleveland still stands at 8.5 percent, a substantial gain but far below the 20.5 percent combined number used in this month's rankings.
Similarly, Memphis' quarterly price gain of 20.6 percent leaves prices 1.9 percent below their levels of the fall of 2009. Prices in Memphis have dropped 51.1 percent from the market peak in late 2005 to trough in 2009, and have recovered 11.8 percentage points, now only down 39.3 percent from the peak of the market. With a quarterly price increase of 5.8 percent for the non-REO market, it further highlights the gains found among the distressed segment.
Nearly all the lowest performing major markets saw quarterly prices swing from the negative to the positive compared to quarterly numbers reported last month. Bolstered largely by markets in the East and West regions, quarterly gains among these fifteen markets averaged 1.5 percent while yearly gains averaged 6.0 percent. All markets except Honolulu, Hawaii, saw REO saturation rates decline, leaving a group average saturation rate of 26.3 percent.
Only two markets, Baltimore, Md. and Orlando, Fla. saw prices remain below their levels of a year ago. However, both markets did manage to edge closer to positive year-over-year territory when compared to last month's reported numbers. Honolulu and the California markets of San Diego, Riverside, and Fresno saw stable quarterly price gains, with each market's quarterly growth rate varying by less than one percentage point compared to last month's report.
As recently as last month, many of these markets were on the highest performing list, a reflection of their relative stability compared to many of the current highest performing major markets.
Micro Markets (June 2009 - June 2010)
This section highlights a single market every month with a deeper dive into how the micro- and macro-markets relate to each other.
Home prices in the Los Angeles Metropolitan Statistical Area (MSA) rebounded 13.2 percent from its market bottom one year ago. While this surpassed the 8.8 percent gains seen at the national level for the same period, conditions varied widely across this large and diverse market. At more local levels, some markets saw prices outperform the metro-level numbers, while other markets have underperformed both the metro and national gains. These micro market trends are informative, revealing differences in the buyer base of each market.
With recent demand focused on lower-priced and distressed properties, an area in western Santa Ana (ZIP code 92703) outpaced the rest of the Los Angeles MSA by returning a 29.5 percent gain for the past year. With an REO saturation rate that peaked above 70 percent in 2008, and a property mix of lower-priced single family, condominiums and manufactured housing, this micro market has proved volatile both on the decline (losing 52.2% since peak) and recent recovery. As REO saturation rates declined into the 30 percent range over the last year, the rapid consumption of discounted foreclosures is evident, and indicates the influx of first-time home buyers and investors.
One segment of West Hollywood (ZIP code 90069), an area of high-priced single family homes and condominium units, has seen a -13.7 percent price change over the past year -- the worst in the Los Angeles MSA. With few high-end buyers and little incentive to purchase higher priced homes, this normally attractive area has struggled to find a pricing bottom. Price changes of -32.9 percent since market peak (the current year-over-year dip leaves it at its lowest point since 2006), indicates this market is suffering from the slow economic recovery; a contrast to the steep declines and sudden upward bounce of some markets as they feel the impact of incentives and speculative buying.
Clear Capital Home Data Index™ Methodology
The Clear Capital Home Data Index (HDI) provides weighted repeat sales, and price-per-square-foot index models that use multiple sale types, including single-family homes, multi-family homes and condominiums. These models are combined with an address-level cascade to provide sale-type-specific analysis for thousands of geographic areas across the country. The indices include both fair market and institutional (real estate owned) transactions. They also provide indicators of REO activity such as REO discount rates, REO days on market and REO saturation. The Clear Capital HDI generates indices in patent pending rolling quarter intervals that compare the most recent four months to the previous three months. The rolling quarters have no fixed start date and can be used to generate indices as data flows in, or at any arbitrary time period.
About Clear Capital
Clear Capital (www.clearcapital.com) is a premium provider of data and solutions for real estate asset valuation and risk assessment for large financial services companies. Our products include appraisals, broker-price opinions, property condition inspections, value reconciliations, and home data indices. Clear Capital's combination of progressive technology, high caliber in-house staff and a well-trained network of more than 40,000 field experts sets a new standard for accurate, up-to-date and well documented valuation data and assessments. The Company's customers include 75 percent of the largest U.S. banks, investment firms and other financial organizations.
Legend
Address Level Cascade -- Provides the most granular market data available. From the subject property, progressively steps out from the smallest market to larger markets until data density and statistical confidence are sufficient to return a market trend.
Home Data Index (HDI) -- Major intelligence offering that provides contextual data augmenting other, human-based valuation tools. Clear Capital's multi-model approach combines address-level accuracy with the most current proprietary home pricing data available.
Metropolitan Statistical Area (MSA) -- Geographic entities defined by the U.S. Office of Management and Budget (OMB) for use by Federal statistical agencies in collecting, tabulating, and publishing Federal statistics.
Repeat Sales Model -- Weighted linear model based on repeat sales of same property over time.
Price Per Square Foot (PPSF) Model -- Median price movement of sale prices divided by square footage over a period of time -- most commonly a quarter.
Real Estate Owned (REO) Saturation -- Calculates the percentage of REOs sold as compared to all properties sold in the last rolling quarter.
Rolling Quarters -- Patent pending rolling quarters compare the most recent four months to the previous three months.
The information contained in this report is based on sources that are deemed to be reliable; however no representation or warranty is made as to the accuracy, completeness, or fitness for any particular purpose of any information contained herein. This report is not intended as investment advice, and should not be viewed as any guarantee of value, condition, or other attribute.
Contact Information:
Media Contact:
Michelle Sabolich
Atomic PR for Clear Capital
415.593.1400