TRUCKEE, CA--(Marketwire - April 7, 2011) - Clear Capital (www.clearcapital.com) today released its monthly Home Data Index™ (HDI) Market Report, and reports a national quarter-over-quarter price change of -1.3 percent. The HDI Market Report provides the most current (through March 2011), granular and relevant analysis of how local markets performed compared to the national trend in home prices.
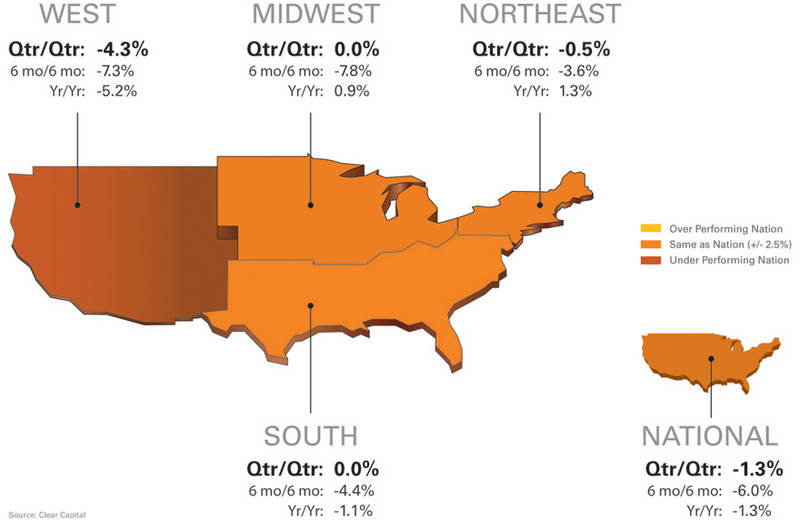
Clear Capital's latest HDI report shows that although the West region continues to slide this quarter (-4.3%) and has reached double dip territory, U.S. home prices are flat across most the nation.
"The latest data through March supports our view that many markets are continuing to see relief from the significant price declines we observed through January," said Dr. Alex Villacorta, director of research and analytics at Clear Capital. "While some markets are already in double dip territory, specifically in the West, widespread fear of a collective fall in market prices is overstated."
"Looking deeper at the disparity between the West and the other regions, we find that the rate of change in REO saturation continues to serve as a leading indicator of home prices," said Villacorta. "For example, out of all the regions, only the West showed acceleration in its REO saturation from the previous quarter."
Prices Flattening Across the Nation
Relief is being felt for most of the country as the rapid declines observed at the end of 2010 have essentially halted. In the Midwest, Northeast and South regions, the price declines currently being reported elsewhere date back to the October 2010 through January 2011 period and reflect a post tax-credit reset reminiscent of early 2010. Those declines are out-of-date and do not accurately represent current home price trends.
Data through March 2011 in the Midwest, South and Northeast regions is encouraging as home prices have managed to find a bottom in the midst of ongoing foreclosure pressures and the traditionally slow winter season. Home prices in the Northeast, Midwest and South regions, as well as the nation as a whole have reset at a level more aligned with the first tax credit correction, rather than the market bottom experienced early in 2009. In the absence of tax credit incentives, the most recent gains are largely based on improvements in REO saturation and unemployment fundamentals, helping this latest price stabilization.
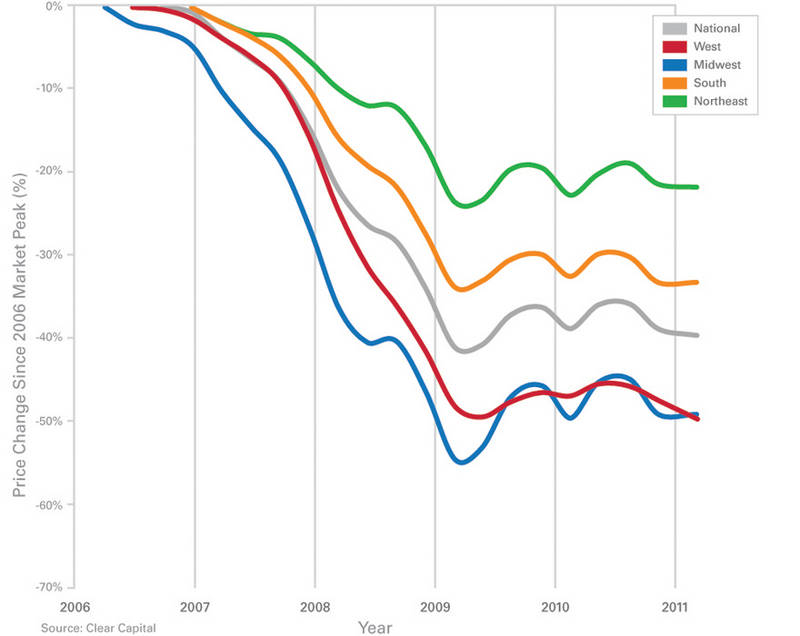
Concern over the continued fall in prices in many Western markets is founded. This region continues to struggle and has experienced an extended decline in home values since reaching its most recent high mark in the summer of 2010. The consistency of these declines in the West not only have pushed prices to a post peak low (double dip), but show no sign of stabilizing. Looking ahead, should the traditional spring and summer buying seasons prove substantial, home prices at the national level could reach positive quarterly gains before the end of 2011. Distressed activity, however, remains high and should void gains in the West.
West Continues Slide While Rest of Nation Flat
- West region underperforms as prices reach their lowest level since 2001
- South, Midwest and Northeast hold steady despite a cold winter buying season
- National -1.3% quarter-over-quarter price change is the best mark in six months (National quarterly gain of 0.2% was reported on Oct. 7, 2010)
The West region broke through its prior 2009 low point, becoming the first region to double dip. This places home prices in the West at their lowest point since 2001 and reflects the continuing price declines among most key markets in this region. This underperformance in home prices reflects the extent distressed activity plays in western markets. Recently, distressed activity as a proportion of total sales has climbed nearly 10 percent since the second quarter of 2010, and now stands at 40.8 percent of sales. This increase broke an 18-month stretch of improvement, where REO saturation fell from a peak of 54 percent in early 2009 to a low of 30.4 percent last summer. Offsetting some of the struggles in the West, the Midwest, South and Northeast saw little price change from the late fall of 2010 through winter of 2011. Stable home prices amid the long and cold winter (not typically favorable to home buying) is a positive sign, indicating price levels are appealing to a base of buyers and pressures haven't been sufficient to force further price reductions on behalf of sellers.
Northeast, South Markets Making the Most Gains
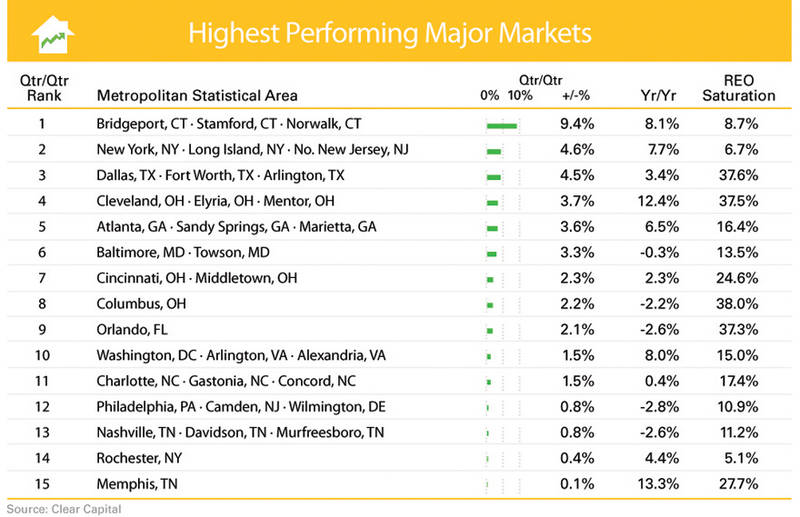
- Led by Bridgeport, CT; this month's listed featured predominantly markets in the South and Northeast regions.
- All the highest performing markets experienced positive quarter-over-quarter gains for the first time six months.
- Overall, year-over-year price gains improved with 10 markets posting positive gains.
Markets in the South and Northeast regions dominated this month's quarter-over-quarter price gains, taking up 12 of the 15 spots on the list. The only markets outside these regions to make the list were the Ohio markets of Cleveland, Cincinnati, and Columbus.
Home prices improved when viewed from a longer timeframe as well. Only Baltimore, MD (-0.3%); Columbus, OH (-2.2%); Orlando, FL (-2.6%); Philadelphia, PA (-2.8%); and Nashville, TN (-2.6%) experienced year-over-year home price declines. It's also worth noting that even though some markets still experienced high REO saturation rates approaching 40 percent, the average rate for the group was a more moderate 20.5 percent.
West, Midwest Markets Struggle
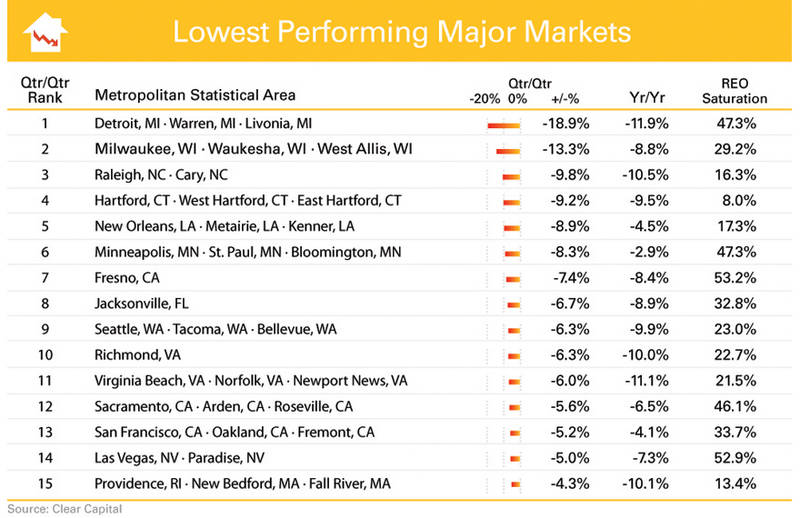
- Eight of the lowest performing markets were from the West and Midwest regions.
- For the third consecutive month, Detroit, MI experienced the largest quarterly declines.
- REO saturation remained elevated in the five hardest hit West markets, averaging 41.8%
Though quarterly home prices are flattening from a national perspective, many markets are still in decline. Eleven of the 15 markets on this month's lowest performing list had quarterly prices deteriorate from last month's report. Of the four that didn't get worse, Virginia Beach, VA, and Las Vegas, NV, maintained their declines from last month; while only Raleigh, NC; and Fresno, CA; saw their quarter-over-quarter declines shrink. Detroit, MI remains the hardest hit market -- its quarterly home price change reaching -18.9 percent, dropping 5.6 percent since last month's report.
REO saturation remains elevated across these markets, averaging 41.8 percent in the five hardest hit Western markets, and 25.6 percent across the South, Midwest and Northeastern markets represented on this list. Minneapolis, MN saw the largest increase in REO saturation, jumping 6.4 percent over last month's report.
About the Clear Capital Home Data Index (HDI) Market Report
The Clear Capital HDI Market Report has displayed consistent market trends as other leading indices (peak, trough, secondary trough and tax credit run-ups). Despite these consistencies, a critical difference is that HDI's methodology enables more timely and granular reporting.
The Clear Capital HDI Market Report:
- Offers the real estate industry (investors, lenders and servicers), government agencies and the public insight into the most recent pricing conditions, not only at the national and metropolitan level, but within local markets as well.
- Data is built on the most recent information available from recorder/assessor offices, and then further enhanced by adding the company's proprietary streaming market data for the most comprehensive geographic coverage and local insights available.
- Reflects nationwide coverage of sales transactions and aggregates this comprehensive dataset at ten different geographic levels, including hundreds of metropolitan statistical areas (MSAs) and sub-ZIP code boundaries.
- Includes equally-weighted distressed bank owned sales (REOs) from around the country to give the most real world look of pricing dynamics across all sales types.
- Patent-pending rolling quarter technology allows for the most current market data by providing more frequent updates. This ensures decisions are based on the most up-to-date information available.
Clear Capital Home Data Index™ Methodology
- Generates the timeliest indices in patent pending rolling quarter intervals that compare the most recent four months to the previous three months. The rolling quarters have no fixed start date and can be used to generate indices as data flows in, significantly reducing the multi-month lag time experienced with other indices.
- Includes both fair market and institutional (real estate owned) transactions, giving equal weight to all market transactions and identifying price tiers at a market specific level. By giving equal weight to all transactions the HDI is truly representative of each unique market.
- An address-level cascade results in an index with the most granular, statistically significant market area available.
- Provides weighted repeat sales, and price-per-square-foot index models that use multiple sale types, including single-family homes, multi-family homes and condominiums.
About Clear Capital
Clear Capital (www.clearcapital.com) is a premium provider of data and solutions for real estate asset valuation and risk assessment for large financial services companies. Our products include appraisals, broker-price opinions, property condition inspections, value reconciliations, and home data indices. Clear Capital's combination of progressive technology, high caliber in-house staff and a well-trained network of more than 40,000 field experts sets a new standard for accurate, up-to-date and well documented valuation data and assessments. The Company's customers include the largest U.S. banks, investment firms and other financial organizations.
Legend
Address Level Cascade - Provides the most granular market data available. From the subject property, progressively steps out from the smallest market to larger markets until data density and statistical confidence are sufficient to return a market trend.
Home Data Index (HDI) - Powerful analytics tool that provides contextual data augmenting other, human-based valuation tools. Clear Capital's multi-model approach combines address-level accuracy with the most current proprietary home pricing data available.
Metropolitan Statistical Area (MSA) - Geographic entities defined by the U.S. Office of Management and Budget (OMB) for use by Federal statistical agencies in collecting, tabulating, and publishing Federal statistics.
Repeat Sales Model - Weighted linear model based on repeat sales of same property over time.
Price Per Square Foot (PPSF) Model - Median price movement of sale prices divided by square footage over a period of time -- most commonly a quarter.
Real Estate Owned (REO) Saturation - Calculates the percentage of REOs sold as compared to all properties sold in the last rolling quarter.
Rolling Quarters - Patent pending rolling quarters compare the most recent four months to the previous three months.
The information contained in this report is based on sources that are deemed to be reliable; however no representation or warranty is made as to the accuracy, completeness, or fitness for any particular purpose of any information contained herein. This report is not intended as investment advice, and should not be viewed as any guarantee of value, condition, or other attribute.
Contact Information:
Media Contact:
Michelle Sabolich
Atomic PR for Clear Capital
415.593.1400