TRUCKEE, CA--(Marketwire - Jul 8, 2011) - Clear Capital (www.clearcapital.com) released its monthly Home Data Index™ (HDI) Market Report, showing U.S. home prices have decreased by 3.2 percent in the first six months of 2011 despite news of a second quarter uptick in home prices, and are forecast to stumble another 2.4 percent in the second half of 2011. This month's HDI Market Report provides the highest levels of current data (through June 2011), and relevant analysis of how local markets perform compared to trend data at the national level.
Report highlights include:
-
The U.S. quarterly home price gain of 0.9% in Q2 after nine months of decline provides encouragement against current economic and foreclosure trends.
-
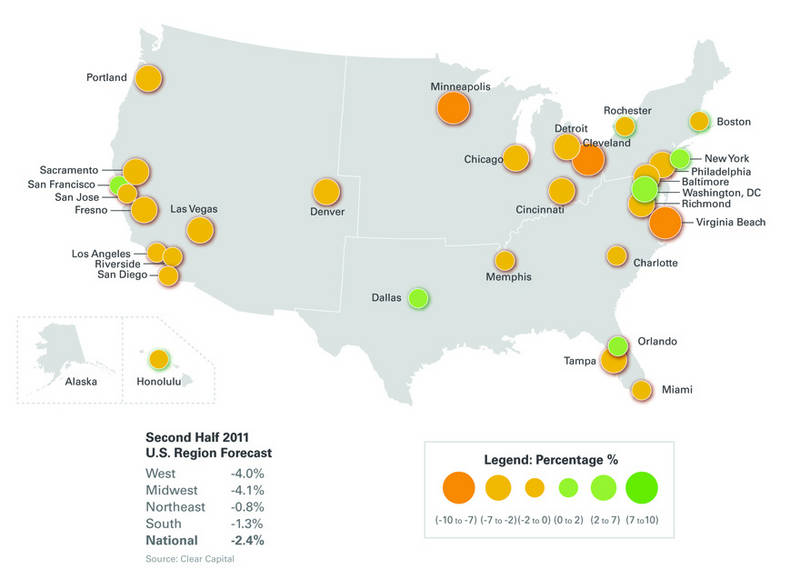
The Midwest was particularly hard hit in the first half of 2011, with prices in Detroit for example falling nearly 20% ($12,000 dollars on average of a typical $62,500 home).
-
Halfway through 2011, the U.S. REO saturation rate remains at 31.4%, compared to the 33.1% reported at the end of Q1. This number, while historically very high, is clearly trending slightly downward with absorption of REO property.
-
Only five U.S. markets are forecast to produce home price gains in the second half of 2011 including: Washington, D.C., New York, Orlando, Dallas, and San Francisco.
"At the mid-point of the year, it's promising to see the overall market shake off the string of declines observed since late last year, especially in light of significant challenges for the industry," said Dr. Alex Villacorta, director of research and analytics at Clear Capital. "However, we have yet to see the burst in consumer demand to avoid posting a net loss in national prices for the year.
"While most individual markets are also projected to post losses for the year, it is clear prices have begun to level off and are not exhibiting as much volatility as we've seen since the downturn began," added Villacorta.
Home Prices Faced Downward Pressure in First Half of 2011
The first half of 2011 continued the price declines experienced across much of the U.S. in 2010 as prices continued to face pressure from high unemployment and REO saturation rates above 31 percent. Home prices for the first half of this year have also been affected by a reversal of price gains from the 2009 and 2010 homebuyer tax credits. The wild spikes in price trends experienced in 2010 have given way to more gradual trends in 2011. Declines of 3.2 percent through the first half of 2011 contributed to the overall 8.0 percent decline since June 2010.
Prices were also pushed downward 4.1 percent in the first quarter of 2011 due to the slow winter home buying season creating the "double dip" in April 2011, and breaking through the previous low mark set in Q1 2009. Since then, U.S. price declines have seen modest gains, and while varying according to each local market, it is unlikely national home prices have reached a true and sustainable bottom.
The future outlook continues to point to a fragile housing market. However, the aforementioned quarterly increase of 0.9 percent is an encouraging sign that the markets are capable of positive price growth despite the first quarter lows and the continued economic and foreclosure pressures. Even with the recent gain in quarterly home prices, current price levels effectively match the levels seen in Q1 2009, and hover near the levels last seen in mid 2000.
With the potential for further economic shocks that can further damage consumer confidence, such as the financial crisis in Europe, and the discussion of debt ceilings in Washington, we expect national home prices to remain relatively flat with a slight downward change of -2.4 percent by the end of 2011.
National Home Price Trends: Second Half of 2011 Metro Market Forecast
National and regional forecasts for the remainder of the year provide indicators for general price trends but we also see differing price movements for local metropolitan statistical areas. Our analysis of the four major U.S. regions including the West, Midwest, Northeast, and South indicates all will likely remain in negative territory for the second half of the year, with the West and Midwest regions expected to continue to be the hardest hit.
At the local level, home prices in specific metropolitan areas, while volatile in the first half of 2011, are expected to show more stability as we look to the second half of the year.
Metro Markets (2011 First Half Observed, 2011 Second Half Forecast)
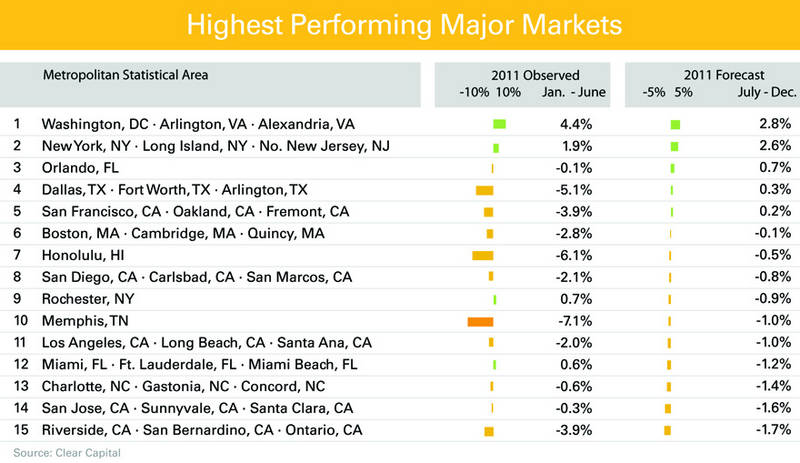
Highest Performing Markets to Continue to Stabilize
- Ten of the highest performing metropolitan markets are forecasted to improve their performance over the first half of the year, and five markets (Washington, D.C., New York, Orlando, Dallas, and San Francisco) are likely to turn modest gains.
- At the state level, California markets are showing potential for improvement as our analysis forecasts second half declines of less than 2.0%.
While price movements in the first half of the year were largely negative among metropolitan areas, the moderation of the projected price changes generally reflects a flattening market. Already, prices in five of these markets experienced a 1.0 percent or less price swing in the first six months of 2011, and the second half forecast calls for prices in nine markets to fall within this range.
Also of note, expect the Honolulu and Dallas markets to post some of the strongest improvements over the first half of the year, consistent with the above average health these markets have experienced through most of the housing downturn.
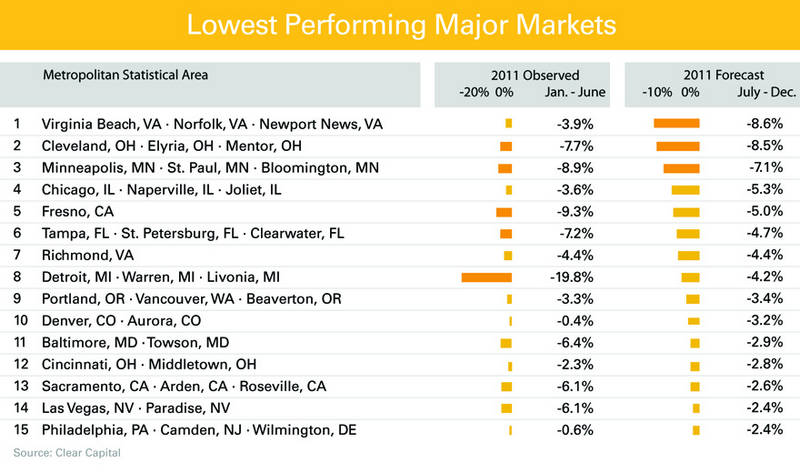
Second Half Home Price Forecast Dim After Winter of Near Record Lows
- None of the forecasted lowest performing markets are expected to produce gains in 2011.
- After spending much of 2011 atop the lowest performing major markets list with a price decline of 20%, look for Detroit to see prices fall an additional 4.2% on average by the end of the year.
- Virginia Beach remains at risk and is forecast to see steeper declines for the remainder of 2011.
Nine of the 15 lowest performing markets are expected to maintain or slow their price declines compared to the first half of the year, but none of these markets are forecasted to produce net gains for 2011. Home prices in Cleveland, Richmond, Portland, and Cincinnati are expected to continue downward within one percentage point difference of the declines experienced the first half of 2011.
Less fortunate are the markets of Virginia Beach, Chicago, Denver and Philadelphia, which are expecting to drop more than one and a half percentage point, compared to first half of the year performance. Virginia Beach holds the position as the lowest projected performer.
About the Clear Capital Home Data Index (HDI) Market Report
The Clear Capital HDI Market Report provides insights into market trends and other leading indices for the real estate market at the national and local levels. A critical difference in the value of the HDI Market Report is the capability of Clear Capital to provide more timely and granular reporting than other home price index providers.
The Clear Capital HDI Market Report:
- Offers the real estate industry (investors, lenders and servicers), government agencies and the public insight into the most recent pricing conditions, not only at the national and metropolitan level, but within local markets as well.
- Is built on the most recent information available from recorder/assessor offices, and then further enhanced by adding the company's proprietary streaming market data for the most comprehensive geographic coverage and local insights available.
- Reflects nationwide coverage of sales transactions and aggregates this comprehensive dataset at ten different geographic levels, including hundreds of metropolitan statistical areas (MSAs) and sub-ZIP code boundaries.
- Includes equally-weighted distressed bank owned sales (REOs) from around the country to give the most real world look of pricing dynamics across all sales types.
- Allows for the most current market data by providing more frequent updates with patent-pending rolling quarter technology. This ensures decisions are based on the most up-to-date information available.
Clear Capital Home Data Index™ Methodology
- Generates the timeliest indices in patent pending rolling quarter intervals that compare the most recent four months to the previous three months. The rolling quarters have no fixed start date and can be used to generate indices as data flows in, significantly reducing the multi-month lag time experienced with other indices.
- Includes both fair market and institutional (real estate owned) transactions, giving equal weight to all market transactions and identifying price tiers at a market specific level. By giving equal weight to all transactions the HDI is truly representative of each unique market.
- Results from an address-level cascade create an index with the most granular, statistically significant market area available.
- Provides weighted repeat sales, and price-per-square-foot index models that use multiple sale types, including single-family homes, multi-family homes and condominiums.
About Clear Capital
Clear Capital (www.clearcapital.com) is a premium provider of data and solutions for real estate asset valuation and risk assessment for large financial services companies. Our products include appraisals, broker-price opinions, property condition inspections, value reconciliations, and home data indices. Clear Capital's combination of progressive technology, high caliber in-house staff and a well-trained network of more than 40,000 field experts sets a new standard for accurate, up-to-date and well documented valuation data and assessments. The Company's customers include the largest U.S. banks, investment firms and other financial organizations.
Legend
Address Level Cascade - Provides the most granular market data available. From the subject property, progressively steps out from the smallest market to larger markets until data density and statistical confidence are sufficient to return a market trend.
Home Data Index (HDI) - Powerful analytics tool that provides contextual data augmenting other, human-based valuation tools. Clear Capital's multi-model approach combines address-level accuracy with the most current proprietary home pricing data available.
Metropolitan Statistical Area (MSA) - Geographic entities defined by the U.S. Office of Management and Budget (OMB) for use by Federal statistical agencies in collecting, tabulating, and publishing Federal statistics.
Repeat Sales Model - Weighted linear model based on repeat sales of same property over time.
Price Per Square Foot (PPSF) Model - Median price movement of sale prices divided by square footage over a period of time -- most commonly a quarter.
Real Estate Owned (REO) Saturation - Calculates the percentage of REOs sold as compared to all properties sold in the last rolling quarter.
Rolling Quarters - Patent pending rolling quarters compare the most recent four months to the previous three months.
The information contained in this report is based on sources that are deemed to be reliable; however no representation or warranty is made as to the accuracy, completeness, or fitness for any particular purpose of any information contained herein. This report is not intended as investment advice, and should not be viewed as any guarantee of value, condition, or other attribute.
Contact Information:
Media Contact:
Michelle Sabolich
Atomic PR for Clear Capital
415.593.1400