TRUCKEE, CA--(Marketwire - Mar 6, 2012) - Clear Capital (www.clearcapital.com), a premium provider of data and real estate asset valuation, investment and risk assessment, today released its Home Data Index™ (HDI) Market Report with data through the end of February 2012. The HDI Market Report uses a broad array of public and proprietary data sources to include data current up through the previous month offering the most timely and relevant data and analysis available.
March report highlights include:
- Year-over-year home prices for the nation are down, with quarter-over-quarter prices remaining very stable.
- All regions showed improvements in quarterly and yearly prices, while three out of four saw upticks in REO saturation.
- Top 15 MSAs resilient against notably higher REO saturation, and showing higher average gains than last month.
- All of the lowest performing MSAs saw quarter-over-quarter losses, but softer than in February.
"Home prices across the nation saw light levels of depreciation in February, consistent with the trend we have seen over the last several months," said Dr. Alex Villacorta, Director of Research and Analytics at Clear Capital. "However, the Northeast, Midwest, and West improved performance against last month's quarterly declines in light of increases in REO saturation, which is unusual and encouraging."
"With this uptick in REO activity, we'll be keeping a very close eye on the effects of the Attorneys General settlement with servicers, as it could dramatically change the flow of REO properties moving through the foreclosure process and significant impact values in the near future.
"The good news is the improvements in the job market, stronger consumer confidence, and the heightened activity of investors -- often with cash -- in the lower price tiers. These effects put upward pressure on prices, and could be in play with the resiliency we're seeing in prices against increasing REO this month," Villacorta added.
Regional Market Overview
Prices Weaker, But Putting Up a Good Fight
- The nation's housing market lost less than -2% of its value year-over-year, showing an increased stability.
- The West and Midwest are still losing ground in year-over-year performance, with losses significantly above the other regions and the nation's average.
- Quarterly numbers across all regions and nation showing softer losses (all under -2%) as compared to previous months.
- All values for all regions are improved over last month, despite mostly higher levels of REO saturation.
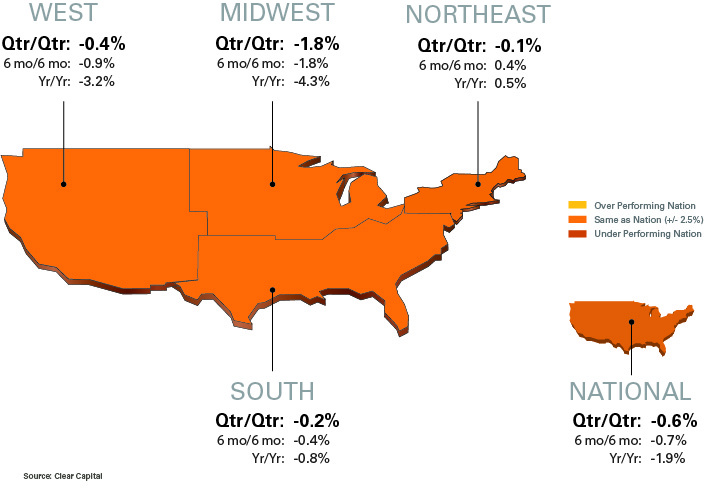
Although national home prices went down -1.9% year-over-year, the loss represented the lowest level of decline in over 10 months. The national short term numbers were also better than recent months with a loss of only -0.6% quarter-over-quarter, very close to the sixth month performance, and highlighting the short term stability we've seen over last four months.
At the regional level, short term numbers were all slightly negative, with the largest hit being in the Midwest with a -1.8% drop in values. This region is still fighting hard against broader issues such as higher unemployment and REO saturation than the rest of the nation, and the winter season slow down that tends to hit the Midwest relatively hard. The West posted a relatively high level of year-over-year price depreciation, but showed a higher degree of stability in quarterly numbers, which is a positive sign for the region which has struggled over the last year. The Northeast continues to show relative strength with small, but positive growth in year-over-year and 6 month values, along with very low REO saturation. And the South posted very little change at all in its short term and long term numbers.
Three out of four regions saw increasing levels of REO saturation but fought hard against the usual and often dramatic downward pressure on prices it brings. In fact, the regions saw higher REO saturation, the seasonal effects of winter, and an unsettled political environment (election year) but resisted these negative effects surprisingly well. Price stability in this environment indicates the presence of positive forces, which could be the improving unemployment numbers, an increase in investor activity, and an increase in overall demand.
The chart below shows the change in quarter-over-quarter prices, against the change in REO saturation since last month's report and the total REO saturation for the region.
| Region | Change in Q/Q Prices |
Change in REO Saturation |
Total REO Saturation |
| West | -0.4% | 0.8% | 32.1% |
| Midwest | -1.8% | 2.1% | 32.2% |
| Northeast | -0.1% | 1.0% | 8.8% |
| South | -0.2% | -0.6% | 23.7% |
| Nation | -0.6% | 0.2% | 25.8% |
The chart shows the relationship between prices and REO saturation with the Midwest showing the largest increase in REO saturation and the largest drop in short term prices. The rest of the numbers line up expectedly, with notable exception of the South which is showing a small decrease in REO saturation along with a small decrease in prices. This could be a red flag for the region, but as both numbers show less than 1% change, further observation will be needed to see if these trends continue.
With the exception of this quarter, national REO saturation declined over the last year, providing evidence to suggest banks might have put the brakes on processing foreclosures as they waited for further clarity on regulatory guidelines, and in particular, the Attorneys General settlement with servicers.
15 Highest and Lowest Performing Metro Markets
| Highest Performing | ||||||||
| Qtr/Qtr | Qtr/Qtr | REO | ||||||
| Rank | Metropolitan Statistical Area | % +/- | Yr/Yr | Saturation | ||||
| 1 | Providence, RI - New Bedford, MA - Fall River, MA | 7.3% | 7.6% | 15.1% | ||||
| 2 | Phoenix, AZ - Mesa, AZ - Scottsdale, AZ | 5.8% | 7.3% | 31.8% | ||||
| 3 | Columbus, OH | 3.6% | -0.8% | 31.5% | ||||
| 4 | Washington, DC - Arlington, VA - Alexandria, VA | 2.9% | 2.7% | 11.9% | ||||
| 5 | Pittsburgh, PA | 2.7% | 6.0% | 7.7% | ||||
| 6 | Miami, FL - Ft. Lauderdale, FL - Miami Beach, FL | 2.2% | 7.2% | 30.0% | ||||
| 7 | Richmond, VA | 1.7% | -1.9% | 21.3% | ||||
| 8 | Houston, TX - Baytown, TX - Sugar Land, TX | 1.6% | 0.9% | 26.6% | ||||
| 9 | Orlando, FL | 1.4% | 8.0% | 26.0% | ||||
| 10 | New York, NY - No. New Jersey, NJ - Long Island, NY | 1.3% | 2.4% | 6.7% | ||||
| 11 | Oxnard, CA - Thousand Oaks, CA - Ventura, CA | 1.2% | -3.8% | 32.3% | ||||
| 12 | Bakersfield, CA | 1.1% | 1.7% | 43.6% | ||||
| 13 | Minneapolis, MN - St. Paul, MN - Bloomington, WI | 1.1% | -2.4% | 42.2% | ||||
| 14 | Sacramento, CA - Arden, CA - Roseville, CA | 0.9% | -4.3% | 33.2% | ||||
| 15 | Las Vegas, NV - Paradise, NV | 0.8% | -6.7% | 49.4% | ||||
Highest Performing: Average Gains Going Up
- All MSAs in positive quarterly territory but with very mixed year-over-year performance.
- REO saturation for this group averages higher than national levels.
- Hard hit Las Vegas makes the Top 15 list for the first time in 10 months.
Each metro on the list held onto quarterly gains, but with just six of the Top 15 showing price growth of greater than 2%. However, the quarterly gains for this group averaged 2.4% against the 1.5% average quarterly gain posted for the Top 15 group last month.
Surprising for this month was that the Top 15 group had an average REO saturation level at 27.3%, which is 1.5 percentage points above the national level of 25.8%. While Las Vegas made its way into the Top 15 performing markets with a small quarterly gain of 0.8% against an annual loss totaling -6.7%, there are indications this market is not yet heading in the right direction. Underlying the small growth for this month are substantial declines in the low tier segment of that market, or those homes selling for $65,000 or less. This goes squarely against the trend seen in other hard hit areas such as Orlando, Miami, and Phoenix where prices are going up in the lower price tiers as investors are paying cash to take advantage of the rental markets. More information is available on this recovery dynamic in Dr. Alex Villacorta's Forbes blog called "Flooring in Florida: Is This the Start of Something Good for the Housing Market?"at http://blogs.forbes.com/alexvillacorta/.
| Lowest Performing | ||||||||
| Qtr/Qtr | Qtr/Qtr | REO | ||||||
| Rank | Metropolitan Statistical Area | % +/- | Yr/Yr | Saturation | ||||
| 1 | Cleveland, OH - Elyria, OH - Mentor, OH | -9.4% | -7.3% | 36.9% | ||||
| 2 | Milwaukee, WI - Waukesha, WI - West Allis, WI | -9.0% | -2.8% | 25.3% | ||||
| 3 | Birmingham, AL - Hoover, AL | -6.2% | -10.6% | 37.7% | ||||
| 4 | Seattle, WA - Tacoma, WA - Bellevue, WA | -5.2% | -16.5% | 21.1% | ||||
| 5 | Atlanta, GA -Sandy Springs, GA - Marietta, GA | -4.8% | -18.7% | 44.5% | ||||
| 6 | Philadelphia, PA - Camden, NJ - Wilmington, DE | -4.7% | -9.3% | 10.9% | ||||
| 7 | Detroit, MI - Warren, MI - Livonia, MI | -4.5% | -3.8% | 49.1% | ||||
| 8 | Memphis, TN | -3.1% | -4.8% | 37.3% | ||||
| 9 | Nashville, TN - Davidson, TN - Murfreesboro, TN | -3.1% | -3.7% | 18.2% | ||||
| 10 | Chicago, IL - Naperville, IL - Joliet, IL | -2.2% | -3.9% | 33.4% | ||||
| 11 | New Orleans, LA - Metairie, LA - Kenner, LA | -2.1% | -3.7% | 23.0% | ||||
| 12 | Jacksonville, FL | -2.0% | 0.1% | 30.0% | ||||
| 13 | Los Angeles, CA - Long Beach, CA - Santa Ana, CA | -1.9% | -3.3% | 32.1% | ||||
| 14 | Dayton, OH | -1.7% | 0.6% | 30.1% | ||||
| 15 | St. Louis, MO | -1.5% | -7.3% | 34.1% | ||||
Lowest Performing: Losses Lighter and Higher REO
- Quarterly losses eased this month, averaging -4.1% against an average loss of -4.7% last month.
- Average REO saturation rates also up for this group, averaging 30.9%, up from last month's 28.5%.
- Cleveland is the worst performing MSA with quarterly and yearly losses over -7%.
The lowest performing 15 markets are clearly not as resilient to the seasonal slowdown and increased REO saturation as compared to the other MSAs tracked. While all metros in this group posted negative numbers for the quarter, all but two also showed price declines year-over-year as well. Additionally, six out of 15 markets saw prices shrink by more than five percentage points over this time last year.
Cleveland was the hardest hit market in the nation this month, losing -9.4% of its value quarter-over-quarter. It was also hit hard with REO saturation, jumping a dramatic 3.8 percentage points over last quarter, putting it well above the national average of 25.8%.
Even with the poor performance of Cleveland there may be some good news. It is another example of a metro market where lower priced home sales ($28,000 and less in this case) are gaining in value while higher priced home values are dropping. Cleveland tacked on 3.4% in the low price tier, indicating there may be increased demand from investors taking advantage of low prices and building a value base in this market.
About the Clear Capital Home Data Index (HDI) Market Report
The Clear Capital HDI Market Report provides insights into market trends and other leading indices for the real estate market at the national and local levels. A critical difference in the value of the HDI Market Report is the capability of Clear Capital to provide more timely and granular reporting than other home price index providers.
The Clear Capital HDI Market Report:
- Offers the real estate industry (investors, lenders and servicers), government agencies and the public insight into the most recent pricing conditions, not only at the national and metropolitan level, but within local markets as well.
- Is built on the most recent information available from recorder/assessor offices, and then further enhanced by adding the company's proprietary streaming market data for the most comprehensive geographic coverage and local insights available.
- Reflects nationwide coverage of sales transactions and aggregates this comprehensive dataset at ten different geographic levels, including hundreds of metropolitan statistical areas (MSAs) and sub-ZIP code boundaries.
- Includes equally-weighted distressed bank owned sales (REOs) from around the country to give the most real world look of pricing dynamics across all sales types.
- Allows for the most current market data by providing more frequent updates with patent-pending rolling quarter technology. This ensures decisions are based on the most up-to-date information available.
Clear Capital Home Data Index™ Methodology
- Generates the timeliest indices in patent pending rolling quarter intervals that compare the most recent four months to the previous three months. The rolling quarters have no fixed start date and can be used to generate indices as data flows in, significantly reducing the multi-month lag time experienced with other indices.
- Includes both fair market and institutional (real estate owned) transactions, giving equal weight to all market transactions and identifying price tiers at a market specific level. By giving equal weight to all transactions the HDI is truly representative of each unique market.
- Results from an address-level cascade create an index with the most granular, statistically significant market area available.
- Provides weighted repeat sales, and price-per-square-foot index models that use multiple sale types, including single-family homes, multi-family homes and condominiums.
About Clear Capital
Clear Capital (www.clearcapital.com) is a premium provider of data and solutions for real estate asset valuation and risk assessment for large financial services companies. Our products include appraisals, broker-price opinions, property condition inspections, value reconciliations, and home data indices. Clear Capital's combination of progressive technology, high caliber in-house staff and a well-trained network of more than 40,000 field experts sets a new standard for accurate, up-to-date and well documented valuation data and assessments. The Company's customers include the largest U.S. banks, investment firms and other financial organizations.
The information contained in this report is based on sources that are deemed to be reliable; however no representation or warranty is made as to the accuracy, completeness, or fitness for any particular purpose of any information contained herein. This report is not intended as investment advice, and should not be viewed as any guarantee of value, condition, or other attribute.
Contact Information:
Media Contact:
Heather Pond
Atomic PR for Clear Capital
415.593.1400