TRUCKEE, CA--(Marketwire - Feb 6, 2012) - Clear Capital (www.clearcapital.com), a premium provider of data and real estate asset valuation, investment and risk assessment, today released its Home Data Index™ (HDI) Market Report with data through the end of January 2012. The HDI Market Report utilizes a broad array of public and proprietary data sources to include data current up through the previous month offering the most timely and relevant data and analysis available.
January report highlights include:
- Year-over-year home prices for the U.S. lost 2.6% through January.
- Quarter-over-quarter home prices for the U.S. declined 1.6%.
- The Midwest market lost its momentum and led the nation in quarterly losses.
- Remaining regions had little change quarter-over-quarter and year-over-year, with the West working hard on its recovery.
- Micro-markets showed high degrees of variability and softening due in part to seasonality and local differences in REO saturation.
"Looking at the latest data through January, home prices remained relatively unchanged with the exception of the Midwest," said Dr. Alex Villacorta, Director of Research and Analytics at Clear Capital. "Although prices at the national level continue to slide due to pressure from the Midwest, the lower priced segments of several specific markets are bucking the trend and seeing appreciation, suggesting that recoveries could be occurring from the bottom up.
"When we look at the strength in the bottom tier of prices, the volatility within the metro markets, the rapid changes in direction with certain regions, and relative stability in others, these factors underscore the economic and market fragility that remains a dark cloud over housing prices."
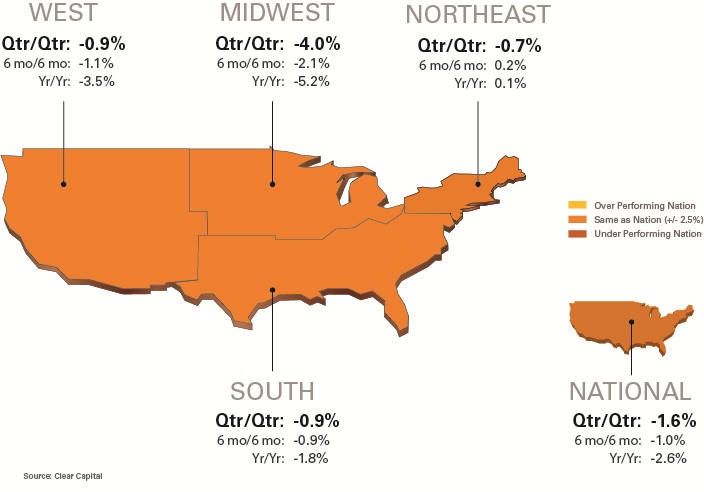
Regional Market Overview (Through Jan. 2012)
| Qtr/Qtr % +/- | 6 mo/6 mo | Yr/Yr | |
| West | -0.9% | -1.1% | -3.5% |
| Midwest | -4.0% | -2.1% | -5.2% |
| Northeast | -0.7% | 0.2% | 0.1% |
| South | -0.9% | -0.9% | -1.8% |
| National | -1.6% | -1.0% | -2.6% |
Midwest Putting Pressure on National Prices
- National home prices drop 1.6% quarter-over-quarter, after months of stability.
- Year-over-year loss of 2.6% nationwide shows the market cooling even more from the 2.1% loss reported last month.
- The Midwest saw a dramatic turnaround in momentum, losing 4.0% quarter-over-quarter, and marking the first time in seven months it has led the nation in quarterly losses.
- The West, South and Northeast regions were relatively calm, with quarter-over-quarter declines of less than 1%.
National home prices bucked three months of stability and posted a loss of 1.6% quarter-over-quarter, more than a full percentage point in lost value compared to last month's decrease of 0.4%. On a year-over-year basis, the nation lost a more significant 2.6%, due in part to market seasonality and an increase of REO sales as a percentage of total home sales, from 24.8% at the end of 2011 to 25.4% at the end of January.
The Northeast region remained essentially flat over last month's report with a very mild quarterly loss of 0.7%, and year-over-year growth of 0.1%. This region has been resilient over time with relative stability in year-over-year and quarterly numbers, but also boasts overall losses of just 22.5% since the height of that market's value in 2006, as compared to the national average of 40.5% in losses since the nation's peak.
The Southern and Western regions posted similar and mild price changes quarter-over-quarter, with 0.9% losses each and price decreases of 1.8% and 3.5% respectively year-over-year.
After consistent weakness throughout 2011, the West reduced its year-over-year losses by nearly a full percent when compared to last month's results of -4.4%. This change can be partly attributed to decrease in REO sales from 38% in the first quarter of 2011, to a healthier 31% today.
In contrast, the Midwest saw the most significant change in overall performance with quarterly losses of 4.0% against a mild 0.4% loss reported last month. This is the first time in 7 months this region leads the nation in quarterly losses. These shorter term declines pulled down its year-over-year returns to -5.2%, a marked increase from the softer 3% loss reported last month. This drop in values can be partly attributed to a 1.5% uptick in REO saturation over the past quarter from 29.5% to 31%.
15 Highest and Lowest Performing Metro Markets
| Highest Performing Major Markets | ||||
| Qtr/Qtr Rank |
Metropolitan Statistical Area | Qtr/Qtr % +/- |
Yr/Yr | REO Saturation |
| 1 | Birmingham, AL - Hoover, AL | 4.3% | -2.2% | 31.8% |
| 2 | Phoenix, AZ - Mesa, AZ - Scottsdale, AZ | 3.2% | 4.5% | 31.7% |
| 3 | Washington, DC - Arlington, VA - Alexandria, VA | 2.1% | 1.9% | 12.1% |
| 4 | Denver, CO - Aurora, CO | 1.9% | 3.5% | 23.1% |
| 5 | Orlando, FL | 1.8% | 6.7% | 25.2% |
| 6 | Houston, TX - Baytown, TX - Sugar Land, TX | 1.6% | 1.7% | 28.8% |
| 7 | Fresno, CA | 1.6% | -5.2% | 40.2% |
| 8 | Dallas, TX - Fort Worth, TX - Arlington, TX | 1.3% | 4.7% | 28.6% |
| 9 | Minneapolis, MN - St. Paul, MN - Bloomington, WI | 1.2% | -2.4% | 36.4% |
| 10 | Pittsburgh, PA | 1.1% | 3.8% | 6.7% |
| 11 | Tampa, FL - St. Petersburg, FL - Clearwater, FL | 0.9% | 0.8% | 22.3% |
| 12 | Rochester, NY | 0.8% | 3.0% | 3.3% |
| 13 | Portland, OR - Vancouver, WA - Beaverton, OR | 0.6% | -2.6% | 17.6% |
| 14 | Sacramento, CA - Arden, CA - Roseville, CA | 0.5% | -5.4% | 32.9% |
| 15 | Miami, FL - Ft. Lauderdale, FL - Miami Beach, FL | 0.4% | 5.6% | 29.9% |
Highest Performing Markets: A Narrow Range of Mild Gains
- Quarter-over-quarter gains for the top performers are narrow and aligned with last month.
- Birmingham-Hoover takes the lead on quarterly gains, with 4.3% growth, replicating its performance of last month.
- Phoenix sits in a very respectable second place with quarterly gains of 3.2%, and advances to 4th place in year-over-year performance.
All of the top performing MSAs avoided quarterly losses this month; however a third of these markets posted mild quarter-over-quarter gains of less than 1%, and only three gained more than 2%. This month's leaders are showing growth consistent with the past two months, topping out in the mid 4% range.
The Birmingham-Hoover MSA in Alabama took the lead this month with 4.3% growth quarter-over-quarter. This market is also showing marked improvement in its year-over-year performance, improving from losses of 11.1% year-over-year in last month's report to just 2.2% this month. The drivers for this market's strong performance include significant gains in its low tier segments (homes worth $63,000 and less), distressed asset sale prices, and a reduction in REO saturation to 32% from a high of 40% in 2011.
Phoenix is also on the move with 3.2% quarterly gains, and a 4.5% increase in prices year-over-year. Similar to Birmingham, the Phoenix market has shown signs of a recovery starting with the low tier segment (homes worth $82,000 and less), in price increases for distressed sales, and a deep reduction in REO saturation rate of over 15% since the start of 2011 to a still high, but more reasonable 32%. However, Phoenix has experienced severe declines since the market peak of over 61% and has a lot of ground to make up.
| Lowest Performing Major Markets | ||||
| Qtr/Qtr Rank |
Metropolitan Statistical Area | Qtr/Qtr % +/- |
Yr/Yr | REO Saturation |
| 1 | Detroit, MI - Warren, MI - Livonia, MI | -15.5% | -11.9% | 51.8% |
| 2 | Milwaukee, WI - Waukesha, WI - West Allis, WI | -7.7% | -2.0% | 24.4% |
| 3 | Atlanta, GA - Sandy Springs, GA - Marietta, GA | -7.2% | -19.2% | 42.9% |
| 4 | Memphis, TN | -6.8% | -6.9% | 36.6% |
| 5 | Philadelphia, PA - Camden, NJ - Wilmington, DE | -4.7% | -8.7% | 10.9% |
| 6 | Dayton, OH | -4.5% | 0.0% | 32.0% |
| 7 | Cleveland, OH - Elyria, OH - Mentor, OH | -4.5% | -5.4% | 33.4% |
| 8 | Seattle, WA - Tacoma, WA - Bellevue, WA | -3.9% | -15.2% | 20.6% |
| 9 | Nashville, TN - Davidson, TN - Murfreesboro, TN | -3.0% | -3.6% | 16.6% |
| 10 | Chicago, IL - Naperville, IL - Joliet, IL | -2.8% | -3.8% | 31.8% |
| 11 | Oxnard, CA - Thousand Oaks, CA - Ventura, CA | -2.3% | -6.6% | 30.8% |
| 12 | Los Angeles, CA - Long Beach, CA - Santa Ana, CA | -2.2% | -3.3% | 30.5% |
| 13 | Cincinnati, OH - Middletown, OH | -1.8% | -6.6% | 24.5% |
| 14 | Baltimore, MD - Towson, MD | -1.7% | -6.3% | 13.9% |
| 15 | San Diego, CA - Carlsbad, CA - San Marcos, CA | -1.6% | -4.3% | 27.1% |
Lowest Performing Markets: The Losses Starting to Pick Up
- Double-digit price drops are back for this group, as losses have not been this severe since May of 2011.
- 40% of the lowest performing markets are from the hard hit Midwest region.
- Detroit was hit with quarterly price drop of 15.5% and an increase in distressed sales.
- Dayton shows high volatility, and shifts from the best quarterly performer last month to a drop of 4.5% this month.
This month's low performing MSAs showed clear weakness as compared to the same group last month, with all metros posting losses greater than 1.5%, and 60% with losses of more than 3% quarter-over-quarter. On a yearly basis, a full 13 of these 15 markets are showing losses greater than 3%, with an average REO saturation rate of 28.5%.
The Detroit MSA was pummeled this month with quarter-over-quarter losses of 15.5%, and over twice the amount of depreciation than second place Milwaukee. Detroit's total losses since the peak of the market are a staggering 77%, so this month's results are painful for an already troubled market. Detroit also experienced a 9.7% increase in REO sales over last quarter to a staggering 51.8%. Although prices are still 10.8% above their lowest point in 2009, the domination of REO sales in the Detroit MSA signals values will continue to face an uphill battle.
The Dayton MSA lost a bit of prominence this month, losing 4.5% of its value quarter-over-quarter, and moving from one of the highest performing metros last month to the sixth lowest this month. This market also saw a 2% jump in its REO saturation up to 32% overall, well above the national average. This volatility is not unusual for Dayton, having experienced value swings of more than 5% in 10 out of the last 17 quarters. But despite the rapid drop, Dayton is experiencing some strength in its low priced segment of homes (under $36,000), as they have seen an uptick of 0.8% quarter-over-quarter, and 6.6% year-over-year.
Some potentially good news for Dayton is this strength in the lower tier segment of a housing market can potentially signal a base for overall prices. Dr Villacorta recently published a Forbes blog posting on this topic at: http://blogs.forbes.com/alexvillacorta/, and sees evidence of several markets building a "foundation," for future price appreciation including Orlando, Miami, Phoenix, and now potentially Dayton.
About the Clear Capital Home Data Index (HDI) Market Report
The Clear Capital HDI Market Report provides insights into market trends and other leading indices for the real estate market at the national and local levels. A critical difference in the value of the HDI Market Report is the capability of Clear Capital to provide more timely and granular reporting than other home price index providers.
The Clear Capital HDI Market Report:
- Offers the real estate industry (investors, lenders and servicers), government agencies and the public insight into the most recent pricing conditions, not only at the national and metropolitan level, but within local markets as well.
- Is built on the most recent information available from recorder/assessor offices, and then further enhanced by adding the company's proprietary streaming market data for the most comprehensive geographic coverage and local insights available.
- Reflects nationwide coverage of sales transactions and aggregates this comprehensive dataset at ten different geographic levels, including hundreds of metropolitan statistical areas (MSAs) and sub-ZIP code boundaries.
- Includes equally-weighted distressed bank owned sales (REOs) from around the country to give the most real world look of pricing dynamics across all sales types.
- Allows for the most current market data by providing more frequent updates with patent-pending rolling quarter technology. This ensures decisions are based on the most up-to-date information available.
Clear Capital Home Data Index™ Methodology
- Generates the timeliest indices in patent pending rolling quarter intervals that compare the most recent four months to the previous three months. The rolling quarters have no fixed start date and can be used to generate indices as data flows in, significantly reducing the multi-month lag time experienced with other indices.
- Includes both fair market and institutional (real estate owned) transactions, giving equal weight to all market transactions and identifying price tiers at a market specific level. By giving equal weight to all transactions the HDI is truly representative of each unique market.
- Results from an address-level cascade create an index with the most granular, statistically significant market area available.
- Provides weighted repeat sales, and price-per-square-foot index models that use multiple sale types, including single-family homes, multi-family homes and condominiums.
About Clear Capital
Clear Capital (www.clearcapital.com) is a premium provider of data and solutions for real estate asset valuation and risk assessment for large financial services companies. Our products include appraisals, broker-price opinions, property condition inspections, value reconciliations, and home data indices. Clear Capital's combination of progressive technology, high caliber in-house staff and a well-trained network of more than 40,000 field experts sets a new standard for accurate, up-to-date and well documented valuation data and assessments. The Company's customers include the largest U.S. banks, investment firms and other financial organizations.
Legend
Address Level Cascade -- Provides the most granular market data available. From the subject property, progressively steps out from the smallest market to larger markets until data density and statistical confidence are sufficient to return a market trend.
Home Data Index (HDI) -- Powerful analytics tool that provides contextual data augmenting other, human-based valuation tools. Clear Capital's multi-model approach combines address-level accuracy with the most current proprietary home pricing data available.
Metropolitan Statistical Area (MSA) -- Geographic entities defined by the U.S. Office of Management and Budget (OMB) for use by Federal statistical agencies in collecting, tabulating, and publishing Federal statistics.
Repeat Sales Model -- Weighted linear model based on repeat sales of same property over time.
Price Per Square Foot (PPSF) Model -- Median price movement of sale prices divided by square footage over a period of time--most commonly a quarter.
Real Estate Owned (REO) Saturation -- Calculates the percentage of REOs sold as compared to all properties sold in the last rolling quarter.
Rolling Quarters -- Clear Capital uses patent pending rolling quarter intervals to compare the most recent three months and a fourth month of proprietary data against the previous three months. We include the most current fourth month of proprietary pricing data, because it often contains the most relevant and insightful information.
The information contained in this report is based on sources that are deemed to be reliable; however no representation or warranty is made as to the accuracy, completeness, or fitness for any particular purpose of any information contained herein. This report is not intended as investment advice, and should not be viewed as any guarantee of value, condition, or other attribute.
Contact Information:
Media Contact:
Michelle Sabolich
Atomic PR for Clear Capital
415.593.1400