TRUCKEE, CA--(Marketwire - Nov 3, 2011) - Clear Capital (www.clearcapital.com), a premium provider of data and solutions for real estate asset valuation, investment and risk assessment, today released its Home Data Index™ (HDI) Market Report with data through October 2011.
Report highlights include:
- Nationally, the -2.8% year-over-year price decrease marked 13 consecutive months of declines.
- U.S. quarterly home price gains through October retreat to near flat levels with only 0.6% growth, compared to the 3.5% rolling quarter increase reported through September.
- Three of the four U.S. regions post slight quarterly gains, but at rates well off their summer growth.
- Across the nation, local markets experienced a general downward trend as the 15 highest performing major markets posted softer gains, while the 15 lowest performing markets experienced stronger declines.
- Cleveland, OH, was the highest quarter-over-quarter performer with a 6.2% price increase, while Las Vegas, NV, was the lowest performing market with a -3.4% price decrease.
"October home price gains have leveled out, confirming what our data has pointed to over the last several months," said Dr. Alex Villacorta, Director of Research and Analytics at Clear Capital. "Short term gains have been nearly eliminated while longer term performance measures point to mostly negative territory through the turn of the year."
Villacorta added, "With current tepid demand expected to weaken even more, consumer confidence at record lows, and as the distressed inventory continues to flow into the market, we can expect another long winter as the housing market will truly be put to the test against these downward forces."
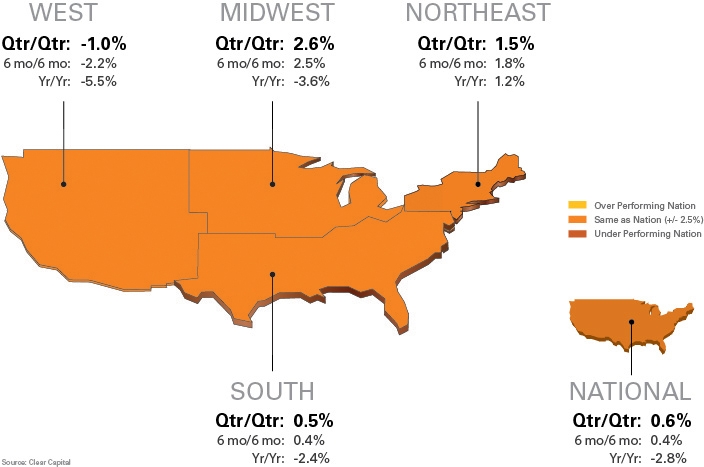
Regional Market Overview (Oct. 2010 to Nov. 2011)
| Qtr/Qtr % +/- | 6 mo/6 mo | Yr/Yr | ||||
| West | -1.0% | -2.2% | -5.5% | |||
| Midwest | 2.6% | 2.5% | -3.6% | |||
| Northeast | 1.5% | 1.8% | 1.2% | |||
| South | 0.5% | 0.4% | -2.4% | |||
| National | 0.6% | 0.4% | -2.8% | |||
Slow growth nationwide
- Regional gains and losses are converging, creating the tightest range seen throughout 2011 to date.
- The West region continues to be the weakest performer, posting a -1.0% quarterly price decline, and a -5.5% yearly decline.
- For the fourth consecutive month, the Midwest produced the strongest quarterly gains with a 2.6% increase.
For the quarter, U.S. home prices fell flat with only a slight gain of 0.6 percent through the end of October. The slight gains seen this month indicate a slowing down of growth relative to last month's 3.5 percent gains, and indicate the effects of the slower buying season are now upon us.
The West is showing continued weakness and is the first region to dip into negative territory quarter-over-quarter, posting a loss of 1.0 percent, comparing to a 0.3 percent increase last month. Looking at year-over-year prices, the West is also posting the largest declines, down 5.5 percent.
The Midwest checked in with solid quarterly growth of 2.6 percent, but when compared to last month's growth of 7.2 percent, it becomes clear the strong Midwest is also starting to feel that oncoming winter chill.
15 Highest and Lowest Performing Metro Markets (Oct. 2010 to Nov. 2011)
| Highest Performing Major Markets | ||||||||
| Qtr/Qtr Rank | Metropolitan Statistical Area | Qtr/Qtr % +/- | Yr/Yr | REO Saturation | ||||
| 1 | Cleveland, OH - Elyria, OH - Mentor, OH | 6.2% | 1.6% | 31.0% | ||||
| 2 | Hartford, CT - West Hartford, CT - East Hartford, CT | 6.0% | -1.8% | 5.7% | ||||
| 3 | Washington, DC - Arlington, VA - Alexandria, VA | 5.7% | 2.3% | 12.4% | ||||
| 4 | Columbus, OH | 4.9% | -3.7% | 34.0% | ||||
| 5 | Jacksonville, FL | 4.4% | -0.6% | 26.6% | ||||
| 6 | Honolulu, HI | 4.4% | 0.8% | 9.5% | ||||
| 7 | Chicago, IL - Naperville, IL - Joliet, IL | 4.3% | -0.1% | 27.1% | ||||
| 8 | Tampa, FL - St. Petersburg, FL - Clearwater, FL | 3.8% | -4.1% | 25.0% | ||||
| 9 | Dallas, TX - Fort Worth, TX - Arlington, TX | 2.9% | 2.7% | 29.3% | ||||
| 10 | Miami, FL - Fort Lauderdale, FL - Miami Beach, FL | 2.9% | 3.3% | 32.3% | ||||
| 11 | Milwaukee, WI - Waukesha, WI - West Allis, WI | 2.9% | -1.5% | 22.1% | ||||
| 12 | Nashville, TN - Davidson, TN - Murfreesboro, TN | 2.8% | -3.6% | 16.9% | ||||
| 13 | Denver, CO - Aurora, CO | 2.4% | -0.1% | 22.5% | ||||
| 14 | Orlando, FL | 2.3% | 3.1% | 29.1% | ||||
| 15 | Virginia Beach, VA - Norfolk, VA - Newport News, VA | 2.0% | -6.6% | 18.5% | ||||
Highest Performing Markets: Say Goodbye to Double Digit Growth
- The strongest markets in October yielded less than half of the returns seen in this group last month.
- Cleveland maintains the top position for the third month running, but still remains 58.1% off its market highs experienced in the first quarter of 2005.
- The Southern region comes in strong, with 8 of 15 of the highest performing markets.
- Four Florida markets move into the "top 15" list, aided by falling REO saturation off notably high rates.
The highest performing markets in this month's report lost considerable momentum when compared to last month. With double digit returns in the rearview mirror, Cleveland led all markets with solid 6.2 percent gains. However, this is tempered with the fact that Cleveland is also one of the nation's most volatile markets, and is still sitting 58.1 percent below its market highs from the first quarter of 2005.
Growth was so subdued this month, that nearly half of the markets returned quarterly gains of less than three percent, and our 15 highest performing markets encountered a significant amount of turnover compared to last month's report with eight new MSAs finding their way into the top 15 markets.
The South saw seven of its metro markets added to our "Top 15" list, including Jacksonville, Tampa, Dallas, Miami, Nashville, Orlando, and Virginia Beach, but these particular metros were not strong enough to help the region as a whole which grew only 0.5 percent in the quarter.
As markets across the country begin to experience a seasonal slowdown, the less-volatile Florida markets moved into the highest performing list for a number of reasons including higher resistance to seasonal downturns and a lower rate of distressed sales. All four Florida markets included in this group are still struggling with high REO saturation overall, but have seen their rates significantly drop (an average 16.2 percentage points) since the first quarter of 2011, and it is this trend that favorably affects overall prices.
As a whole, the REO saturation rate for the highest performing markets was less than 23 percent, compared to 30 percent for its lowest performing counterparts.
| Lowest Performing Major Markets | ||||||||
| Qtr/Qtr Rank | Metropolitan Statistical Area | Qtr/Qtr % +/- | Yr/Yr | REO Saturation | ||||
| 1 | Las Vegas, NV - Paradise, NV | -3.4% | -10.7% | 49.0% | ||||
| 2 | Atlanta, GA - Sandy Springs, GA - Marietta, GA | -3.0% | -10.6% | 41.1% | ||||
| 3 | Seattle, WA - Tacoma, WA - Bellevue, WA | -2.6% | -14.4% | 20.2% | ||||
| 4 | Riverside, CA - San Bernardino, CA - Ontario, CA | -2.3% | -3.9% | 44.0% | ||||
| 5 | Fresno, CA | -2.3% | -10.3% | 40.7% | ||||
| 6 | Tucson, AZ | -1.9% | -11.8% | 41.4% | ||||
| 7 | Los Angeles, CA - Long Beach, CA - Santa Ana, CA | -1.7% | -3.3% | 27.7% | ||||
| 8 | Baltimore, MD - Towson, MD | -1.7% | -6.4% | 16.5% | ||||
| 9 | San Diego, CA - Carlsbad, CA - San Marcos, CA | -1.6% | -3.5% | 26.5% | ||||
| 10 | Detroit, MI - Warren, MI - Livonia, MI | -1.1% | -12.7% | 47.4% | ||||
| 11 | Raleigh, NC - Cary, NC | -1.1% | -4.1% | 6.4% | ||||
| 12 | Charlotte, NC - Gastonia, NC - Concord, NC | -0.9% | -3.9% | 15.1% | ||||
| 13 | Sacramento, CA - Arden, CA - Roseville, CA | -0.7% | -7.2% | 35.2% | ||||
| 14 | San Francisco, CA - Oakland, CA - Fremont, CA | -0.7% | -5.7% | 24.7% | ||||
| 15 | Portland, OR - Vancouver, WA - Beaverton, OR | -0.2% | -6.5% | 16.4% | ||||
Lowest Performing Markets: Back to Business as Usual
- There were no quarterly prices gains shown in our 15 lowest performing markets reversing a three month trend.
- Las Vegas maintains the distinction of being the lowest performing market for the second month in a row.
Our lowest performing markets gave back most of the gains from the buying season. In the August, September, and October's Market Reports, no fewer than seven of the 15 lowest performing markets posted quarterly gains, however, in this month's report, all 15 markets posted quarterly declines.
Unlike the higher performing counterparts, our lowest markets showed less turnover, trading out only five MSAs from last month. With high rates of REO saturation (seven markets experienced a distressed rate higher than 35%) we expect this same consistency going forward as these areas work through their oversupply of distressed inventory.
About the Clear Capital Home Data Index (HDI) Market Report
The Clear Capital HDI Market Report provides insights into market trends and other leading indices for the real estate market at the national and local levels. A critical difference in the value of the HDI Market Report is the capability of Clear Capital to provide more timely and granular reporting than other home price index providers.
The Clear Capital HDI Market Report:
- Offers the real estate industry (investors, lenders and servicers), government agencies and the public insight into the most recent pricing conditions, not only at the national and metropolitan level, but within local markets as well.
- Is built on the most recent information available from recorder/assessor offices, and then further enhanced by adding the company's proprietary streaming market data for the most comprehensive geographic coverage and local insights available.
- Reflects nationwide coverage of sales transactions and aggregates this comprehensive dataset at ten different geographic levels, including hundreds of metropolitan statistical areas (MSAs) and sub-ZIP code boundaries.
- Includes equally-weighted distressed bank owned sales (REOs) from around the country to give the most real world look of pricing dynamics across all sales types.
- Allows for the most current market data by providing more frequent updates with patent-pending rolling quarter technology. This ensures decisions are based on the most up-to-date information available.
Clear Capital Home Data Index™ Methodology
- Generates the timeliest indices in patent pending rolling quarter intervals that compare the most recent four months to the previous three months. The rolling quarters have no fixed start date and can be used to generate indices as data flows in, significantly reducing the multi-month lag time experienced with other indices.
- Includes both fair market and institutional (real estate owned) transactions, giving equal weight to all market transactions and identifying price tiers at a market specific level. By giving equal weight to all transactions the HDI is truly representative of each unique market.
- Results from an address-level cascade create an index with the most granular, statistically significant market area available.
- Provides classes of weighted repeat sale and price-per-square-foot indices that use multiple sale types, including single-family homes, multi-family homes and condominiums.
About Clear Capital
Clear Capital (www.clearcapital.com) is a premium provider of data and solutions for real estate asset valuation and risk assessment for large financial services companies. Our products include appraisals, broker-price opinions, property condition inspections, value reconciliations, and home data indices. Clear Capital's combination of progressive technology, high caliber in-house staff and a well-trained network of more than 40,000 field experts sets a new standard for accurate, up-to-date and well documented valuation data and assessments. The Company's customers include the largest U.S. banks, investment firms and other financial organizations.
Legend
Home Data Index (HDI) -- Powerful analytics tool that provides contextual data augmenting other, human-based valuation tools. Clear Capital's multi-model approach combines address-level accuracy with the most current proprietary home pricing data available.
Metropolitan Statistical Area (MSA) -- Geographic entities defined by the U.S. Office of Management and Budget (OMB) for use by Federal statistical agencies in collecting, tabulating, and publishing Federal statistics.
Real Estate Owned (REO) Saturation -- Calculates the percentage of REOs sold as compared to all properties sold in the last rolling quarter.
Rolling Quarters -- Clear Capital uses patent pending rolling quarter intervals to compare the most recent three months and a fourth month of proprietary data against the previous three months. We include the most current fourth month of proprietary pricing data, because it often contains the most relevant and insightful information.
The information contained in this report is based on sources that are deemed to be reliable; however no representation or warranty is made as to the accuracy, completeness, or fitness for any particular purpose of any information contained herein. This report is not intended as investment advice, and should not be viewed as any guarantee of value, condition, or other attribute.
Contact Information:
Media Contact:
Michelle Sabolich
Atomic PR for Clear Capital
415.593.1400