CALGARY, ALBERTA--(Marketwired - May 19, 2017) - Computer Modelling Group Ltd. ("CMG" or the "Company") (TSX:CMG) is very pleased to report our financial results for the fiscal year ended March 31, 2017.
Management's Discussion and Analysis
This Management's Discussion and Analysis ("MD&A") for Computer Modelling Group Ltd. ("CMG", the "Company", "we" or "our"), presented as at May 18, 2017, should be read in conjunction with the audited consolidated financial statements and related notes of the Company for the years ended March 31, 2017 and 2016. Additional information relating to CMG, including our Annual Information Form, can be found at www.sedar.com. The financial data contained herein have been prepared in accordance with International Financial Reporting Standards ("IFRS") and, unless otherwise indicated, all amounts in this report are expressed in Canadian dollars.
Corporate Profile
CMG is a computer software technology company serving the oil and gas industry. The Company is a leading supplier of advanced process reservoir modelling software with a blue chip customer base of international oil companies and technology centers in approximately 60 countries. The Company also provides professional services consisting of highly specialized support, consulting, training, and contract research activities. CMG has sales and technical support services based in Calgary, Houston, London, Dubai, Bogota and Kuala Lumpur. CMG's Common Shares are listed on the Toronto Stock Exchange ("TSX") and trade under the symbol "CMG".
Vision, Business and Strategy
CMG's vision is to be the leading developer and supplier of dynamic reservoir modelling systems in the world. Early in its life CMG made the strategic decision to focus its research and development efforts on providing solutions for the simulation of difficult hydrocarbon recovery techniques, a decision that created the foundation for CMG's dominant market presence today in the simulation of advanced hydrocarbon recovery processes. CMG has demonstrated this commitment by continuously investing in research and development and working closely with its customers to develop simulation tools relevant to the challenges and opportunities they face today. This includes CoFlow, the newest generation of reservoir and production system simulation software. Our target is to develop a dynamic system that does more than optimize reservoir recovery; it will model the entire hydrocarbon reservoir system, including production systems.
Since its inception almost 40 years ago, CMG has remained focused on assisting its customers in unlocking the value of their hydrocarbon reservoirs. With petroleum production using conventional methods on the decline, the petroleum industry must use more difficult and costly advanced process extraction methods, while being faced with more governmental and regulatory requirements over environmental concerns. CMG's success can, in turn, be correlated with the oil industry becoming more reliant on the use of simulation technology due to the maturity of conventional petroleum reservoirs and the complexities of both current and emerging production processes. In addition, as producers continue to look for ways to operate efficiently in a low oil price environment, we believe they will continue to seek reservoir simulation solutions to enhance production from their existing and new assets. CMG will continue to provide the most advanced reservoir simulation tools to assist companies with their reservoir planning, management and optimization.
CMG's success can specifically be attributed to a number of factors: advanced physics, ongoing enhancements to the Company's already robust product line, improved computational speed, parallel computing ability, ease of use features of the pre- and post-processor applications, cost effectiveness of the CMG solution for customers, and the knowledge base of CMG's personnel to support and advance its software.
CMG currently licenses reservoir simulation software to more than 600 oil and gas companies, consulting firms and research institutions in approximately 60 countries. In combination with its principal business of licensing its software, CMG also provides professional services consisting of highly specialized consulting, support, training, and funded research activities for its customers. While the generation of professional services revenue specifically tied to the provision of consulting services is not regarded as a core part of CMG's business, offering this type of service is important to CMG operationally. CMG performs a limited amount of specialized consulting services, which are typically of a highly complex and/or experimental nature. These studies provide hands-on practical knowledge, allowing CMG staff to test the boundaries of our software, and provide us the opportunity to increase software license sales to both new and existing customers. In addition, providing consulting services is important from the customer service perspective as it enables our customers to become more proficient users of CMG's software. The funded research revenue is derived from the customers who partner with CMG to assist in the development, testing and refinement of new simulation technologies.
In addition to consulting, we allocate significant resources to training, which is an instrumental part of our company's success, as it enables our customers to become more efficient and effective users of our software. Our training is continuous in nature and it helps us in developing and maintaining long-term relationships with our customers.
CMG remains committed to advancing its technological superiority over its competition. CMG firmly believes that, to be the dominant supplier of dynamic reservoir modelling systems in the world, it must be responsive to customers' needs today and accurately predict their needs in the future.
CMG invests a significant amount of resources each year toward maintaining its technological superiority. During fiscal 2017, CMG maintained a consistent level of spending on research and development compared to the previous fiscal year (representing 22% of total revenue). The continued investment by CMG in its current product suite offering helps to ensure that its existing proven technology continues to be industry-leading. These significant levels of investment, in combination with developing CoFlow, are targeted strategies to achieve our vision to be the leading developer and supplier of dynamic reservoir modelling systems in the world.
Overall Performance
Key Performance Drivers and Capability to Deliver Results
One of the challenges the petroleum industry faces in trying to overcome barriers to production growth is the continuing need for breakthrough technologies. The facts facing the petroleum industry today are that brand new fields are increasingly difficult to find, especially on a large scale, and that there is a large number of mature fields and unconventional prospects where known petroleum reserves exist; the question is how to economically extract the petroleum reserves in place while utilizing environmentally conscious processes. These challenges have been made even more formidable given that the current economic environment and global political climate have led to increased uncertainty regarding capital markets and commodity prices.
The petroleum industry utilizes reservoir simulation to provide both vital information and a visual interpretation on how reservoirs will behave under various recovery techniques. With this visualization and reservoir simulation modelling, reservoir professionals receive assistance in predicting the physics and chemistry of fluid flows, drilling locations, well operating conditions, risks, and best case economics of oil and gas property investment. Understanding the science of how a petroleum reservoir will react to difficult hydrocarbon recovery processes through simulation prior to spending the capital on drilling wells and injecting expensive chemicals and steam, for instance, is far less costly and risky than trying the various techniques on real wells.
In a low oil price environment, producers have shifted their focus to lower-cost assets, improving production margins and low-cost enhanced oil recovery (EOR), instead of drilling new wells. Reservoir simulation is a cost-effective and high-value tool to reduce risks, improve recovery processes, increase margins and incremental recovery.
CMG's existing product suite of software is the market leader in the simulation of difficult hydrocarbon recovery techniques. To maintain this dominant market position, CMG actively participates in research consortia that experiment with new petroleum extraction processes and technologies. CMG then incorporates the simulation of new recovery methods into its product suite and focuses on overcoming existing technological barriers to advance speed and ease of use, amongst other benefits, in its software.
During fiscal 2017, CMG's research and development team made significant performance improvements in our simulators by introducing hybrid parallel computing, which allows our customers to run larger problems faster on a network of computers. We also successfully beta-tested cloud computing with more than one top-tier public cloud provider, which is becoming increasingly important as customers gravitate towards the flexibility, economics, capacity, in-place upgradeability and the many other benefits of the cloud. During the year we also introduced additional features in GEM, the generalized Equation-of-State compositional reservoir simulator, to allow it to perform simulations of reservoirs using chemical EOR techniques. These types of advanced features allow CMG to maintain our leadership position in simulation of advanced recovery methods, particularly as we see continued use of various types of EOR techniques globally.
The development of CoFlow, the newest generation of reservoir and production system simulation software, is a significant project for CMG. From its inception to December 31, 2016, CoFlow was a joint project with partners Shell International Exploration and Production B.V. and Petroleo Brasileiro S.A. ("Petrobras"). Effective January 1, 2017, Petrobras' financial participation in the joint development project has ended. In response to Petrobras' end of its financial participation, CMG reduced the headcount of the CoFlow development team by eight employees and contractors in January 2017. Under the new five-year agreement between CMG and Shell Global Solutions International B.V. ("Shell"), CMG is responsible for the research and development costs of CoFlow, while Shell will provide a fixed fee contribution for the continuing development of the software. CMG, through its participation in this project, will have full commercialization rights to the developed technology, while Shell and Petrobras will have unlimited perpetual CoFlow licenses. To date, the project has represented over 475 man-years of development. The CoFlow team consists of 54 full-time equivalent persons made up of 40 CMG employees and an additional 14 partner staff members working remotely from their offices in the Netherlands and the United States.
In February 2017, we released the most recent version of CoFlow, R11, to Shell and Petrobras to be used on their selected target assets. R11 made material progress in improving the runtime performance in identified areas, and there will be continued work in this area in future releases. Currently, CMG is in the process of identifying additional customers for trial modelling work using CoFlow.
CMG is in a very strong financial position with $44.0 million in working capital, no bank debt and a long history of generating earnings and cash from operating activities. In addition to its financial resources, CMG's real strength lies in the outstanding quality and dedication of its employees in all areas of the Company.
Our focus will remain on licensing software to both existing and new customers and, with diversification of our geographic profile, we plan to strengthen our position in the global marketplace. Approximately 90% of our software license revenue is derived from our annuity and maintenance contracts, which generally represent a recurring source of revenue. We continue to be profitable despite the ongoing economic challenges in the oil and gas industry. During fiscal 2017, we have suspended employee recruitment and reduced headcount and discretionary spending to control costs. As a result of ongoing adverse economic conditions in Venezuela and in the oil and gas industry in general, we decided to close our office in Caracas in May 2016. Our customers in the region continue to be supported from other locations, mainly the office in Bogota.
During the fiscal year ended March 31, 2017, our EBITDA represented 46% of total revenue, which demonstrates our continuous ability to effectively manage corporate costs.
We continue to return value to our shareholders in the form of regular quarterly dividend payments. During the year ended March 31, 2017, we paid dividends of $0.40 per share, which is consistent with the prior fiscal year.
We are confident that our sustainable business model driven by superior technology, commitment to research and development initiatives, and customer-oriented approach will continue contributing to CMG's future success.
Annual Performance
| ($ thousands, unless otherwise stated) | March 31, 2017 | March 31, 2016 | March 31, 2015 | |||
| Annuity/maintenance licenses | 65,263 | 67,805 | 63,431 | |||
| Perpetual licenses | 4,971 | 7,169 | 13,405 | |||
| Software licenses | 70,234 | 74,974 | 76,836 | |||
| Professional services | 4,863 | 5,824 | 8,025 | |||
| Total revenue | 75,097 | 80,798 | 84,861 | |||
| Operating profit | 33,321 | 36,036 | 41,516 | |||
| Operating profit (%) | 44 | % | 45 | % | 49 | % |
| EBITDA(1) | 34,414 | 37,418 | 43,099 | |||
| Net income for the year | 24,269 | 25,302 | 32,648 | |||
| Cash dividends declared and paid | 31,697 | 31,514 | 31,462 | |||
| Total assets | 106,725 | 101,413 | 106,456 | |||
| Total shares outstanding | 79,482 | 78,819 | 78,487 | |||
| Trading price per share at March 31 | 10.35 | 10.14 | 12.72 | |||
| Market capitalization at March 31 | 822,634 | 799,220 | 998,353 | |||
| Per share amounts - ($/share) | ||||||
| Earnings per share - basic | 0.31 | 0.32 | 0.42 | |||
| Earnings per share - diluted | 0.31 | 0.32 | 0.41 | |||
| Cash dividends declared and paid | 0.40 | 0.40 | 0.40 | |||
| (1) | EBITDA is defined as net income before adjusting for depreciation expense, finance income, finance costs, and income and other taxes. See "Non-IFRS Financial Measures". |
Quarterly Performance
| Fiscal 2016(1) | Fiscal 2017(2) | |||||||||||||||
| ($ thousands, unless otherwise stated) | Q1 | Q2 | Q3 | Q4 | Q1 | Q2 | Q3 | Q4 | ||||||||
| Annuity/maintenance licenses | 16,738 | 16,790 | 17,297 | 16,980 | 16,893 | 15,379 | 18,378 | 14,613 | ||||||||
| Perpetual licenses | 2,563 | 1,095 | 2,729 | 782 | 579 | 521 | 835 | 3,036 | ||||||||
| Software licenses | 19,301 | 17,885 | 20,026 | 17,762 | 17,472 | 15,900 | 19,213 | 17,649 | ||||||||
| Professional services | 2,139 | 1,240 | 1,191 | 1,254 | 1,345 | 1,027 | 1,082 | 1,409 | ||||||||
| Total revenue | 21,440 | 19,125 | 21,217 | 19,016 | 18,817 | 16,927 | 20,295 | 19,058 | ||||||||
| Operating profit | 10,494 | 8,160 | 10,342 | 7,040 | 8,975 | 6,905 | 9,811 | 7,630 | ||||||||
| Operating profit (%) | 49 | 43 | 49 | 37 | 48 | 41 | 48 | 40 | ||||||||
| EBITDA | 10,824 | 8,519 | 10,686 | 7,389 | 9,277 | 7,189 | 10,081 | 7,867 | ||||||||
| Profit before income and other taxes | 9,742 | 9,365 | 10,974 | 5,550 | 9,212 | 7,119 | 10,176 | 7,685 | ||||||||
| Income and other taxes | 2,941 | 2,599 | 3,121 | 1,668 | 2,398 | 2,128 | 2,917 | 2,480 | ||||||||
| Net income for the period | 6,801 | 6,766 | 7,853 | 3,882 | 6,814 | 4,991 | 7,259 | 5,205 | ||||||||
| Cash dividends declared and paid | 7,876 | 7,891 | 7,871 | 7,876 | 7,896 | 7,929 | 7,930 | 7,942 | ||||||||
| Per share amounts - ($/share) | ||||||||||||||||
| Earnings per share - basic | 0.09 | 0.09 | 0.10 | 0.05 | 0.09 | 0.06 | 0.09 | 0.07 | ||||||||
| Earnings per share - diluted | 0.09 | 0.08 | 0.10 | 0.05 | 0.09 | 0.06 | 0.09 | 0.07 | ||||||||
| Cash dividends declared and paid | 0.10 | 0.10 | 0.10 | 0.10 | 0.10 | 0.10 | 0.10 | 0.10 | ||||||||
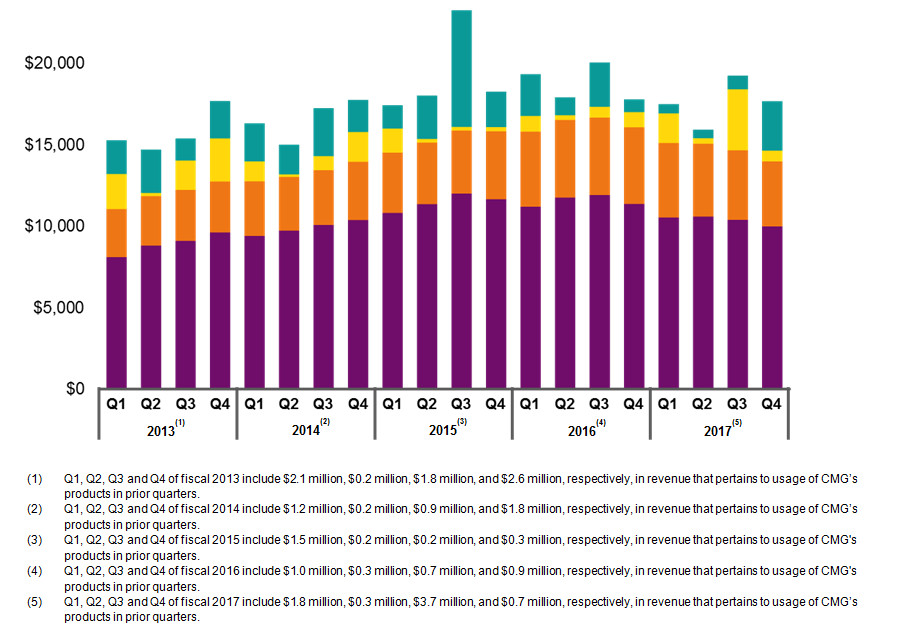
| (1) | Q1, Q2, Q3 and Q4 of fiscal 2016 include $1.0 million, $0.3 million, $0.7 million, and $0.9 million, respectively, in revenue that pertains to usage of CMG's products in prior quarters. |
| (2) | Q1, Q2, Q3 and Q4 of fiscal 2017 include $1.8 million, $0.3 million, $3.7 million, and $0.7 million, respectively, in revenue that pertains to usage of CMG's products in prior quarters. |
Highlights
During the year ended March 31, 2017, as compared to the same period of the previous fiscal year, CMG:
- Experienced a decrease in total revenue of 7%;
- Achieved a reduction in total operating expenses of 7%;
- Maintained spending on research and development at 22% of total revenue.
During the year ended March 31, 2017, CMG:
- Realized basic earnings per share of $0.31;
- Declared and paid a regular dividend of $0.40 per share.
Revenue
| Three months ended March 31, | 2017 | 2016 | $ change | % change | ||||
| ($ thousands) | ||||||||
| Software license revenue | 17,649 | 17,762 | (113 | ) | -1 | % | ||
| Professional services | 1,409 | 1,254 | 155 | 12 | % | |||
| Total revenue | 19,058 | 19,016 | 42 | 0 | % | |||
| Software license revenue - % of total revenue | 93 | % | 93 | % | ||||
| Professional services - % of total revenue | 7 | % | 7 | % | ||||
| Year ended March 31, | 2017 | 2016 | $ change | % change | ||||
| ($ thousands) | ||||||||
| Software license revenue | 70,234 | 74,974 | (4,740 | ) | -6 | % | ||
| Professional services | 4,863 | 5,824 | (961 | ) | -17 | % | ||
| Total revenue | 75,097 | 80,798 | (5,701 | ) | -7 | % | ||
| Software license revenue - % of total revenue | 94 | % | 93 | % | ||||
| Professional services - % of total revenue | 6 | % | 7 | % | ||||
CMG's revenue is comprised of software license sales, which provide the majority of the Company's revenue, and fees for professional services.
Total revenue for the three months ended March 31, 2017 remained consistent compared to the same period of the previous fiscal year. Total revenue for the year ended March 31, 2017 decreased by 7% compared to the previous fiscal year, due to decreases in both software license revenue and professional services.
Software License Revenue
Software license revenue is made up of annuity/maintenance license fees charged for the use of the Company's software products, which is generally for a term of one year or less, and perpetual software license sales, whereby the customer purchases the-then-current version of the software and has the right to use that version in perpetuity. Annuity/maintenance license fees have historically had a high renewal rate and, accordingly, provide a reliable revenue stream, while perpetual license sales are more variable and unpredictable in nature as the purchase decision and its timing fluctuate with the customers' needs and budgets. The majority of CMG's customers who have acquired perpetual software licenses subsequently purchase our maintenance package to ensure ongoing product support and access to current versions of CMG's software.
| Three months ended March 31, | 2017 | 2016 | $ change | % change | ||||
| ($ thousands) | ||||||||
| Annuity/maintenance license revenue | 14,613 | 16,980 | (2,367 | ) | -14 | % | ||
| Perpetual license revenue | 3,036 | 782 | 2,254 | 288 | % | |||
| Total software license revenue | 17,649 | 17,762 | (113 | ) | -1 | % | ||
| Annuity/maintenance as a % of total software license revenue | 83 | % | 96 | % | ||||
| Perpetual as a % of total software license revenue | 17 | % | 4 | % | ||||
| Year ended March 31, | 2017 | 2016 | $ change | % change | ||||
| ($ thousands) | ||||||||
| Annuity/maintenance license revenue | 65,263 | 67,805 | (2,542 | ) | -4 | % | ||
| Perpetual license revenue | 4,971 | 7,169 | (2,198 | ) | -31 | % | ||
| Total software license revenue | 70,234 | 74,974 | (4,740 | ) | -6 | % | ||
| Annuity/maintenance as a % of total software license revenue | 93 | % | 90 | % | ||||
| Perpetual as a % of total software license revenue | 7 | % | 10 | % | ||||
Total software license revenue for the three months ended March 31, 2017 remained relatively consistent with the same period of the previous fiscal year, due to a decrease in annuity/maintenance license revenue offset by an increase in perpetual license revenue. Total software license revenue for the year ended March 31, 2017 decreased by 6% compared to the previous fiscal year, due to decreases in both annuity/maintenance license revenue and perpetual license revenue.
CMG's annuity/maintenance license revenue decreased by 14% during the three months ended March 31, 2017, compared to the same period of the previous fiscal year, primarily due to decreases in the Eastern Hemisphere and Canada.
CMG's annuity/maintenance license revenue decreased by 4% during the year ended March 31, 2017, compared to the previous fiscal year, due to decreases in Canada, the Eastern Hemisphere and the United States, partially offset by an increase in South America.
Our annuity/maintenance license revenue can be significantly impacted by the variability of the amounts recorded from a long-standing customer for whom revenue recognition criteria are fulfilled only at the time of the receipt of funds (see the discussion about revenue earned in the current quarter that pertains to usage of products in prior quarters above the "Quarterly Software License Revenue" graph). The timing of such payments may skew the comparison of annuity/maintenance license revenue between periods. No payments were received from this customer during the three months ended March 31, 2017 and March 31, 2016. To provide a normalized comparison, if we remove the revenue from this particular customer from the year ended March 31, 2017, we note that the annuity/maintenance license revenue decreased by 11% instead of 4%. Due to the economic conditions in the country where this customer is located, revenue from this customer will continue to be recognized on a cash basis, which may result in fluctuations in our annuity/maintenance license revenue.
Perpetual license revenue increased by 288% for the three months ended March 31, 2017, compared to the same period of the previous fiscal year, due to more perpetual sales having been realized in most geographic areas, with the exception of Canada. Perpetual license revenue decreased by 31% for the year ended March 31, 2017 due to fewer perpetual sales having been realized in all geographic areas, compared to the previous fiscal year. Software licensing under perpetual sales may fluctuate significantly between periods due to the uncertainty associated with the timing and the location where sales are generated. For this reason, even though we expect to achieve a certain level of aggregate perpetual sales on an annual basis, we expect to observe fluctuations in the quarterly perpetual revenue amounts throughout the fiscal year.
We can observe from the tables below that the exchange rate between the US and Canadian dollars during the three months ended March 31, 2017, compared to the same period of the previous fiscal year, had a negative impact on reported software license revenue and the exchange rate between the US and Canadian dollars during the year ended March 31, 2017, compared to the same period of the previous fiscal year, had a positive impact on our reported software license revenue.
The following table summarizes the US dollar-denominated revenue and the weighted average exchange rate at which it was converted to Canadian dollars:
| Three months ended March 31, | 2017 | 2016 | $ change | % change | ||||||
| ($ thousands) | ||||||||||
| US dollar annuity/maintenance license revenue | US$ | 8,647 | 10,023 | (1,376 | ) | -14 | % | |||
| Weighted average conversion rate | 1.324 | 1.349 | ||||||||
| Canadian dollar equivalent | CDN$ | 11,451 | 13,518 | (2,067 | ) | -15 | % | |||
| US dollar perpetual license revenue | US$ | 2,291 | 470 | 1,821 | 387 | % | ||||
| Weighted average conversion rate | 1.325 | 1.342 | ||||||||
| Canadian dollar equivalent | CDN$ | 3,036 | 631 | 2,405 | 381 | % | ||||
| Year ended March 31, | 2017 | 2016 | $ change | % change | ||||||
| ($ thousands) | ||||||||||
| US dollar annuity/maintenance license revenue | US$ | 38,981 | 41,480 | (2,499 | ) | -6 | % | |||
| Weighted average conversion rate | 1.342 | 1.260 | ||||||||
| Canadian dollar equivalent | CDN$ | 52,318 | 52,277 | 41 | 0 | % | ||||
| US dollar perpetual license revenue | US$ | 3,679 | 5,028 | (1,349 | ) | -27 | % | |||
| Weighted average conversion rate | 1.320 | 1.297 | ||||||||
| Canadian dollar equivalent | CDN$ | 4,857 | 6,524 | (1,667 | ) | -26 | % | |||
The following table quantifies the foreign exchange impact on our software license revenue:
| Three months ended March 31, | 2016 | Incremental License | Foreign Exchange | 2017 | |||
| ($ thousands) | Growth | Impact | |||||
| Annuity/maintenance license revenue | 16,980 | (2,157 | ) | (210 | ) | 14,613 | |
| Perpetual license revenue | 782 | 2,294 | (40 | ) | 3,036 | ||
| Total software license revenue | 17,762 | 137 | (250 | ) | 17,649 | ||
| Year ended March 31 | 2016 | Incremental License | Foreign Exchange | 2017 | |||
| ($ thousands) | Growth | Impact | |||||
| Annuity/maintenance license revenue | 67,805 | (5,733 | ) | 3,191 | 65,263 | ||
| Perpetual license revenue | 7,169 | (2,282 | ) | 84 | 4,971 | ||
| Total software license revenue | 74,974 | (8,015 | ) | 3,275 | 70,234 | ||
Software Revenue by Geographic Segment
| Three months ended March 31, | 2017 | 2016 | $ change | % change | |||||
| ($ thousands) | |||||||||
| Annuity/maintenance license revenue | |||||||||
| Canada | 4,211 | 4,963 | (752 | ) | -15 | % | |||
| United States | 4,318 | 4,426 | (108 | ) | -2 | % | |||
| South America | 1,723 | 1,885 | (162 | ) | -9 | % | |||
| Eastern Hemisphere(1) | 4,361 | 5,706 | (1,345 | ) | -24 | % | |||
| 14,613 | 16,980 | (2,367 | ) | -14 | % | ||||
| Perpetual license revenue | |||||||||
| Canada | - | 151 | (151 | ) | -100 | % | |||
| United States | 164 | 35 | 129 | 369 | % | ||||
| South America | 508 | 177 | 331 | 187 | % | ||||
| Eastern Hemisphere | 2,364 | 419 | 1,945 | 464 | % | ||||
| 3,036 | 782 | 2,254 | 288 | % | |||||
| Total software license revenue | |||||||||
| Canada | 4,211 | 5,114 | (903 | ) | -18 | % | |||
| United States | 4,482 | 4,461 | 21 | 0 | % | ||||
| South America | 2,231 | 2,062 | 169 | 8 | % | ||||
| Eastern Hemisphere | 6,725 | 6,125 | 600 | 10 | % | ||||
| 17,649 | 17,762 | (113 | ) | -1 | % | ||||
| Year ended March 31, | 2017 | 2016 | $ change | % change | |||||
| ($ thousands) | |||||||||
| Annuity/maintenance license revenue | |||||||||
| Canada | 18,561 | 22,648 | (4,087 | ) | -18 | % | |||
| United States | 16,460 | 17,409 | (949 | ) | -5 | % | |||
| South America | 10,900 | 6,710 | 4,190 | 62 | % | ||||
| Eastern Hemisphere(1) | 19,342 | 21,038 | (1,696 | ) | -8 | % | |||
| 65,263 | 67,805 | (2,542 | ) | -4 | % | ||||
| Perpetual license revenue | |||||||||
| Canada | 114 | 647 | (533 | ) | -82 | % | |||
| United States | 244 | 1,404 | (1,160 | ) | -83 | % | |||
| South America | 1,070 | 1,159 | (89 | ) | -8 | % | |||
| Eastern Hemisphere | 3,543 | 3,959 | (416 | ) | -11 | % | |||
| 4,971 | 7,169 | (2,198 | ) | -31 | % | ||||
| Total software license revenue | |||||||||
| Canada | 18,675 | 23,295 | (4,620 | ) | -20 | % | |||
| United States | 16,704 | 18,813 | (2,109 | ) | -11 | % | |||
| South America | 11,970 | 7,869 | 4,101 | 52 | % | ||||
| Eastern Hemisphere | 22,885 | 24,997 | (2,112 | ) | -8 | % | |||
| 70,234 | 74,974 | (4,740 | ) | -6 | % | ||||
| (1) | Includes Europe, Africa, Asia and Australia. |
During the three months ended March 31, 2017, on a geographic basis, Canada experienced a decrease in total software license sales, which was partially offset by increases in the Eastern Hemisphere and South America, as compared to the same period of the previous fiscal year.
During the year ended March 31, 2017, on a geographic basis, total software license sales decreased in all geographic segments, with the exception of South America, as compared to the previous fiscal year.
The Canadian market (representing 27% of total annual software license revenue) experienced a 15% and 18% decrease in annuity/maintenance license revenue during the three months and year ended March 31, 2017, respectively, compared to the same periods of the previous fiscal year, due to a reduction in licensing by some customers. No perpetual sales were realized in Canada during the three months ended March 31, 2017. Fewer perpetual sales were realized during the year ended March 31, 2017, compared to the previous fiscal year.
The United States market (representing 24% of total annual software license revenue) experienced a 2% and 5% decrease in annuity/maintenance license revenue during the three months and year ended March 31, 2017, respectively, compared to the same periods of the previous fiscal year, due to decreased spending by existing customers. Perpetual license revenue for the three months ended March 31, 2017 was comparable to the same period of the previous fiscal year. Perpetual license revenue decreased by 83% during the year ended March 31, 2017, compared to the previous fiscal year, as a result of a significant perpetual sale in the first quarter of the previous fiscal year.
South America (representing 17% of total annual software license revenue) experienced a decrease of 9% in annuity/maintenance license revenue during the three months ended March 31, 2017, compared to the same period of the previous fiscal year, due to decreased spending by some customers. Annuity/maintenance license revenue for the year ended March 31, 2017 increased by 62%, compared to the previous fiscal year. Our revenue in South America can be significantly impacted by the variability of the amounts recorded from a customer for whom revenue is recognized only when cash is received (see the discussion about revenue earned in the current quarter that pertains to usage of products in prior quarters on the next page, above the "Quarterly Software License Revenue" graph). The most recent payments from this customer were recognized during the quarter ended December 31, 2016. No payments were received from this customer during the year ended March 31, 2016. To provide a normalized comparison, if we remove the revenue from this particular customer from the year ended March 31, 2017, we note that the annuity/maintenance license revenue decreased by 14% instead of increasing by 62%.
More perpetual sales were realized in South America during the three months ended March 31, 2017, compared to the same period of the previous fiscal year, resulting in a 187% increase. On a year-to-date basis, perpetual license revenue was comparable to the previous fiscal year.
The Eastern Hemisphere (representing 32% of total annual software license revenue) experienced a 24% and 8% decrease in annuity/maintenance license revenue during the three months and year ended March 31, 2017, respectively, compared to the same periods of the previous fiscal year. While some of the decrease in both periods is due to reduced licensing by some customers, a portion of the quarter-over-quarter decrease is also due to the timing of finalizing certain contracts that come up for renewal in the fourth quarter of each fiscal year. Since some of those contracts were still under negotiation as at March 31, 2017, no revenue was recognized on them in the three months ended March 31, 2017.
The Eastern Hemisphere experienced a 464% increase in perpetual license revenue during the three months ended March 31, 2017, compared to the same period of the previous fiscal year, as a result of several large perpetual sales realized in Asia and the Middle East. During the year ended March 31, 2017, the Eastern Hemisphere realized fewer perpetual sales, leading to an 11% decrease in perpetual license revenue compared to the previous fiscal year.
As footnoted in the Quarterly Performance table, in the normal course of business CMG may complete the negotiation of certain annuity/maintenance contracts and/or fulfill revenue recognition requirements within a current quarter that includes usage of CMG's products in prior quarters. This situation particularly affects contracts negotiated with countries that face increased economic and political risks leading to the revenue recognition criteria being satisfied only at the time of the receipt of cash. The dollar magnitude of such contracts may be significant to the quarterly comparatives of our annuity/maintenance license revenue stream and, to provide a normalized comparison, we specifically identify the revenue component where revenue recognition is satisfied in the current period for products provided in previous quarters.
To view the Quarterly Software License Revenue ($thousands) chart, please visit the following link: http://media3.marketwire.com/docs/1095079_graph.jpg
Deferred Revenue
| Fiscal | Fiscal | |||||||
| 2017 | 2016 | $ change | % change | |||||
| ($ thousands) | ||||||||
| Deferred revenue at: | ||||||||
| Q1 (June 30) | 26,154 | 27,006 | (852 | ) | -3 | % | ||
| Q2 (September 30) | 20,787 | 22,608 | (1,821 | ) | -8 | % | ||
| Q3 (December 31) | 18,916 | 17,243 | 1,673 | 10 | % | |||
| Q4 (March 31) | 38,232 (1 | ) | 33,629 | 4,603 | 14 | % |
| (1) | Includes current deferred revenue of $36.3 million and long-term deferred revenue of $1.9 million. |
CMG's deferred revenue consists primarily of amounts for pre-sold licenses. Our annuity/maintenance revenue is deferred and recognized on a straight-line basis or according to usage over the life of the related license period, which is generally one year or less. Amounts are deferred for licenses that have been provided and revenue recognition reflects the passage of time.
The above table illustrates the normal trend in the deferred revenue balance from the beginning of the calendar year (which corresponds with Q4 of our fiscal year), when most renewals occur, to the end of the calendar year (which corresponds with Q3 of our fiscal year). Our fourth quarter corresponds with the beginning of the fiscal year for most oil and gas companies, representing a time when they enter a new budget year and sign/renew their contracts.
Deferred revenue as at Q4 of fiscal 2017 increased by 14% compared to Q4 of fiscal 2016. The deferred revenue balance at March 31, 2017 includes a number of contracts that were not included in the deferred revenue balance in the comparative quarter, because the contracts were finalized and invoiced prior to March 31, 2017, whereas in the previous fiscal year the contracts were finalized and invoiced subsequent to March 31, 2016.
Professional Services Revenue
CMG recorded professional services revenue of $1.4 million for the three months ended March 31, 2017, which represented an increase of $0.2 million compared to the same period of the previous fiscal year. The increase was due to the new CoFlow development agreement with Shell, which entitles CMG to higher contract research revenue compared the old joint venture agreement. The increase in contract research revenue was offset by lower consulting revenue due to a decline in project activity by our customers.
Professional services revenue for the year ended March 31, 2017 was $4.9 million, which represented a decrease of $1.0 million compared to the same periods of the previous fiscal year, primarily due to a decline in project activity by our customers, partially offset by higher contract research revenue.
Professional services revenue consists of specialized consulting, training, and contract research activities. CMG performs consulting and contract research activities on an ongoing basis, but such activities are not considered to be a core part of our business and are primarily undertaken to increase our knowledge base and hence expand the technological abilities of our simulators in a funded manner, combined with servicing our customers' needs. In addition, these activities are undertaken to market the capabilities of our suite of software products with the ultimate objective to increase software license sales. Our experience is that consulting activities are variable in nature as both the timing and dollar magnitude of work are dependent on activities and budgets within customer companies.
Expenses
| Three months ended March 31, | 2017 | 2016 | $ change | % change | ||||
| ($ thousands) | ||||||||
| Sales, marketing and professional services | 5,259 | 6,071 | (812 | ) | -13 | % | ||
| Research and development | 4,587 | 4,208 | 379 | 9 | % | |||
| General and administrative | 1,582 | 1,697 | (115 | ) | -7 | % | ||
| Total operating expenses | 11,428 | 11,976 | (548 | ) | -5 | % | ||
| Direct employee costs(1) | 9,096 | 9,634 | (538 | ) | -6 | % | ||
| Other corporate costs | 2,332 | 2,342 | (10 | ) | 0 | % | ||
| 11,428 | 11,976 | (548 | ) | -5 | % | |||
| Year ended March 31, | 2017 | 2016 | $ change | % change | ||||
| ($ thousands) | ||||||||
| Sales, marketing and professional services | 19,353 | 21,450 | (2,097 | ) | -10 | % | ||
| Research and development | 16,423 | 16,865 | (442 | ) | -3 | % | ||
| General and administrative | 6,000 | 6,447 | (447 | ) | -7 | % | ||
| Total operating expenses | 41,776 | 44,762 | (2,986 | ) | -7 | % | ||
| Direct employee costs(1) | 33,214 | 36,026 | (2,812 | ) | -8 | % | ||
| Other corporate costs | 8,562 | 8,736 | (174 | ) | -2 | % | ||
| 41,776 | 44,762 | (2,986 | ) | -7 | % | |||
| (1) | Includes salaries, bonuses, stock-based compensation, benefits, commissions, and professional development. See "Non-IFRS Financial Measures". |
CMG's total operating expenses decreased by 5% and 7% for the three months and year ended March 31, 2017, compared to the same periods of the previous fiscal year, mainly due to a decrease in direct employee costs.
Direct Employee Costs
As a technology company, CMG's largest area of expenditure is its people. Approximately 80% of the total operating expenses for the year ended March 31, 2017 related to direct employee costs, consistent with the same period of the previous fiscal year. Staffing levels in the current fiscal year were lower compared to the previous fiscal year. At March 31, 2017, CMG's full-time equivalent staff complement was 199 employees and consultants, down from 212 full-time equivalent employees and consultants at March 31, 2016, mainly due to the closure of the Venezuelan office and the reduction of the CoFlow development team. Direct employee costs decreased during the three months and year ended March 31, 2017, compared to the same periods of the previous fiscal year, due to lower bonuses, lower stock-based compensation expense and the closure of the Venezuelan office in May of 2016.
Other Corporate Costs
Other corporate costs remained flat during the three months ended March 31, 2017 and decreased by 2% during the year ended March 31, 2017, compared to the same periods of the previous fiscal year, mainly due to less travel for business and training and lower depreciation, partially offset by increased operating costs of the Colombian branch.
Research and Development
| Three months ended March 31, | 2017 | 2016 | $ change | % change | ||||
| ($ thousands) | ||||||||
| Research and development (gross) | 4,891 | 4,623 | 268 | 6 | % | |||
| SR&ED credits | (304 | ) | (415 | ) | 111 | -27 | % | |
| Research and development | 4,587 | 4,208 | 379 | 9 | % | |||
| Research and development as a % of total revenue | 24 | % | 22 | % | ||||
| Year ended March 31, | 2017 | 2016 | $ change | % change | ||||
| ($ thousands) | ||||||||
| Research and development (gross) | 17,842 | 18,366 | (524 | ) | -3 | % | ||
| SR&ED credits | (1,419 | ) | (1,501 | ) | 82 | -5 | % | |
| Research and development | 16,423 | 16,865 | (442 | ) | -3 | % | ||
| Research and development as a % of total revenue | 22 | % | 21 | % | ||||
CMG maintains a belief that its strategy of growing long-term value for shareholders can only be achieved through continued investment in research and development. CMG works closely with its customers to provide solutions to complex problems related to proven and new advanced recovery processes.
The above research and development costs include $1.9 million and $6.0 million of costs for CoFlow for the three months and year ended March 31, 2017, respectively, (2016 - $1.5 million and $5.9 million, respectively). See discussion under "Commitments, Off Balance Sheet Items and Transactions with Related Parties".
Research and development costs (gross) increased by 6% during the three months ended March 31, 2017, compared to the same period of the previous fiscal year, as a result of the new agreement with our CoFlow partner Shell, under which CMG is responsible for a larger share of CoFlow costs starting January 1, 2017.
Research and development costs (gross) decreased by 3% during the year ended March 31, 2017, compared to the previous fiscal year, mainly as a result of a lower bonus accrual and lower stock-based compensation expense, offset by the aforementioned increase due to CMG being responsible for a larger share of CoFlow costs.
SR&ED credits decreased by 27% and 5% for the three months and year ended March 31, 2017, respectively, compared to the same periods of the previous fiscal year, mainly due to a decrease in hours spent on SR&ED-eligible projects.
Depreciation
| Three months ended March 31, | 2017 | 2016 | $ change | % change | |||||
| ($ thousands) | |||||||||
| Depreciation of property and equipment, allocated to: | |||||||||
| Sales, marketing and professional services | 90 | 132 | (42 | ) | -32 | % | |||
| Research and development | 125 | 178 | (53 | ) | -30 | % | |||
| General and administrative | 22 | 39 | (17 | ) | -44 | % | |||
| Total depreciation | 237 | 349 | (112 | ) | -32 | % | |||
| Year ended March 31, | 2017 | 2016 | $ change | % change | |||||
| ($ thousands) | |||||||||
| Depreciation of property and equipment, allocated to: | |||||||||
| Sales, marketing and professional services | 404 | 514 | (110 | ) | -21 | % | |||
| Research and development | 581 | 712 | (131 | ) | -18 | % | |||
| General and administrative | 108 | 156 | (48 | ) | -31 | % | |||
| Total depreciation | 1,093 | 1,382 | (289 | ) | -21 | % | |||
Depreciation for the three months and year ended March 31, 2017 decreased compared to the same periods of the previous fiscal year, because most of the existing leasehold improvements were fully depreciated during the year.
Finance Income and Costs
| Three months ended March 31, | 2017 | 2016 | $ change | % change | ||||
| ($ thousands) | ||||||||
| Interest income | 114 | 133 | (19 | ) | -14 | % | ||
| Total finance income | 114 | 133 | (19 | ) | -14 | % | ||
| Net foreign exchange loss | (59 | ) | (1,623 | ) | 1,564 | -96 | % | |
| Total finance costs | (59 | ) | (1,623 | ) | 1,564 | -96 | % | |
| Year ended March 31, | 2017 | 2016 | $ change | % change | ||||
| ($ thousands) | ||||||||
| Interest income | 551 | 549 | 2 | 0 | % | |||
| Net foreign exchange gain | 320 | - | 320 | 100 | % | |||
| Total finance income | 871 | 549 | 322 | 59 | % | |||
| Net foreign exchange loss | - | (954 | ) | 954 | -100 | % | ||
| Total finance costs | - | (954 | ) | 954 | -100 | % | ||
Interest income for the three months and year ended March 31, 2017 was comparable to the same periods of the previous fiscal year.
CMG is impacted by foreign exchange fluctuations as approximately 78% of CMG's revenue for the year ended March 31, 2017 (2016 - 76%) is denominated in US dollars, whereas only approximately 26% (2016 - 28%) of CMG's total costs are denominated in US dollars.
The following chart shows the exchange rates used to translate CMG's US dollar-denominated working capital at March 31, 2017, 2016 and 2015 and the average exchange rates used to translate income statement items during the year ended March 31, 2017, 2016 and 2015:
| CDN$ to US$ | At March 31 | Yearly average | |
| 2015 | 0.7885 | 0.8717 | |
| 2016 | 0.7710 | 0.7617 | |
| 2017 | 0.7506 | 0.7622 |
CMG recorded a net foreign exchange loss of $0.1 million for the three months ended March 31, 2017 due to a weakening of the US dollar, which negatively affected the valuation of the US-dollar denominated portion of the Company's working capital.
CMG recorded a net foreign exchange gain of $0.3 million for the year ended March 31, 2017 due to a strengthening of the US dollar during fiscal 2017.
Income and Other Taxes
CMG's effective tax rate for the year ended March 31, 2017 is 29.0% (2016 - 29.0%), whereas the prevailing Canadian statutory tax rate is now 27.0%. This difference is primarily due to the non-tax deductibility of stock-based compensation expense.
The benefit recorded in CMG's books on the scientific research and experimental development ("SR&ED") investment tax credit program impacts deferred income taxes. The investment tax credit earned in the current fiscal year is utilized by CMG to reduce income taxes otherwise payable for the current fiscal year and the federal portion of this benefit bears an inherent tax liability as the amount of the credit is included in the subsequent year's taxable income for both federal and provincial purposes. The inherent tax liability on these investment tax credits is reflected in the year the credit is earned as a non-current deferred tax liability and then, in the following fiscal year, is transferred to income taxes payable.
Operating Profit and Net Income
| Three months ended March 31, | 2017 | 2016 | $ change | % change | ||||
| ($ thousands, except per share amounts) | ||||||||
| Total revenue | 19,058 | 19,016 | 42 | 0 | % | |||
| Operating expenses | (11,428 | ) | (11,976 | ) | 548 | -5 | % | |
| Operating profit | 7,630 | 7,040 | 590 | 8 | % | |||
| Operating profit as a % of total revenue | 40 | % | 37 | % | ||||
| Net income for the period | 5,205 | 3,882 | 1,323 | 34 | % | |||
| Net income for the period as a % of total revenue | 27 | % | 20 | % | ||||
| Basic earnings per share ($/share) | 0.07 | 0.05 | 0.02 | 40 | % | |||
| Year ended March 31, | 2017 | 2016 | $ change | % change | ||||
| ($ thousands, except per share amounts) | ||||||||
| Total revenue | 75,097 | 80,798 | (5,701 | ) | -7 | % | ||
| Operating expenses | (41,776 | ) | (44,762 | ) | 2,986 | -7 | % | |
| Operating profit | 33,321 | 36,036 | (2,715 | ) | -8 | % | ||
| Operating profit as a % of total revenue | 44 | % | 45 | % | ||||
| Net income for the period | 24,269 | 25,302 | (1,033 | ) | -4 | % | ||
| Net income for the period as a % of total revenue | 32 | % | 31 | % | ||||
| Basic earnings per share ($/share) | 0.31 | 0.32 | (0.01 | ) | -3 | % | ||
Operating profit as a percentage of total revenue for the three months ended March 31, 2017 and March 31, 2016 was 40% and 37%, respectively. The higher operating profit as a percentage of total revenue in the current quarter was due to lower operating expenses.
Operating profit as a percentage of total revenue for the years ended March 31, 2017 and March 31, 2016 was 44% and 45%, respectively. Both revenue and operating expenses decreased in fiscal 2017 compared to fiscal 2016, as a result of which operating profit as a percentage of total revenue remained consistent.
Net income as a percentage of revenue for the three months ended March 31, 2017 and March 31, 2016 was 27% and 20%, respectively. The higher net income as a percentage of total revenue in the current period was due to a large foreign exchange loss recorded in the comparative period.
Net income as a percentage of revenue for the years ended March 31, 2017 and March 31, 2016 remained consistent at 32% and 31%, respectively, because lower revenue in the current fiscal year was offset by lower operating expenses and a foreign exchange gain, as opposed to a foreign exchange loss in the previous fiscal year.
EBITDA
| Three months ended March 31, | 2017 | 2016 | $ change | % change | |||||
| ($ thousands) | |||||||||
| Net income for the period | 5,205 | 3,882 | 1,323 | 34 | % | ||||
| Add (deduct): | |||||||||
| Depreciation | 237 | 349 | (112 | ) | -32 | % | |||
| Finance (income) expense | (55 | ) | 1,490 | (1,545 | ) | -104 | % | ||
| Income and other taxes | 2,480 | 1,668 | 812 | 49 | % | ||||
| EBITDA | 7,867 | 7,389 | 478 | 6 | % | ||||
| EBITDA as a % of total revenue | 41 | % | 39 | % | |||||
| Year ended March 31, | 2017 | 2016 | $ change | % change | |||||
| ($ thousands) | |||||||||
| Net income for the period | 24,269 | 25,302 | (1,033 | ) | -4 | % | |||
| Add (deduct): | |||||||||
| Depreciation | 1,093 | 1,382 | (289 | ) | -21 | % | |||
| Finance (income) expense | (871 | ) | 405 | (1,276 | ) | -315 | % | ||
| Income and other taxes | 9,923 | 10,329 | (406 | ) | -4 | % | |||
| EBITDA | 34,414 | 37,418 | (3,004 | ) | -8 | % | |||
| EBITDA as a % of total revenue | 46 | % | 46 | % | |||||
EBITDA for the three months and year ended March 31, 2017 was 41% and 46%, respectively, which is consistent with the same periods of the previous fiscal year.
Liquidity and Capital Resources
| Three months ended March 31, | 2017 | 2016 | $ change | % change | |||||
| ($ thousands) | |||||||||
| Cash, beginning of period | 56,480 | 66,200 | (9,720 | ) | -15 | % | |||
| Cash flow (used in) from: | |||||||||
| Operating activities | 18,140 | 14,489 | 3,651 | 25 | % | ||||
| Financing activities | (6,247 | ) | (7,268 | ) | 1,021 | -14 | % | ||
| Investing activities | (5,134 | ) | (741 | ) | (4,393 | ) | 593 | % | |
| Cash, end of period | 63,239 | 72,680 | (9,441 | ) | -13 | % | |||
| Year ended March 31, | 2017 | 2016 | $ change | % change | |||||
| ($ thousands) | |||||||||
| Cash, beginning of period | 72,680 | 75,342 | (2,662 | ) | -4 | % | |||
| Cash flow (used in) from: | |||||||||
| Operating activities | 28,845 | 31,665 | (2,820 | ) | -9 | % | |||
| Financing activities | (26,772 | ) | (32,418 | ) | 5,646 | -17 | % | ||
| Investing activities | (11,514 | ) | (1,909 | ) | (9,605 | ) | 503 | % | |
| Cash, end of period | 63,239 | 72,680 | (9,441 | ) | -13 | % | |||
Operating Activities
Cash flow from operating activities increased by $3.7 million in the three months ended March 31, 2017, compared to the same period of the previous fiscal year. This was mainly due to the change in the deferred revenue balance, lower income tax payments and higher net income, offset by the negative impact of the timing difference of when sales are made and when the resulting receivables are collected.
Cash flow from operating activities decreased by $2.8 million in the year ended March 31, 2017, compared to the previous fiscal year. This was mainly due to the negative impact of the timing difference of when sales are made and when the resulting receivables are collected, and when trade payables and accrued liabilities are recorded and paid. This was partially offset by lower income tax payments and the change in the deferred revenue balance.
Financing Activities
Cash used in financing activities decreased by $1.0 million during the three months ended March 31, 2017, compared to the same period of the previous fiscal year, mainly due to higher proceeds from issue of Common Shares on option exercises. Cash used in financing activities decreased by $5.6 million during the year ended March 31, 2017, compared to the same period of the previous fiscal year, due to Common Share buy-backs in the previous year.
During the year ended March 31, 2017, CMG employees and directors exercised options to purchase 663,000 Common Shares, which resulted in cash proceeds of $4.9 million (2016 - 921,000 options exercised to purchase Common Shares, which resulted in cash proceeds of $6.0 million).
In the year ended March 31, 2017, CMG paid $31.7 million in dividends, representing the following quarterly dividends:
| 2017 | |||||||||
| ($ per share) | Q1 | Q2 | Q3 | Q4 | Total | ||||
| Total dividends declared and paid | 0.10 | 0.10 | 0.10 | 0.10 | 0.40 | ||||
In the year ended March 31, 2016, CMG paid $31.5 million in dividends, representing the following quarterly dividends:
| 2016 | |||||||||
| ($ per share) | Q1 | Q2 | Q3 | Q4 | Total | ||||
| Total dividends declared and paid | 0.10 | 0.10 | 0.10 | 0.10 | 0.40 | ||||
On May 18, 2017, CMG announced the payment of a quarterly dividend of $0.10 per share on CMG's Common Shares. The dividend will be paid on June 15, 2017 to shareholders of record at the close of business on June 7, 2017.
Based on our expectation of profitability and cash-generating ability, we are cautiously optimistic that the company is well positioned to continue paying quarterly dividends.
On May 21, 2015, the Company announced a Normal Course Issuer Bid ("NCIB") commencing on May 25, 2015 to purchase for cancellation up to 7,447,000 of its Common Shares. This NCIB ended on May 24, 2016, and during the year ended March 31, 2016, 589,000 Common Shares were purchased at market price for a total cost of $6.9 million.
On May 20, 2016, the Company announced a NCIB commencing on May 25, 2016 to purchase for cancellation up to 7,485,000 of its Common Shares. During the year ended March 31, 2017, no Common Shares were purchased.
Investing Activities
CMG's current needs for capital asset investment relate to office infrastructure costs and computer equipment, all of which are being funded internally. During the year ended March 31, 2017, CMG's capital expenditures were $11.5 million, primarily for infrastructure for the new Calgary headquarters. Over the last three fiscal years, the Company invested $15.3 million in infrastructure for the new headquarters, of which $13.9 million was incurred in the year ended March 31, 2017 ($10.1 million of that was paid in cash and the remaining $3.8 million is included in trade payables and accrued liabilities as at March 31, 2017). The total budget for infrastructure is $16.0 million, and the remainder of the budget is expected to be spent in the first quarter of fiscal 2018.
CMG's capital budget for fiscal 2018 is $2.2 million, which includes the remaining spend for the new headquarters.
Liquidity and Capital Resources
At March 31, 2017, CMG has $63.2 million in cash, no debt, and has access to approximately $0.8 million under a line of credit with its principal banker. The company's primary non-operating uses of cash are for paying dividends, purchasing shares and infrastructure for the new Calgary headquarters.
During the year ended March 31, 2017, 18,780,000 shares of CMG's public float were traded on the TSX. As at March 31, 2017, CMG's market capitalization based upon its March 31, 2017 closing price of $10.35 was $822.6 million.
Commitments, Off Balance Sheet Items and Transactions with Related Parties
Under the five-year development agreement between CMG and Shell, CMG will be responsible for research and development costs of CoFlow, while Shell will provide a fixed fee contribution for the continuing development of the software. The Company estimates that revenue and costs associated with CoFlow development will approximate $4.0 million and $8.3 million, respectively, in fiscal 2018, which will result in approximately $1.5 million net incremental cost to CMG in comparison to the previous joint project arrangement. CMG plans to continue funding project costs from internally generated cash flows.
CMG has very little in the way of other ongoing material contractual obligations other than pre-sold licenses, which are reflected as deferred revenue on the statement of financial position, and contractual obligations for office leases, which are estimated for our fiscal years as follows: 2018 - $4.3 million; 2019 - $4.9 million; 2020 - $4.8 million; 2021 - $4.8 million; 2022 - $4.8 million; thereafter - $82.3 million. These amounts include a twenty-year operating lease for the new Calgary headquarters, which will commence in fiscal 2018.
Critical Accounting Estimates
The preparation of financial statements requires management to make estimates and assumptions that affect the reported amounts of assets and liabilities and the disclosure of contingent assets and liabilities at the dates of the financial statements and the reported amounts of revenues and expenses during the reporting periods. By their nature, these estimates are subject to estimation uncertainty. The effect on the financial statements of changes in such estimates in future periods could be material and would be accounted for in the period in which the estimates are revised and in any future periods affected.
Revenue recognition
Revenue consists primarily of software license fees with some fees for professional services. We recognize revenue in accordance with the current rules of IFRS. We follow specific and detailed guidelines in measuring revenue; however, certain judgments affect the application of our revenue recognition policies.
Software license revenue is comprised of annuity/maintenance license fees charged for the use of our software products, which is generally for a term of one year or less, and perpetual software licensing, whereby the customer purchases the-then-current version of the software and has the right to use that version in perpetuity. We recognize software license revenue when persuasive evidence of an arrangement exists, the product has been delivered, the fee is fixed or determinable, and collection of the resulting receivable is probable. In cases where collectability is not deemed probable, revenue is recognized upon receipt of cash, providing all other criteria have been met.
Annuity/maintenance revenue is recognized on a straight-line basis over the license period, which is generally one year or less. License fees for perpetual licenses are recognized fully in revenue when all recognition conditions are satisfied.
Certain software license agreements contain multiple-element arrangements as they may also include maintenance fees. Judgment is used in determining a fair value of each element of a contract.
Professional services revenue earned from certain consulting contracts is recognized by the stage of completion of the transaction determined using the percentage-of-completion method. Judgment is used in determining progress of each contract at period end. In assessing revenue recognition, judgment is also used in determining the ability to collect the corresponding account receivable.
Functional currency
The determination of the functional currency is a matter of determining the primary economic environment in which an entity operates. IAS 21 The Effects of Changes in Foreign Exchange Rates sets out a number of factors to apply in making the determination of the functional currency. However, applying the factors in IAS 21 does not always result in a clear indication of functional currency. Where IAS 21 factors indicate differing functional currencies within a subsidiary, the Company uses judgment in the ultimate determination of that subsidiary's functional currency, including an assessment of the nature of the relationship between the Company and the subsidiary. Judgment was applied in the determination of the functional currency of certain of the Company's operating entities.
Research and development
Assumptions are made in respect to the eligibility of certain research and development projects in the calculation of SR&ED investment tax credits which are netted against the research and development costs in the statement of operations. SR&ED claims are subject to audits by relevant taxation authorities and the actual amount may change depending on the outcome of such audits.
Stock-based compensation
Assumptions and estimates are used in determining the inputs used in the Black-Scholes option pricing model, including assumptions regarding volatility, dividend yield, risk-free interest rates, forfeiture estimates and expected option lives.
Property and equipment
Estimates are used in determining useful economic lives of property and equipment for the purposes of calculating depreciation.
Accounting Standards and Interpretations Adopted During the Year
Amendments to IAS 1 Presentation of Financial Statements
Amended IAS 1 Presentation of Financial Statements to clarify existing requirements related to materiality, order of notes, subtotals, accounting policies and disaggregation. The Company adopted, with retrospective application, these amendments to IAS 1 in its consolidated financial statements beginning April 1, 2016. The amendments to IAS 1 did not have a material impact on the Company's disclosure.
Accounting Standards and Interpretations Issued But Not Yet Effective
The following standards and interpretations have not been adopted by the Company as they apply to future periods:
IFRS 9 Financial Instruments
Replaces the guidance in IAS 39 Financial Instruments: Recognition and Measurement on the classification and measurement of financial assets, amends the impairment model and includes a new general hedge accounting standard. The mandatory effective date of IFRS 9 is for annual periods beginning on or after January 1, 2018 and must be applied retrospectively with some exemptions. Early adoption is permitted. The Company intends to adopt IFRS 9 in its consolidated financial statements beginning April 1, 2018. The Company does not expect IFRS 9 to have a material impact on the consolidated financial statements because of the nature of the Company's operations and the types of financial assets that it holds.
IFRS 15 Revenue from Contracts with Customers
Replaces the guidance in IAS 11 Construction Contracts, IAS 18 Revenue, IFRIC 13 Customer Loyalty Programmes, IFRIC 15 Agreements for the Construction of Real Estate, IFRIC 18 Transfer of Assets from Customers, and SIC 31 Revenue - Barter Transactions Involving Advertising Services with a single model that applies to contracts with customers and two approaches to recognizing revenue: at a point in time or over time. The effective date for IFRS 15 is for annual periods beginning on or after January 1, 2018. IFRS 15 is available for early adoption. The Company intends to adopt IFRS 15 in its consolidated financial statements for the annual period beginning April 1, 2018.
While we are continuing to assess the impact of the new standard, we currently believe that the most significant impact relates to our annuity agreements, which include term-based software licenses bundled with maintenance. Under the current standards, the revenue attributable to these software licenses is recognized on a straight-line basis over the license period. Under the new standard, the portion of the agreement fee that relates to the software license will be recognized as revenue upon delivery of the software license. We do not expect IFRS 15 to have a substantial impact on revenue related to our maintenance agreements, perpetual licenses, and professional services.
IFRS 16 Leases
Replaces the guidance in IAS 17 Leases and requires the recognition of most leases on the balance sheet. IFRS 16 effectively removes the classification of leases as either finance or operating leases and treats all leases as finance leases for lessees with exemptions for short-term leases where the term is twelve months or less and for leases of low value items. IFRS 16 is effective January 1, 2019, with earlier adoption permitted. The Company intends to adopt IFRS 16 in its consolidated financial statements for the annual period beginning April 1, 2019. The extent of the impact of adoption of the standard has not yet been determined.
Outstanding Share Data
The following table represents the number of Common Shares and options outstanding:
| As at May 18, 2017 (thousands) |
|
| Common Shares | 79,535 |
| Options | 7,151 |
On July 13, 2005, CMG adopted a rolling stock option plan which allows the Company to grant options to its employees, officers and directors to acquire Common Shares of up to 10% of the outstanding Common Shares at the date of grant. Based upon this calculation, at May 18, 2017, CMG could grant up to 7,953,000 stock options.
Business Risks
The Company has the following business risks:
Commodity Price Risk
CMG's customers are oil and gas companies and it might, therefore, be assumed that its financial results are significantly impacted by commodity prices. CMG's actual experience of growth in software license revenues during depressed oil price markets makes us believe that software license sales are influenced more by the utility of the software as opposed to the prevailing commodity price, but different circumstances could prevail in the future. Low commodity prices and resulting lower cash flow in the industry could impact how customers license CMG software; one could expect sales of perpetual licenses to decrease in favour of leasing software on a term basis.
Volatility in commodity prices could have an impact on CMG's consulting business; however, this business segment generates less than 10% of total revenues and CMG has no current plans to significantly expand this area of business.
Credit and Liquidity Risks
Our product demand is dependent on the customers' overall spending plans, which are driven by commodity prices and the availability of capital. This risk is mitigated by having a diversified customer base with the majority of revenue being derived from larger entities which are not as affected by the market volatility or cyclical downturns in commodity prices. In addition, our diversified geographic profile helps to mitigate the effects of economic recessions and instability experienced in any particular geographic region.
The Company mitigates the collection risk by closely monitoring its accounts receivable and assessing creditworthiness of its customers. The Company has not had any significant losses to date.
In terms of liquidity, the Company held $63.2 million of cash at March 31, 2017, which more than covers its obligations, and it has approximately $0.8 million of the credit facility available for its use. The Company's cash is held with a reputable banking institution. For the described reasons, we believe that our liquidity risk is low.
Sales Variability Risk
CMG's software license revenue consists of annuity/maintenance software licensing, which is generally for a term of one year or less, and perpetual software licensing, whereby the customer purchases the-then-current version of the software and has the right to use that version in perpetuity. Software licensing under perpetual sales is a significant part of CMG's business but is more variable in nature as the purchase decision, and its timing, fluctuate with customers' needs and budgets. CMG has found that a number of customers prefer to acquire perpetual software licenses rather than leasing the software on an annual basis. The experience over the last few years is that a number of these customers are purchasing additional licenses to allow more users to access CMG technology in their operations. CMG has found that a large percentage of its customers who have acquired perpetual software licenses are subsequently purchasing maintenance licenses to ensure they have access to current CMG technology.
The variability in sales of perpetual licenses may cause significant fluctuations in the Company's quarterly and annual financial results, and these results may not meet the expectations of analysts or investors. Accordingly, the Company's past results may not be a good indication of its future performance.
CMG's customers are both domestic and international oil and gas companies and for the years ended March 31, 2017 and 2016, no customer represented revenue in excess of 10% of total revenue.
Foreign Exchange Risk
CMG's reported results are affected by the exchange rate between the Canadian dollar and the US dollar as approximately 78% (2016 - 76%) of product revenues in fiscal 2017 were denominated in US dollars. Approximately 26% of CMG's total costs in fiscal 2017 (2016 - 28%) were denominated in US dollars, which provides a partial economic hedge against the fluctuation in currency exchange between the US and the Canadian dollar on revenues. CMG's residual revenues and costs are primarily denominated in Canadian dollars, and its policy is to convert excess US dollar cash into Canadian dollars when received.
Geopolitical Risk
CMG sells its products and services in approximately 60 countries and maintains offices in Canada, the United States, the United Kingdom, the United Arab Emirates, Colombia and Malaysia. Some of these countries have greater economic, political and social risks than North America. Some of those risks include:
- Costs associated with the use of foreign agents and contractors;
- Difficulties in collecting accounts receivable;
- Currency restrictions and exchange rate fluctuations;
- The burdens of complying with a wide variety of foreign laws;
- Changes in laws governing existing operations and contracts;
- Changes to taxation policies dramatically increasing tax costs to the Company;
- Possible social, labor, political, and economic instability;
- Economic and legal sanctions;
- Non-compliance with applicable anti-corruption and bribery laws.
Any disruption in our ability to complete a sale cycle, including disruption of travel to customers' locations to provide training and support, and the cost of reorganizing daily activities of foreign operations, could have an adverse effect on CMG's business, financial condition and operational results. CMG mitigates the potential adverse effect on sales by invoicing for the full license term in advance for the majority of software license sales and by invoicing as frequently as the contract allows for consulting and contract research services. CMG consults with tax advisors on complex tax issues and engages professional tax firms to review its tax filings in foreign jurisdictions. CMG closely monitors the business and regulatory environments of the countries in which it conducts operations to minimize the potential impact on costs and operations.
Non-compliance with applicable anti-corruption and bribery laws could subject the Company to onerous penalties and the costs of prosecution. CMG has established business practices and internal controls to minimize the potential occurrence of any irregular payments. In addition, the Company has established well-defined anti-corruption and bribery policies and procedures that each employee and contractor is required to sign indicating their compliance.
Competition Risk
Competition is a risk for CMG as it is for almost every company in every sector. The reservoir simulation software industry currently consists of three major suppliers (including CMG) and a number of small suppliers. Some of the other suppliers, including two major suppliers, offer products or oil field services outside the scope of reservoir simulation. Some potential customers may prefer to deal with such multi-service suppliers, while others prefer an independent supplier, such as CMG.
Although competition is very active, CMG believes that its proven technology and the comprehensive scope of its products, combined with its international presence and recognition as a major independent supplier, provide distinct competitive advantages.
Sustaining competitive advantage is another issue, which CMG addresses by making a significant ongoing commitment to research and development spending. CMG expended $16.4 million (2016 - $16.9 million) in product research and development in its most recently completed fiscal year.
The introduction by competitors of products embodying new technology and the emergence of new industry standards and practices could render CMG's products obsolete and unmarketable and could exert price pressures on existing products, which could have negative effects on the Company's business, operating results and financial condition.
There is a significant barrier for new entrants into the reservoir simulation software industry. The cost of entry is substantial as a significant investment in research and development is required. In addition, to become a major supplier, a significant time investment is required to build up quality relationships with potential customers.
Labour Risk
The Company's continued success is substantially dependent on the performance of its key employees and officers. The loss of the services of these personnel as well as failure to attract additional key personnel could have a negative impact upon the Company's business, operating results and financial condition. Due to high levels of competition for qualified personnel, there can be no assurance that the Company will be successful in retaining and attracting such personnel. The Company attempts to overcome this by offering an attractive compensation package and providing an environment that provides the intellectual and professional stimulation sought by our employee group.
Intellectual Property Risk
CMG regards its software as proprietary and attempts to protect it with copyrights, trademarks and trade secret measures, including restrictions on disclosure and technical measures. Despite these precautions, it may be possible for third parties to copy CMG's programs or aspects of its trade secrets. CMG has no patents, and existing legal and technical precautions afford only limited practical protection. CMG could incur substantial costs in protecting and enforcing its intellectual property rights. Moreover, from time to time third parties may assert patent, trademark, copyright and other intellectual property rights to technologies that are important to CMG. In such an event, CMG may be required to incur significant costs in litigating a resolution to the asserted claim. There can be no assurance that such a resolution would not require that CMG pay damages or obtain a license of a third party's proprietary rights in order to continue licensing its products as currently offered, or, if such a license is required, that it will be available on terms acceptable to CMG.
CMG does not know of any infringement of any third party's patent rights, copyrights, trade secrecy rights or other intellectual property disputes in the development or support of its products.
Cyber Risk
CMG is dependent on information technology ("IT") infrastructure to process, transmit and store electronic information, to advertise, inform and train around CMG's products and services, to manage business operations and for the functioning and/or delivery of the Company's products and services. CMG's IT infrastructure is composed of hardware, software, networks, data center facilities, web servers, and all related equipment required to operate. Natural disasters, energy blackouts, operating malfunction, software virus or malware, cyber security attacks, human error, employee misconduct or other sources could result in the temporary or permanent loss of any or all parts of CMG's IT infrastructure. Any such incident or breach could create system disruptions or slowdowns. In such an event, the information stored in CMG's IT infrastructure could be accessed, publicly disclosed, lost, or stolen, which could subject CMG to liability and cause the Company to incur significant costs to eliminate or alleviate the problem. Additionally, such occurrences could cause negative publicity and harm to CMG's reputation. CMG mitigates such risks by ensuring the core network is not connected to the Internet, firewalling the servers that are connected to the Internet, restricting access to information through user authentication, completing frequent back-ups of data, and having a disaster recovery plan in place.
Although CMG has implemented disaster recovery plans and extensive technology security initiatives to prevent, detect and address these threats, it is virtually impossible to entirely mitigate these risks. To date, CMG has not experienced any material losses relating to cyber attacks or other information security breaches.
CMG's website collects limited user information; the website is not used for e-commerce transactions, and CMG neither receives nor retains financial information from its website users. CMG's products are not known to have any security vulnerabilities. CMG's products are engineering decision-making tools and are not employed in a cyber security (mitigation or defensive) role, as part of our client's IT infrastructure. CMG's software releases are scanned for software viruses and malware, confirming a lack thereof, prior to delivery to clients.
Tax Liability Risk
With operations and sales in various countries, CMG is subject to taxes in several jurisdictions around the world. Significant judgment is required in determining the Company's worldwide liability for income, indirect and other taxes, as well as potential penalties and interest. Although management believes that all expenses and tax credits claimed by the Company, including research and development expenses and foreign tax credits, are reasonable, deductible and have been correctly determined, tax authorities may disagree with the treatment of items reported by the Company, the result of which could have a material adverse effect on our financial condition and results of operations. CMG mitigates these risks by staying informed of changes in tax legislation, consulting with tax advisors on complex tax issues and having professional tax firms review the Company's tax filings.
CMG conducts operations worldwide through subsidiaries in various tax jurisdictions pursuant to transfer pricing arrangements with its subsidiaries. If two or more affiliated companies are located in different countries, the tax laws or regulations of each country generally will require that transfer prices be the same as those between unrelated companies dealing at arm's length. While we believe that we operate in compliance with applicable transfer pricing laws and intend to continue to do so, a tax authority in one or more jurisdictions could challenge the validity of our related-party transfer pricing methodologies, which could result in adjustments in favor of the taxing authority. To address this risk, CMG engages local professional tax firms to review the Company's transfer pricing agreements and dealings with foreign tax authorities.
Disclosure Controls and Procedures and Internal Control over Financial Reporting
Management is responsible for establishing and maintaining disclosure controls and procedures ("DC&P") and internal control over financial reporting ("ICFR") as defined under National Instrument 52-109.
At March 31, 2017, the Chief Executive Officer ("CEO") and the Chief Financial Officer ("CFO") concluded that the design and operation of the Company's DC&P were effective (in accordance with the COSO control framework (2013)) and that material information relating to the Company, including its subsidiaries, was made known to them and was recorded, processed, summarized and reported within the time periods specified under applicable securities legislation. Further, the CEO and the CFO concluded that the design and operation of the Company's ICFR were effective at March 31, 2017 in order to provide reasonable assurance regarding the reliability of financial reporting and the preparation of financial statements for external purposes in accordance with IFRS. It should be noted that while the Company's CEO and CFO believe that the Company's disclosure controls and procedures and internal controls over financial reporting provide a reasonable level of assurance that they are effective, they do not expect that such controls and procedures will prevent all errors and fraud. A control system, no matter how well conceived or operated, can provide only reasonable, not absolute, assurance that the objectives of the control system are met.
During the year ended March 31, 2017, there have been no significant changes to the Company's ICFR that have materially affected, or are reasonably likely to materially affect, the Company's ICFR.
Non-IFRS Financial Measures
This MD&A includes certain measures which have not been prepared in accordance with IFRS such as "EBITDA", "direct employee costs" and "other corporate costs." Since these measures do not have a standard meaning prescribed by IFRS, they are unlikely to be comparable to similar measures presented by other issuers. Management believes that these indicators nevertheless provide useful measures in evaluating the Company's performance.
"Direct employee costs" include salaries, bonuses, stock-based compensation, benefits, commission expenses, and professional development. "Other corporate costs" include facility-related expenses, corporate reporting, professional services, marketing and promotion, computer expenses, travel, and other office-related expenses. Direct employee costs and other corporate costs should not be considered an alternative to total operating expenses as determined in accordance with IFRS. People-related costs represent the Company's largest area of expenditure; hence, management considers highlighting separately corporate and people-related costs to be important in evaluating the quantitative impact of cost management of these two major expenditure pools. See "Expenses" heading for a reconciliation of direct employee costs and other corporate costs to total operating expenses.
"EBITDA" refers to net income before adjusting for depreciation expense, finance income, finance costs, and income and other taxes. EBITDA should not be construed as an alternative to net income as determined by IFRS. The Company believes that EBITDA is useful supplemental information as it provides an indication of the results generated by the Company's main business activities prior to consideration of how those activities are amortized, financed or taxed. See "EBITDA" heading for a reconciliation of EBITDA to net income.
Forward-looking Information
Certain information included in this MD&A is forward-looking. Forward-looking information includes statements that are not statements of historical fact and which address activities, events or developments that the Company expects or anticipates will or may occur in the future, including such things as investment objectives and strategy, the development plans and status of the Company's software development projects, the Company's intentions, results of operations, levels of activity, future capital and other expenditures (including the amount, nature and sources of funding thereof), business prospects and opportunities, research and development timetable, and future growth and performance. When used in this MD&A, statements to the effect that the Company or its management "believes", "expects", "expected", "plans", "may", "will", "projects", "anticipates", "estimates", "would", "could", "should", "endeavours", "seeks", "predicts" or "intends" or similar statements, including "potential", "opportunity", "target" or other variations thereof that are not statements of historical fact should be construed as forward-looking information. These statements reflect management's current beliefs with respect to future events and are based on information currently available to management of the Company. The Company believes that the expectations reflected in such forward-looking information are reasonable, but no assurance can be given that these expectations will prove to be correct and such forward-looking information should not be unduly relied upon.
With respect to forward-looking information contained in this MD&A, we have made assumptions regarding, among other things:
- Future software license sales
- The continued financing by and participation of the Company's CoFlow partner and it being completed in a timely manner
- Ability to enter into additional software license agreements
- Ability to continue current research and new product development
- Ability to recruit and retain qualified staff
Forward-looking information is not a guarantee of future performance and involves a number of risks and uncertainties, only some of which are described herein. Many factors could cause the Company's actual results, performance or achievements, or future events or developments, to differ materially from those expressed or implied by the forward-looking information including, without limitation, the following factors which are discussed in greater detail in the "Business Risks" section of this MD&A:
- Economic conditions in the oil and gas industry
- Reliance on key customers
- Foreign exchange
- Economic and political risks in countries where the Company currently does or proposes to do business
- Increased competition
- Reliance on employees with specialized skills or knowledge
- Protection of proprietary rights
Should one or more of these risks or uncertainties materialize, or should assumptions underlying the forward-looking statements prove incorrect, actual results, performance or achievement may vary materially from those expressed or implied by the forward-looking information contained in this MD&A. These factors should be carefully considered and readers are cautioned not to place undue reliance on forward-looking information, which speaks only as of the date of this MD&A. All subsequent forward-looking information attributable to the Company herein is expressly qualified in its entirety by the cautionary statements contained in or referred to herein. The Company does not undertake any obligation to release publicly any revisions to forward-looking information contained in this MD&A to reflect events or circumstances that occur after the date of this MD&A or to reflect the occurrence of unanticipated events, except as may be required under applicable securities laws.
This Management's Discussion and Analysis was reviewed and approved by the Audit Committee and Board of Directors and is effective as of May 18, 2017.
Outlook
During fiscal 2017, our annuity and maintenance license revenue declined by 4%. Decreases in Canada, the United States and the Eastern Hemisphere were partially offset by an increase in South America as a result of receiving payments from a customer for whom revenue is recognized only when cash is received. The majority of the declines were a result of reduced licensing by customers that have been negatively affected by the economic downturn in the oil and gas industry. The largest decrease has been experienced in Canada, while the decrease in the Eastern Hemisphere comes as a result of both declines and delays in closing of contracts in Asia and Europe. Fewer perpetual sales were made in fiscal 2017 as a result of budgetary cuts by our customers.
In the second half of fiscal 2017 we noted a hint of positive sentiment in the industry with the price of oil stabilizing in the US$45 to US$50 per barrel range, shifting the focus of some petroleum producers from cost-cutting measures to value creation. While we are encouraged by these positive indicators, reductions in budgets and activity levels by our customers over the past couple of years have affected the utilization levels of our software during fiscal 2017, resulting in lower revenue and necessitating cost reductions.
During fiscal 2017, we demonstrated fiscal restraint by reducing costs by 7%, which allowed us to maintain operating profit at 44% of total revenue and EBITA at 46% of total revenue. We believe that the achievement of such margins under difficult economic conditions is impressive.
In an environment of low commodity prices and credit constraints, it is more important than ever for petroleum producers to increase the cost effectiveness and overall efficiency of their operations. CMG will continue to provide advanced process simulation and employ leading edge technologies to help these companies to get the most out of every dollar spent. We will continue to defend and grow our market share and maintain our leadership position in advanced reservoir simulation through investment in R&D, continuous advancement of technologies and unparalleled customer support while exercising fiscal prudence.
During the fourth quarter we released the most recent version of CoFlow, R11, to Shell and Petrobras to be used on their selected target assets. R11 has made material progress in improving the runtime performance, and there will be continued focus on performance and robustness of CoFlow in future releases. At the end of December 2016, Petrobras ended its financial participation in the project, and CMG entered into a new five-year agreement with Shell for continued development of CoFlow. We have also commenced the process of identifying additional customers for trial modelling work. CoFlow will provide one-vendor solution for integrated asset modelling by combining both reservoir and production networks.
During fiscal 2017, our new headquarters in Calgary was substantially completed and will be leased by us for the next 20 years. The new building features training facilities for customers and brings together our entire team in one location. We invested just over $15 million into the new building infrastructure over the past three fiscal years. Following the investment in the new headquarters, our capital expenditures are expected to recede to their normal levels of a couple of million dollars a year.
We ended fiscal 2017 with a strong balance sheet, no debt and $63.2 million in cash. During the fourth quarter, CMG's Board of Directors declared a quarterly dividend of $0.10 per share.
Kenneth M. Dedeluk
President and Chief Executive Officer
May 18, 2017
Consolidated Statements of Financial Position
| (thousands of Canadian $) | March 31, 2017 | March 31, 2016 | |||
| Assets | |||||
| Current assets: | |||||
| Cash | 63,239 | 72,680 | |||
| Trade and other receivables (note 13(a)) | 25,305 | 21,093 | |||
| Prepaid expenses | 1,236 | 1,222 | |||
| Prepaid income taxes (note 10) | 72 | 3,173 | |||
| 89,852 | 98,168 | ||||
| Property and equipment (note 4) | 16,873 | 3,245 | |||
| Total assets | 106,725 | 101,413 | |||
| Liabilities and shareholders' equity | |||||
| Current liabilities: | |||||
| Trade payables and accrued liabilities (note 5) | 9,331 | 7,527 | |||
| Income taxes payable (note 10) | 190 | 800 | |||
| Deferred revenue | 36,303 | 33,629 | |||
| 45,824 | 41,956 | ||||
| Deferred revenue | 1,929 | - | |||
| Deferred tax liability (note 10) | 254 | 199 | |||
| Total liabilities | 48,007 | 42,155 | |||
| Shareholders' equity: | |||||
| Share capital (note 11) | 71,859 | 66,007 | |||
| Contributed surplus | 11,433 | 10,397 | |||
| Deficit | (24,574 | ) | (17,146 | ) | |
| Total shareholders' equity | 58,718 | 59,258 | |||
| Total liabilities and shareholders' equity | 106,725 | 101,413 | |||
Subsequent events (notes 11(b) and 20)
See accompanying notes to consolidated financial statements.
| Approved by the Board | |
| Frank L. Meyer | Robert F. M. Smith |
| Director | Director |
Consolidated Statements of Operations and Comprehensive Income
| Years Ended March 31, | 2017 | 2016 | |||
| (thousands of Canadian $ except per share amounts) | |||||
| Revenue (note 6) | 75,097 | 80,798 | |||
| Operating expenses | |||||
| Sales, marketing and professional services | 19,353 | 21,450 | |||
| Research and development (note 7) | 16,423 | 16,865 | |||
| General and administrative | 6,000 | 6,447 | |||
| 41,776 | 44,762 | ||||
| Operating profit | 33,321 | 36,036 | |||
| Finance income (note 9) | 871 | 549 | |||
| Finance costs (note 9) | - | (954 | ) | ||
| Profit before income and other taxes | 34,192 | 35,631 | |||
| Income and other taxes (note 10) | 9,923 | 10,329 | |||
| Net and total comprehensive income | 24,269 | 25,302 | |||
| Earnings Per Share | |||||
| Basic (note 11(e)) | 0.31 | 0.32 | |||
| Diluted (note 11(e)) | 0.31 | 0.32 | |||
See accompanying notes to consolidated financial statements.
Consolidated Statements of Changes in Equity
| Common | Contributed | Retained | Total | ||||||
| (thousands of Canadian $) | Share Capital | Surplus | Deficit | Equity | |||||
| Balance, April 1, 2015 | 59,397 | 8,561 | (4,502 | ) | 63,456 | ||||
| Total comprehensive income for the year | - | - | 25,302 | 25,302 | |||||
| Dividends paid | - | - | (31,514 | ) | (31,514 | ) | |||
| Shares issued for cash on exercise of stock options (note 11(b)) | 6,002 | - | - | 6,002 | |||||
| Common shares buy-back (notes 11(b) & (c)) | (474 | ) | - | (6,432 | ) | (6,906 | ) | ||
| Stock-based compensation: | |||||||||
| Current period expense | - | 2,918 | - | 2,918 | |||||
| Stock options exercised (note 11(b)) | 1,082 | (1,082 | ) | - | - | ||||
| Balance, March 31, 2016 | 66,007 | 10,397 | (17,146 | ) | 59,258 | ||||
| Balance, April 1, 2016 | 66,007 | 10,397 | (17,146 | ) | 59,258 | ||||
| Total comprehensive income for the year | - | - | 24,269 | 24,269 | |||||
| Dividends paid | - | - | (31,697 | ) | (31,697 | ) | |||
| Shares issued for cash on exercise of stock options (note 11(b)) | 4,925 | - | - | 4,925 | |||||
| Stock-based compensation: | |||||||||
| Current period expense (note 11 (d)) | - | 1,963 | - | 1,963 | |||||
| Stock options exercised (note 11(b)) | 927 | (927 | ) | - | - | ||||
| Balance, March 31, 2017 | 71,859 | 11,433 | (24,574 | ) | 58,718 | ||||
See accompanying notes to consolidated financial statements.
Consolidated Statements of Cash Flows
| Years ended March 31, | 2017 | 2016 | |||
| (thousands of Canadian $) | |||||
| Operating activities | |||||
| Net income | 24,269 | 25,302 | |||
| Adjustments for: | |||||
| Depreciation (note 4) | 1,093 | 1,382 | |||
| Income and other taxes (note 10) | 9,923 | 10,329 | |||
| Stock-based compensation (note 11(d)) | 2,144 | 2,918 | |||
| Interest income (note 9) | (551 | ) | (549 | ) | |
| 36,878 | 39,382 | ||||
| Changes in non-cash working capital: | |||||
| Trade and other receivables | (4,233 | ) | 5,983 | ||
| Trade payables and accrued liabilities | (1,585 | ) | (226 | ) | |
| Prepaid expenses | (14 | ) | 49 | ||
| Deferred revenue | 4,603 | 966 | |||
| Cash provided by operating activities | 35,649 | 46,154 | |||
| Interest received | 574 | 556 | |||
| Income taxes paid | (7,378 | ) | (15,045 | ) | |
| Net cash provided by operating activities | 28,845 | 31,665 | |||
| Financing activities | |||||
| Proceeds from issue of common shares | 4,925 | 6,002 | |||
| Dividends paid | (31,697 | ) | (31,514 | ) | |
| Common shares buy-back (note 11(c)) | - | (6,906 | ) | ||
| Net cash used in financing activities | (26,772 | ) | (32,418 | ) | |
| Investing activities | |||||
| Property and equipment additions (note 4) | (11,514 | ) | (1,909 | ) | |
| Decrease in cash | (9,441 | ) | (2,662 | ) | |
| Cash, beginning of year | 72,680 | 75,342 | |||
| Cash, end of year | 63,239 | 72,680 | |||
See accompanying notes to consolidated financial statements.
Notes to Consolidated Financial Statements
Years ended March 31, 2017 and 2016.
1. Reporting Entity:
Computer Modelling Group Ltd. ("CMG") is a company domiciled in Alberta, Canada and is incorporated pursuant to the Alberta Business Corporations Act, with its Common Shares listed on the Toronto Stock Exchange under the symbol "CMG". The address of CMG's registered office is 3710 33 Street N.W., Calgary, Alberta, Canada, T2L 2M1. The consolidated financial statements as at and for the year ended March 31, 2017 comprise CMG and its subsidiaries (together referred to as the "Company"). The Company is a computer software technology company engaged in the development and licensing of reservoir simulation software. The Company also provides professional services consisting of highly specialized support, consulting, training, and contract research activities.
2. Basis of Preparation:
(a) Statement of Compliance:
These consolidated financial statements have been prepared in accordance with International Financial Reporting Standards ("IFRS") as issued by the International Accounting Standards Board ("IASB").
These consolidated financial statements as at and for the year ended March 31, 2017 were authorized for issuance by the Board of Directors on May 18, 2017.
(b) Basis of Measurement:
The consolidated financial statements have been prepared on the historical cost basis, which is based on the fair value of the consideration at the time of the transaction.
(c) Functional and Presentation Currency:
The consolidated financial statements are presented in Canadian dollars, which is the functional currency of CMG and its subsidiaries. All financial information presented in Canadian dollars has been rounded to the nearest thousand.
(d) Use of Estimates, Judgments and Assumptions:
The preparation of financial statements in conformity with IFRS requires management to make judgments, estimates and assumptions that affect the application of accounting policies, the reported amounts of assets and liabilities and the disclosure of contingent assets and liabilities at the date of the financial statements and the reported amounts of revenue, costs and expenses for the period. Estimates and underlying assumptions are based on historical experience and other assumptions that are considered reasonable in the circumstances and are reviewed on an on-going basis. Actual results may differ from such estimates and it is possible that the differences could be material. Revisions to accounting estimates are recognized in the period in which the estimates are revised and in any future periods affected.
(i) Key judgments in applying accounting policies
The key judgments made in applying accounting policies, apart from those involving estimations (note 2(d)(ii) below), that have the most significant effect on the amounts recognized in these consolidated financial statements are as follows:
Functional currency - the determination of the functional currency is a matter of determining the primary economic environment in which an entity operates. IAS 21 Effects of Changes in Foreign Exchange Rates sets out a number of factors to apply in making the determination of the functional currency. However, applying the factors in IAS 21 does not always result in a clear indication of functional currency. Where IAS 21 factors indicate differing functional currencies within a subsidiary, the Company uses judgment in the ultimate determination of that subsidiary's functional currency, including an assessment of the nature of the relationship between the Company and the subsidiary. Judgment was applied in the determination of the functional currency of certain of the Company's operating entities.
Research and development - assumptions are made in respect to the eligibility of certain research and development projects in the calculation of scientific research and experimental development ("SR&ED") investment tax credits which are netted against the research and development costs in the statement of operations and comprehensive income. SR&ED claims are subject to audits by relevant taxation authorities and the actual amount may change depending on the outcome of such audits (note 7).
Revenue recognition - certain software license agreements contain multiple-element arrangements as they may also include maintenance fees. Judgment is used in determining a fair value of each element of a contract. Professional services revenue earned from certain consulting contracts is recognized by the stage of completion of the transaction determined using the percentage-of-completion method. Judgment is used in determining the progress of each contract at period end. In assessing revenue recognition, judgment is also used in determining the ability to collect the corresponding account receivable (note 6).
(ii) Estimation uncertainty
The following are the key sources of estimation uncertainty and key assumptions concerning the future, that have a significant risk of causing material adjustments to the carrying amount of assets and liabilities within the next financial year:
Stock-based compensation - assumptions and estimates are used in determining the inputs used in the Black-Scholes option pricing model, including assumptions regarding volatility, dividend yield, risk-free interest rates, forfeiture estimates and expected option lives (note 11(d)).
Property and equipment - estimates are used in determining useful economic lives of property and equipment for the purposes of calculating depreciation (note 4).
3. Significant Accounting Policies:
(a) Basis of Consolidation:
The consolidated financial statements include the accounts of CMG and its subsidiaries, all 100% owned. All inter-company transactions and balances have been eliminated on consolidation. The financial statements of the subsidiaries are prepared for the same reporting period as the parent company, using consistent accounting policies.
(b) Revenue Recognition:
Revenue consists of software license fees and professional service fees.
Software License Revenue
Software license revenue is comprised of annuity/maintenance license fees charged for the use of the Company's software products, which is generally for a term of one year or less, and perpetual software licensing fees, whereby the customer purchases the-then-current version of the software and has the right to use that version in perpetuity.
Software license revenue is recognized when persuasive evidence of an arrangement exists, the product has been delivered, the fee is fixed or determinable, and collection of the resulting receivable is probable. In cases where collectability is not deemed probable, revenue is recognized upon receipt of cash, providing all other criteria have been met.
Annuity/maintenance revenue is recognized on a straight-line basis over the license period, which is generally one year or less. Revenue for licenses billed in advance is deferred and recognized in revenue over the relevant license period.
License fees for perpetual licenses are recognized fully in revenue when all recognition conditions are satisfied.
Software license agreements with multiple-element arrangements, such as those including license fees and maintenance fees, are recognized as separate units of accounting and are recognized as each element is earned based on the relative fair value of each element. A delivered element is considered a separate unit of accounting if it has value to the customer on a standalone basis, and delivery or performance of the undelivered elements is considered probable and substantially under the Company's control. If these criteria are not met, revenue for the arrangement as a whole is accounted for as a single unit of accounting.
Professional Services Revenue
Revenue from professional services, consisting of consulting, training and contract research activities, is recorded on a percentage-of-completion basis or based on the hours incurred, as appropriate in the circumstances. This approach is used when the outcome of the contract can be estimated reliably. When the outcome of the contract cannot be estimated reliably, the amount of revenue recognized is limited to the cost incurred in the period.
(c) Cash:
Cash is comprised of interest-earning bank accounts.
(d) Property and Equipment:
Property and equipment are recorded at cost less accumulated depreciation. Cost includes expenditures that are directly attributable to the acquisition of the asset.
Depreciation is based on the cost of an asset and is recognized from the date the item is ready for use in the statement of operations and comprehensive income using the following annual rates and methods that are expected to amortize the cost of the property and equipment over their estimated useful lives:
| Computer equipment | 33 1/3% straight-line |
| Furniture and equipment | 20% straight-line |
| Leasehold improvements | Straight-line over the lease term |
Any gain or loss on disposal of an item of property and equipment (calculated as the difference between the net proceeds from disposal and the carrying amount of the item) is recognized in the statement of operations and comprehensive income.
The estimated useful lives and depreciation methods are reviewed at each fiscal year-end and adjusted if appropriate.
(e) Research and Development Costs:
All costs of product research and development are expensed to operations as incurred as the impact of both technological changes and competition require the Company to continually enhance its products on an annual basis. Research and development costs are recorded net of related SR&ED investment tax credits.
(f) Joint Research and Development Costs:
Until January 1, 2017, the Company participated in a joint project engaged in product research and development and accordingly recorded its proportionate share of costs incurred as research and development costs within the statement of operations and comprehensive income.
(g) Finance Income and Finance Costs:
Finance income comprises interest income earned on the bank balances and is recognized as it accrues through the statement of operations and comprehensive income, using the effective interest method.
Foreign currency gains and losses are reported on a net basis as either finance income or finance cost depending on whether foreign currency movements are in a net gain or net loss position. Foreign currency gains and losses are recognized in the period in which they occur.
(h) Foreign Currency Translation:
Transactions in foreign currencies are translated to Canadian dollars, the functional currency of the Company, at exchange rates at the dates of the transactions. Monetary assets and liabilities denominated in foreign currencies are translated into Canadian dollars at the rate of exchange prevailing at the reporting date, while non-monetary assets and liabilities that are measured in terms of historical cost are translated using the exchange rates at the dates of the transactions.
Revenues and expenses are translated at the rate of exchange in effect on the transaction dates. Realized and unrealized foreign exchange gains and losses are included in the statement of operations and comprehensive income in the period in which they occur.
(i) Income Taxes:
Income taxes comprise current and deferred tax.
Current tax is the expected tax payable or receivable based on taxable profit for the period calculated using tax rates that have been enacted or substantively enacted at the reporting date, and includes any adjustments to tax payable in respect of previous years. Taxable profit differs from profit as reported in the consolidated statement of operations and comprehensive income because of items that are taxable or deductible in other years and items that are never taxable and deductible. Prepaid income taxes and current income taxes payable are offset only when a legally enforceable right of offset exists and the prepaid income tax and tax payable arise in the same tax jurisdiction and relate to the same taxable entity.
Deferred taxes are recognized for temporary differences between the tax and accounting bases of assets and liabilities and for the benefit of losses available to be carried forward for tax purposes to the extent that it is probable that future taxable profits will be available against which the losses can be utilized. Deferred tax assets and liabilities are measured using the enacted or substantively enacted tax rates expected to apply in the years in which temporary differences are expected to be recovered or settled. Any change to the net deferred tax assets and liabilities is included in operations in the period it occurs. Deferred tax assets and liabilities are offset only when a legally enforceable right of offset exists and the deferred tax assets and liabilities arise in the same tax jurisdiction and relate to the same taxable entity.
In determining the amount of current and deferred tax, the Company takes into account the impact of uncertain tax positions and whether additional taxes and interest may be due. The Company believes that its accruals for tax liabilities are adequate for all open tax years based on its assessment of many factors, including interpretations of tax law and prior experience. This assessment relies on estimates and assumptions and may involve a series of judgements about future events. New information may become available that causes the Company to change its judgement regarding the adequacy of existing tax liabilities; such changes to tax liabilities will impact tax expense in the period that such a determination is made.
(j) Investment Tax Credits:
The Company receives federal and provincial investment tax credits in Canada on qualified scientific research and experimental development expenditures incurred in each taxation year. Investment tax credits are recorded as a deduction against related expenses or capital items provided that reasonable assurance over collection of the tax credits exists.
(k) Earnings Per Share:
Basic earnings per share is computed by dividing the net income by the weighted average number of Common Shares outstanding for the period. Diluted per share amounts reflect the potential dilution that could occur if securities or other contracts to issue Common Shares were exercised or converted to Common Shares. In calculating the dilutive effect of stock options, it is assumed that proceeds received from the exercise of in-the-money stock options are used to purchase Common Shares at the average market price during the period.
(l) Stock-based Compensation:
The Company has a stock option plan and a share appreciation rights plan, as described in note 11(d).
Stock options give the holder the right to purchase Common Shares and are accounted for as an equity-settled plan. The fair value of stock options is determined using the Black-Scholes valuation model as of the grant date and is expensed over the vesting period, with a corresponding increase in contributed surplus. At the end of each reporting period, the Company revises its estimate of the number of options that are expected to vest and recognizes the impact of any revision in the statement of operations and comprehensive income. When stock options are exercised, the Company records consideration received, together with amounts previously recognized in contributed surplus, as an increase in share capital.
Share appreciation rights settle in cash and are therefore accounted for as a cash-settled plan. Share appreciation rights are measured at fair value each reporting period using the Black-Scholes valuation model. The expense is recognized over the vesting period, with a corresponding adjustment to liabilities, based on the Company's estimate of the number of options that will eventually vest. When awards are exercised, the cash settlement paid reduces the outstanding liability.
Fair value measurement inputs include the share price on the measurement date, the exercise price of the instrument, expected volatility (based on an evaluation of the Company's historic volatility, particularly over the historic period commensurate with the expected term), expected term of the instruments (based on historical experience and general option holder behaviour), expected dividends, and the risk-free interest rate (based on government bonds). Service and non-market performance conditions attached to the transactions are not taken into account in determining fair value.
(m) Short-term Employee Benefits:
Short-term employee benefit obligations are measured on an undiscounted basis and are expensed as the related service is provided. A liability is recognized for the amount expected to be paid under short-term cash bonus or profit-sharing plans if the Company has a present legal or constructive obligation to pay this amount as a result of past service provided by the employee, and the obligation can be estimated reliably.
(n) Financial Instruments:
(i) Non-derivative financial assets
The Company initially recognizes loans and receivables on the date that they are originated. All other financial assets are recognized initially on the trade date at which the Company becomes a party to the contractual provisions of the instruments. The Company derecognizes a financial asset when the contractual rights to the cash flows from the asset expire or it transfers the rights to receive the contractual cash flows on the financial asset in a transaction in which substantially all the risks and rewards of ownership of the financial asset are transferred, or it neither transfers nor retains substantially all of the risks and rewards of ownership and does not retain control over the transferred asset. Any interest in such derecognized financial assets that is created or retained by the Company is recognized as a separate asset or liability. The Company classifies non-derivative financial assets into the following category:
Loans and receivables - Loans and receivables are non-derivative financial assets with fixed or determinable payments that are not quoted in an active market. The Company's cash and trade and other receivables are classified as loans and receivables. The Company's loans and receivables are recognized initially at fair value plus any directly attributable transaction costs, and subsequently measured at amortized cost using the effective interest rate method less any provision for impairment. The Company's trade and other receivables are classified as current assets.
(ii) Non-derivative financial liabilities
Financial liabilities at amortized cost include trade payables and accrued liabilities. Such liabilities are initially recognized at fair value on the trade date at which the Company becomes a party to the contractual provisions of the instrument, represented by the amount required to be paid plus any directly attributable transaction costs, and subsequently measured at amortized cost using the effective interest method. Financial liabilities are classified as current liabilities if payment is due within a year; otherwise, they are classified as non-current liabilities. The Company derecognizes a financial liability when its contractual obligations are discharged, cancelled or expire.
(iii) Share Capital
Common Shares are classified as equity. Incremental costs directly attributable to the issue of Common Shares are recognized as a deduction from equity, net of any tax effects.
(o) Impairment:
(i) Receivables
Trade and other receivables are assessed for impairment at each reporting date at both a specific and collective level. All individually significant receivables are assessed for specific impairment. All individually significant receivables found not to be specifically impaired, together with receivables that are not individually significant, are collectively assessed for impairment by grouping together receivables with similar risk characteristics. In assessing collective impairment, the Company uses historical trends of the probability of default, the timing of recoveries and the amount of loss incurred, adjusted for management's judgment as to whether current economic and credit conditions are such that the actual losses are likely to be greater or less than suggested by historical trends. An impairment loss in respect of a financial asset measured at amortized cost is calculated as the difference between its carrying amount and the present value of the estimated future cash flows discounted at the asset's original effective interest rate. Losses are recognized in the statement of operations and comprehensive income and reflected in an allowance account against trade and other receivables. When a subsequent event (such as the repayment by a debtor) causes the amount of impairment loss to decrease, the decrease is reversed through the statement of operations and comprehensive income.
(ii) Non-financial assets
The carrying amounts of the Company's non-financial assets, other than deferred tax assets, are reviewed at each reporting date to determine whether there is any indication of impairment. If any such indication exists, then the asset's recoverable amount is estimated, and any impairment loss required is recognized in the statement of operations and comprehensive income. An impairment loss is reversed only to the extent that the asset's carrying amount does not exceed the carrying amount that would have been determined, net of depreciation, if no impairment loss had been recognized.
(p) Leases:
The Company's only lease commitments relate to its office premises, which are classified as operating leases since they do not transfer the risks and rewards of ownership to the Company. Payments made under operating leases are recognized in the statement of operations and comprehensive income on a straight-line basis over the term of the lease.
(q) New Accounting Standards and Interpretations Adopted:
Amendments to IAS 1 Presentation of Financial Statements
Amended IAS 1 Presentation of Financial Statements to clarify existing requirements related to materiality, order of notes, subtotals, accounting policies and disaggregation. The Company adopted, with retrospective application, these amendments to IAS 1 in its consolidated financial statements beginning April 1, 2016. The amendments to IAS 1 did not have a material impact on the Company's disclosure.
(r) Accounting Standards and Interpretations Not Yet Adopted:
The following is a summary of new standards, amendments to standards and interpretations that are issued, but not yet effective for the year ended March 31, 2017 and that may have an impact on the disclosures and financial position of the Company. The Company intends to adopt these standards, amendments to standards and interpretations, if applicable, when they become effective.
(i) IFRS 9 Financial Instruments
Replaces the guidance in IAS 39 Financial Instruments: Recognition and Measurement on the classification and measurement of financial assets, amends the impairment model and includes a new general hedge accounting standard. The mandatory effective date of IFRS 9 is for annual periods beginning on or after January 1, 2018 and must be applied retrospectively with some exemptions. Early adoption is permitted. The Company intends to adopt IFRS 9 in its consolidated financial statements beginning April 1, 2018. The Company does not expect IFRS 9 to have a material impact on the consolidated financial statements because of the nature of the Company's operations and the types of financial assets that it holds.
(ii) IFRS 15 Revenue from Contracts with Customers
Replaces the guidance in IAS 11 Construction Contracts, IAS 18 Revenue, IFRIC 13 Customer Loyalty Programmes, IFRIC 15 Agreements for the Construction of Real Estate, IFRIC 18 Transfer of Assets from Customers, and SIC 31 Revenue - Barter Transactions Involving Advertising Services with a single model that applies to contracts with customers and two approaches to recognizing revenue: at a point in time or over time. The effective date for IFRS 15 is for annual periods beginning on or after January 1, 2018. IFRS 15 is available for early adoption. The Company intends to adopt IFRS 15 in its consolidated financial statements for the annual period beginning April 1, 2018.
While we are continuing to assess the impact of the new standard, we currently believe that the most significant impact relates to our annuity agreements, which include term-based software licenses bundled with maintenance. Under the current standards, the revenue attributable to these software licenses is recognized on a straight-line basis over the license period. Under the new standard, the portion of the agreement fee that relates to the software license will be recognized as revenue upon delivery of the software license. We do not expect IFRS 15 to have a substantial impact on revenue related to our maintenance agreements, perpetual licenses, and professional services.
(iii) IFRS 16 Leases
Replaces the guidance in IAS 17 Leases and requires the recognition of most leases on the balance sheet. IFRS 16 effectively removes the classification of leases as either finance or operating leases and treats all leases as finance leases for lessees with exemptions for short-term leases where the term is twelve months or less and for leases of low value items. IFRS 16 is effective January 1, 2019, with earlier adoption permitted. The Company intends to adopt IFRS 16 in its consolidated financial statements for the annual period beginning April 1, 2019. The extent of the impact of adoption of the standard has not yet been determined.
4. Property and Equipment:
| Cost | Computer | Furniture and | Leasehold | |||||
| (thousands of $) | Equipment | Equipment | Improvements | Total | ||||
| Balance at April 1, 2015 | 6,545 | 1,863 | 2,940 | 11,348 | ||||
| Additions | 462 | 107 | 1,340 | 1,909 | ||||
| Disposals | (406 | ) | - | - | (406 | ) | ||
| Balance at March 31, 2016 | 6,601 | 1,970 | 4,280 | 12,851 | ||||
| Balance at April 1, 2016 | 6,601 | 1,970 | 4,280 | 12,851 | ||||
| Additions | 1,146 | 1,399 | 12,176 | 14,721 | ||||
| Disposals | (1,130 | ) | (72 | ) | (70 | ) | (1,272 | ) |
| Balance at March 31, 2017 | 6,617 | 3,297 | 16,386 | 26,300 | ||||
| Accumulated Depreciation | ||||||||
| (thousands of $) | ||||||||
| Balance at April 1, 2015 | (4,956 | ) | (1,428 | ) | (2,246 | ) | (8,630 | ) |
| Depreciation charge for the year | (951 | ) | (178 | ) | (253 | ) | (1,382 | ) |
| Disposals | 406 | - | - | 406 | ||||
| Balance at March 31, 2016 | (5,501 | ) | (1,606 | ) | (2,499 | ) | (9,606 | ) |
| Balance at April 1, 2016 | (5,501 | ) | (1,606 | ) | (2,499 | ) | (9,606 | ) |
| Depreciation charge for the year | (805 | ) | (133 | ) | (155 | ) | (1,093 | ) |
| Disposals | 1,130 | 72 | 70 | 1,272 | ||||
| Balance at March 31, 2017 | (5,176 | ) | (1,667 | ) | (2,584 | ) | (9,427 | ) |
| Carrying Amounts | ||||||||
| At March 31, 2016 | 1,100 | 364 | 1,781 | 3,245 | ||||
| At March 31, 2017 | 1,441 | 1,630 | 13,802 | 16,873 | ||||
5. Trade Payables and Accrued Liabilities:
| (thousands of $) | March 31, 2017 | March 31, 2016 | |
| Trade payables | 604 | 248 | |
| Employee salaries, commissions and benefits payable | 3,219 | 4,229 | |
| Accrued liabilities and other payables | 5,508 | 3,050 | |
| 9,331 | 7,527 |
6. Revenue:
| Years ended March 31, | 2017 | 2016 | |
| (thousands of $) | |||
| Software licenses | 70,234 | 74,974 | |
| Professional services | 4,863 | 5,824 | |
| 75,097 | 80,798 |
7. Research and Development Costs:
| Years ended March 31, | 2017 | 2016 | ||
| (thousands of $) | ||||
| Research and development | 17,842 | 18,366 | ||
| SR&ED investment tax credits | (1,419 | ) | (1,501 | ) |
| 16,423 | 16,865 |
8. Personnel Expenses:
| Years ended March 31, | 2017 | 2016 | |
| (thousands of $) | |||
| Salaries, commissions and short-term employee benefits | 30,961 | 33,003 | |
| Stock-based compensation (note 11(d)) | 2,144 | 2,918 | |
| 33,105 | 35,921 |
9. Finance Income and Finance Costs:
| Years ended March 31, | 2017 | 2016 | ||
| (thousands of $) | ||||
| Interest income | 551 | 549 | ||
| Net foreign exchange gain | 320 | - | ||
| Finance income | 871 | 549 | ||
| Net foreign exchange loss | - | (954 | ) | |
| Finance costs | - | (954 | ) | |
10. Income and Other Taxes:
The major components of income tax expense are as follows:
| Years ended March 31, | 2017 | 2016 | ||
| (thousands of $) | ||||
| Current year income taxes | 9,850 | 10,208 | ||
| Adjustment for prior year | 65 | (194 | ) | |
| Current income taxes | 9,915 | 10,014 | ||
| Deferred tax expense | 54 | 30 | ||
| Foreign withholding and other taxes (recovery) | (46 | ) | 285 | |
| 9,923 | 10,329 | |||
The provision for income and other taxes reported differs from the amount computed by applying the combined Canadian Federal and Provincial statutory rate to the profit before income and other taxes.
The reasons for this difference and the related tax effects are as follows:
| Years ended March 31, | 2017 | 2016 | ||
| (thousands of $, unless otherwise stated) | ||||
| Combined statutory tax rate | 27.00 | % | 26.50 | % |
| Expected income tax | 9,232 | 9,442 | ||
| Non-deductible costs | 759 | 799 | ||
| Effect of tax rates in foreign jurisdictions | (5 | ) | 60 | |
| Withholding taxes | (89 | ) | 188 | |
| Adjustment for prior year | 65 | (194 | ) | |
| Other | (39 | ) | 34 | |
| 9,923 | 10,329 |
The components of the Company's deferred tax liability are as follows:
| (thousands of $) | March 31, 2017 | March 31, 2016 | ||
| Tax liability on SR&ED investment tax credits | (275 | ) | (287 | ) |
| Tax asset on property and equipment | 21 | 88 | ||
| Net deferred tax liability | (254 | ) | (199 | ) |
All movement in deferred tax assets and liabilities is recognized through net income of the respective period.
Prepaid income taxes and current income taxes payable have not been offset as the amounts relate to income taxes levied by different tax authorities on different taxable entities.
11. Share Capital:
(a) Authorized:
An unlimited number of Common Shares, an unlimited number of Non-Voting Shares, and an unlimited number of Preferred Shares, issuable in series.
(b) Issued:
| (thousands of shares) | Common Shares | |
| Balance, April 1, 2015 | 78,487 | |
| Issued for cash on exercise of stock options | 921 | |
| Common shares buy-back | (589 | ) |
| Balance, March 31, 2016 | 78,819 | |
| Balance, April 1, 2016 | 78,819 | |
| Issued for cash on exercise of stock options | 663 | |
| Balance, March 31, 2017 | 79,482 | |
Subsequent to March 31, 2017, 53,000 stock options were exercised for cash proceeds of $484,000.
On May 20, 2015, the Board of Directors considered the merits of renewing the Company's shareholder rights plan on or before the third-year anniversary of shareholder approval of the plan and determined that it was in the best interest of the Company to continue to have a shareholder rights plan in place. Upon careful review, the Board of Directors agreed to approve an amended and restated rights plan (the "Amended and Restated Rights Plan") between the Company and Valiant Trust Company (which has since been succeeded by Computershare Trust Company of Canada as the Company's transfer agent and registrar). The Amended and Restated Rights Plan is similar in all respects to the existing shareholder rights plan, with the exception of certain minor amendments. The Amended and Restated Rights Plan was approved by the Company's shareholders on July 9, 2015.
(c) Common Shares Buy-back:
On May 21, 2015, the Company announced a Normal Course Issuer Bid ("NCIB") commencing on May 25, 2015 to purchase for cancellation up to 7,447,000 of its Common Shares. During the year ended March 31, 2016, 589,000 Common Shares were purchased at market price for a total cost of $6,906,000.
On May 20, 2016, the Company announced a NCIB commencing on May 25, 2016 to purchase for cancellation up to 7,485,000 of its Common Shares. During the year ended March 31, 2017, no Common Shares were purchased.
(d) Stock-Based Compensation:
(i) Stock Option Plan
The Company adopted a rolling stock option plan as of July 13, 2005, which was reaffirmed by the Company's shareholders on July 10, 2014, which allows it to grant options to acquire Common Shares of up to 10% of the outstanding Common Shares at the date of grant. Based on this calculation, at March 31, 2017, the Company could grant up to 7,948,000 stock options. Pursuant to the stock option plan, the maximum term of an option granted cannot exceed five years from the date of grant. The outstanding stock options vest as to 50% after the first year anniversary from date of grant and then vest as to 25% of the total options granted after each of the second and third year anniversary dates.
The following table outlines changes in stock options:
| Years ended March 31, | 2017 | 2016 | |||||
| (thousands except per share amounts) | |||||||
| Weighted | Weighted | ||||||
| Number of | Average | Number of | Average | ||||
| Options | Exercise Price | Options | Exercise Price | ||||
| (thousands) | ($/share) | (thousands) | ($/share) | ||||
| Outstanding at beginning of period | 7,182 | 11.54 | 7,000 | 10.76 | |||
| Granted | 906 | 9.78 | 1,265 | 12.32 | |||
| Exercised | (663 | ) | 7.43 | (921 | ) | 6.52 | |
| Forfeited/expired | (221 | ) | 11.80 | (162 | ) | 12.48 | |
| Outstanding at end of period | 7,204 | 11.69 | 7,182 | 11.54 | |||
| Options exercisable at end of period | 5,224 | 11.82 | 4,379 | 10.89 |
The range of exercise prices of stock options outstanding and exercisable at March 31, 2017 is as follows:
| Weighted Average | Outstanding | Exercisable | |||||||
| Exercise Price ($/option) |
Number of Options |
|
Remaining Contractual Life |
|
Weighted Average Exercise Price |
|
Number of Options |
|
Weighted Average Exercise Price |
| (thousands) | (years) | ($/option) | (thousands) | ($/option) | |||||
| 8.96 to 9.55 | 1,068 | 0.4 | 9.09 | 1,065 | 9.09 | ||||
| 9.56 to 9.78 | 873 | 4.4 | 9.78 | - | - | ||||
| 9.79 to 12.26 | 2,074 | 1.4 | 12.18 | 2,057 | 12.19 | ||||
| 12.27 to 12.85 | 1,208 | 3.4 | 12.32 | 613 | 12.32 | ||||
| 12.86 to 14.97 | 1,981 | 2.4 | 13.04 | 1,489 | 13.04 | ||||
| 7,204 | 2.2 | 11.69 | 5,224 | 11.82 |
The fair value of stock options granted was estimated using the Black-Scholes option pricing model under the following
assumptions:
| Years ended March 31, | 2017 | 2016 | |
| Fair value at grant date ($/option) | 1.29 to 1.54 | 1.44 to 2.39 | |
| Share price at grant date ($/share) | 8.96 to 10.16 | 11.06 to 13.98 | |
| Risk-free interest rate (%) | 0.52 to 0.73 | 0.41 to 0.87 | |
| Estimated hold period prior to exercise (years) | 3 to 4 | 2 to 4 | |
| Volatility in the price of common shares (%) | 29 to 31 | 25 to 28 | |
| Dividend yield per common share (%) | 4.03 to 4.65 | 2.92 to 3.69 |
(ii) Share Appreciation Rights Plan
The Company adopted a share appreciation rights plan in November 2015. A share appreciation right ("SAR") entitles the holder to receive a cash payment equal to the difference between the stated exercise price and the market price of the Company's Common Shares on the date the SAR is exercised. The SARs are granted to executive officers and employees residing and working outside of Canada. The outstanding SARs vest as to 50% after the first year anniversary from date of grant and then vest as to 25% of the total awards granted after each of the second and third year anniversary dates. The SARs have a five-year life.
The following table outlines changes in SARs:
| Years ended March 31, | 2017 | 2016 | |||||
| (thousands except per share amounts) | |||||||
| |
Number of SARs (thousands) |
|
Weighted Average Exercise Price ($/SAR) |
|
Number of SARs (thousands) |
|
Weighted Average Exercise Price ($/SAR) |
| Outstanding at beginning of period | - | - | - | - | |||
| Granted | 222 | 9.78 | - | - | |||
| Exercised | - | - | - | - | |||
| Forfeited | - | - | - | - | |||
| Outstanding at end of period | 222 | 9.78 | - | - | |||
| SARs exercisable at end of period | - | - | - | - |
Stock-Based Compensation Expense
The following table summarizes stock-based compensation expense:
| Years ended March 31, | 2017 | 2016 | |
| (thousands of $) | |||
| Stock option plan | 1,963 | 2,918 | |
| Share appreciation rights plan | 181 | - | |
| Total stock-based compensation expense | 2,144 | 2,918 |
Liability Recognized for Share-Based Compensation
The fair value of SARs recorded in trade payables and accrued liabilities was $181,000 at March 31, 2017 ($nil at March 31, 2016).
(e) Earnings Per Share:
The following table summarizes the earnings and weighted average number of Common Shares used in calculating basic and diluted earnings per share:
| Years ended March 31, | 2017 | 2016 | |||||||||
| (thousands except per share amounts) | |||||||||||
Earnings ($) |
Weighted Average Shares Outstanding |
Earnings Per Share ($/share) |
Earnings ($) |
Weighted Average Shares Outstanding | Earnings Per Share ($/share) |
||||||
| Basic | 24,269 | 79,171 | 0.31 | 25,302 | 78,751 | 0.32 | |||||
| Dilutive effect of stock options | 117 | 614 | |||||||||
| Diluted | 24,269 | 79,288 | 0.31 | 25,302 | 79,365 | 0.32 |
During the year ended March 31, 2017, Nil options (2016 - 1,000) were excluded from the computation of the weighted-average number of diluted shares outstanding because their effect was not dilutive.
12. Capital Management:
The Company's objectives in managing capital are to ensure sufficient liquidity to pursue its strategy of organic growth combined with strategic acquisitions and to maximize the return to its shareholders. The capital structure of the Company consists of cash, credit facilities and shareholders' equity. The Company does not have any externally imposed capital requirements and does not presently utilize any quantitative measures to monitor its capital.
The Company's policy is to pay quarterly dividends based on the Company's overall financial performance and cash flow generation. Decisions on dividend payments are made on a quarterly basis by the Board of Directors. There can be no assurance as to the amount or payment of such dividends in the future.
Since November 2002, the Company embarked on a series of normal course issuer bids to buy back its shares. Reference is made to note 11(c).
The Company makes adjustments to its capital structure in light of general economic conditions and the Company's working capital requirements. In order to maintain or adjust its capital structure, the Company, upon approval from its Board of Directors, may pay dividends, buy back shares or undertake other activities as deemed appropriate under the specific circumstances. The Board of Directors reviews and approves any material transactions not in the ordinary course of business.
13. Financial Instruments and Risk Management:
(i) Classification of financial instruments
| Classification | Measurement | ||
| Cash | Loans and receivables | Amortized cost | |
| Trade and other receivables | Loans and receivables | Amortized cost | |
| Trade payables and accrued liabilities | Other financial liabilities | Amortized cost |
(ii) Fair values of financial instruments
The carrying values of cash, trade and other receivables, trade payables and accrued liabilities approximate their fair values due to the short-term nature of these instruments.
Overview:
The Company is exposed to risks of varying degrees of significance and likelihood, which could affect its ability to achieve its strategic objectives for growth. The main objectives of the Company's risk management process are to ensure that risks are properly identified and that the capital base is adequate in relation to those risks. The principal financial risks to which the Company is exposed are described below:
(a) Credit Risk:
Credit risk is the risk of an unexpected loss if a customer or third party to a financial instrument fails to meet its contractual obligation and arises principally from the Company's trade and other receivables. The amounts reported in the statements of financial position for trade receivables are net of allowances for bad debts, estimated by the Company's management based on prior experience and their assessment of the current economic environment.
The Company's trade receivables consist primarily of balances from customers operating in the oil and gas industry, both domestically and internationally, as the Company sells its products and services in approximately 60 countries worldwide. Some of these countries have greater economic and political risk than experienced in North America, and as a result there may be greater risk associated with sales in those jurisdictions. The Company manages this risk by invoicing for the full license term in advance for the majority of software license sales and by invoicing as frequently as the contract allows for consulting and contract research services. In cases where collectability is not deemed probable, revenue is recognized upon receipt of cash, providing all other criteria have been met. Historically, the Company has not experienced any significant losses related to individual customers or groups of customers in any particular geographic area; therefore, no allowance for doubtful accounts has been established at March 31, 2017 and 2016.
As at March 31, 2017, the Company has a concentration of credit risk with 15 domestic and international customers who represent 82% of trade receivables (2016 - 12 customers; 79%).
The carrying amount of trade and other receivables represents the maximum credit exposure. The maximum exposure to credit risk at March 31, 2017 was $25.3 million (2016 - $21.1 million). The aging of trade and other receivables at the reporting date was:
| (thousands of $) | March 31, 2017 | March 31, 2016 | |
| Current | 7,626 | 6,067 | |
| 31-60 days | 13,394 | 11,038 | |
| 61-90 days | 2,516 | 1,830 | |
| Over 90 days | 1,769 | 2,158 | |
| Balance, end of year | 25,305 | 21,093 |
The Company assesses the creditworthiness of its customers on an ongoing basis and it regularly monitors the amount and age of balances outstanding. Payment terms with customers are 30 days from invoice date; however, industry practice can extend these terms. Accordingly, the Company views the credit risks on these amounts as normal for the industry.
The Company minimizes the credit risk of cash by depositing only with a reputable financial institution in highly liquid interest-bearing cash accounts.
(b) Market Risk:
Market risk is the risk that changes in market prices of the foreign exchange rates and interest rates will affect the Company's income or the value of its financial instruments.
(i) Foreign Exchange Risk
The Company operates internationally and primarily prices its products in either the Canadian or US dollar. This gives rise to exposure to market risks from changes in the foreign exchange rates between the Canadian and US dollar. Approximately 78% (2016 - 76%) of the Company's revenues for the year ended March 31, 2017 were denominated in US dollars, and at March 31, 2017, approximately US $20.8 million (2016 - US $15.0 million) of the Company's working capital was denominated in US dollars. The Company currently does not use derivative instruments to hedge its exposure to those risks, but as approximately 26% (2016 - 28%) of the Company's total costs are also denominated in US dollars, they provide a partial economic hedge against the fluctuation in this currency exchange. In addition, the Company manages levels of foreign currency held by converting excess US dollars into Canadian dollars at spot rates.
The Company's operations are exposed to currency risk on US-dollar denominated financial assets and liabilities with fluctuations in the rate recognized as foreign exchange gains or losses in the consolidated statement of operations and comprehensive income. It is estimated that a one cent change in the US dollar would result in a net change of approximately $152,000 to equity and net income for the year ended March 31, 2017. A weaker US dollar with respect to the Canadian dollar will result in a negative impact, while the reverse would result from a stronger US dollar.
(ii) Interest Rate Risk
The Company has significant cash balances and no interest-bearing debt. The Company's policy is to invest excess cash in interest-bearing deposits and/or guaranteed investment certificates issued by a reputable financial institution. The Company is exposed to interest cash flow risk from changes in interest rates on its cash balances. Based on the March 31, 2017 cash balance, each 1% change in the interest rate on the Company's cash balance would change equity and net income for the year ended March 31, 2017 by approximately $462,000.
(c) Liquidity Risk:
Liquidity risk is the risk that the Company is not able to meet its financial obligations as they fall due or can do so only at excessive cost. The Company manages liquidity risk through the management of its capital structure as outlined in note 12. The Company's growth is financed through a combination of the cash flows from operations and its cash balances on hand. Given the Company's available liquid resources as compared to the timing of the payments of its liabilities, management assesses the Company's liquidity risk to be low. The Company monitors its expenditures by preparing annual budgets that are periodically updated. At March 31, 2017, the Company has significant cash balances in excess of its obligations and approximately $0.8 million of the line of credit (note 15) available for its use.
14. Commitments:
(a) Research Commitments:
Until January 1, 2017, the Company was the operator of a joint project, a collaborative effort with its partners Shell International Exploration and Production B.V. and Petroleo Brasileiro S.A. ("Petrobras"), to jointly develop CoFlow, the newest generation of reservoir and production system simulation software (note 18).
Effective January 1, 2017, Petrobras' financial participation in the joint development project has ended. Under the new five-year agreement between CMG and Shell Global Solutions International B.V. ("Shell"), CMG is responsible for the research and development costs of CoFlow, while Shell will provide a fixed fee contribution for the continuing development of the software . The Company's revenue and costs associated with CoFlow are estimated to be $4.0 million and $8.3 million, respectively, for fiscal 2018.
(b) Lease Commitments:
The Company has operating lease commitments relating to its office premises with the minimum annual lease payments as follows:
| Years ended March 31, | 2017 | 2016 | |
| (thousands of $) | |||
| Less than one year | 4,333 | 2,482 | |
| Between one and five years | 19,335 | 17,566 | |
| More than five years | 82,304 | 81,969 | |
| 105,972 | 102,017 |
The Company leases a number of properties under operating leases. During the year ended March 31, 2017, $2.8 million (2016 - $2.7 million) was recognized as an expense in the statement of operations and comprehensive income in respect of operating leases related to office premises.
The Company entered into a twenty year operating lease commitment relating to its new Calgary headquarters commencing in calendar 2017. The minimum annual lease payments have been reflected in the above schedule. The Company invested $15.3 million in infrastructure for the new headquarters over the last three fiscal years, of which $13.9 million was incurred in the year ended March 31, 2017 ($10.1 million of that was paid in cash and the remaining $3.8 million is included in trade payables and accrued liabilities as at March 31, 2017). The total budget for infrastructure is $16.0 million, and the remainder of the budget is expected to be spent in the first quarter of fiscal 2018.
15. Line Of Credit:
The Company has arranged for a $1.0 million line of credit with its principal banker, which can be drawn down by way of a demand operating credit facility or may be used to support letters of credit. As at March 31, 2017, US $215,000 (2016 - US $215,000) had been reserved on this line of credit for letters of credit supporting performance bonds.
16. Segmented Information:
The Company is organized into one operating segment represented by the development and licensing of reservoir simulation software. The Company provides professional services, consisting of support, training, consulting and contract research activities, to promote the use and development of its software; however, these activities are not evaluated as a separate business segment.
Revenues and property and equipment of the Company arise in the following geographic regions:
| (thousands of $) | Revenue | Property and equipment | |||||
| Years ended March 31, | As at March 31, | ||||||
| 2017 | 2016 | 2017 | 2016 | ||||
| Canada | 21,459 | 26,121 | 16,463 | 2,694 | |||
| United States | 16,928 | 19,103 | 192 | 248 | |||
| South America | 13,065 | 9,837 | 173 | 245 | |||
| Eastern Hemisphere(1) | 23,645 | 25,737 | 45 | 58 | |||
| 75,097 | 80,798 | 16,873 | 3,245 | ||||
| (1) | Includes Europe, Africa, Asia and Australia. |
No customer represented 10% or more of total revenue in the years ended March 31, 2017 and 2016.
17. Subsidiaries:
CMG is the beneficial owner of the entire issued share capital and controls all the votes of its subsidiaries. The principal activities of all the subsidiaries are the sale and support for the use of CMG's software licenses. Transactions between subsidiaries are eliminated on consolidation.
The following is the list of CMG's subsidiaries:
| Subsidiary | Country of Incorporation |
| Computer Modelling Group Inc. | United States |
| CMG Middle East FZ LLC | Dubai, United Arab Emirates |
| CMG (Europe) Limited | United Kingdom |
18. Joint Operation:
Until January 1, 2017, the Company was the operator of a joint project, a collaborative effort with its partners Shell International Exploration and Production B.V. and Petrobras, to jointly develop CoFlow, the newest generation of reservoir and production system simulation software. Accordingly, until January 1, 2017, the Company recorded its proportionate share of costs incurred on the project (37.04%) as research and development costs within the consolidated statement of operations and comprehensive income.
Effective January 1, 2017, Petrobras' financial participation in the joint development project ended. Under the new five-year agreement between CMG and Shell, CMG is responsible for the research and development costs of CoFlow, while Shell will provide a fixed fee contribution. The new agreement with Shell does not meet the definition of a joint arrangement, and as of January 1, 2017, the Company discontinued the use of proportionate consolidation to account for CoFlow.
During the first nine months of the current fiscal year, under the proportionate consolidation method, CMG recorded $4.1 million (year ended March 31, 2016 - $5.9 million) of CoFlow costs in its consolidated statement of operations and comprehensive income.
Additionally, under the previous arrangement the Company was entitled to charge its partners for various services provided as operator, which were recorded in revenue as professional services and amounted to $2.1 million for the first nine months of the current fiscal year (year ended March 31, 2016 - $2.8 million).
For the three months ended March 31, 2017, subsequent to discontinuing proportionate consolidation, CoFlow revenue of $1.1 million was recorded to professional services revenue and CoFlow costs of $1.9 million were recorded to research and development expenses.
19. Related Parties:
(a) Intercompany Transactions:
The Company has three wholly owned subsidiaries (note 17) that have intercompany transactions under the normal course of operations and are eliminated upon consolidation.
(b) Key Management Personnel Compensation:
The key management personnel of the Company are the members of the Company's executive management team and Board of Directors and control approximately 4.7% of the outstanding shares of CMG at March 31, 2017.
In addition to their salaries and director fees, as applicable, directors and executive officers also participate in the Company's stock option plan or SAR plan (note 11(d)), which are available to almost all employees of the Company.
Key management personnel compensation comprised the following:
| Years ended March 31, | 2017 | 2016 | |
| (thousands of $) | |||
| Salaries, bonus and employee benefits | 4,136 | 4,215 | |
| Stock-based compensation | 644 | 829 | |
| 4,780 | 5,044 |
20. Subsequent Event:
On May 18, 2017, the Board of Directors declared a quarterly cash dividend of $0.10 per share on its Common Shares, payable on June 15, 2017, to all shareholders of record at the close of business on June 7, 2017.
Contact Information:
Kenneth M. Dedeluk
President & CEO
(403) 531-1300
ken.dedeluk@cmgl.ca
Computer Modelling Group Ltd.
Sandra Balic
Vice President, Finance & CFO
(403) 531-1300
sandra.balic@cmgl.ca
www.cmgl.ca