VANCOUVER, BRITISH COLUMBIA--(Marketwire - Aug. 8, 2011) - Deans Knight Income Corporation (the "Company") (TSX:DNC) is pleased to release its interim Financial Statements and Management Report of Fund Performance for the period ended June 30, 2011.
These documents can be found on SEDAR at www.sedar.com or the Company's website: www.dkincomecorp.com.
Forward-Looking Statements
This press release contains forward-looking statements. More particularly, this press release contains forward-looking statements concerning the Company's corporate objectives, the investment of the Company's proceeds from the sale of investments previously made, availability of tax losses and deductions, the anticipated total return to the Company's shareholders and the Company's intention to pay out earned income in the form of monthly dividends. Although the Company believes that the expectations reflected in these forward-looking statements are reasonable, undue reliance should not be placed on them because the Company can give no assurance that they will prove to be correct since forward-looking statements address future events and conditions and by their very nature, involve inherent risks and uncertainties. The forward-looking statements contained in this press release are made as of the date hereof and the Company disclaims any intention or obligation to update or revise any forward-looking statements whether as a result of new information, future events or otherwise, unless so required by applicable securities laws.
INTERIM MANAGEMENT REPORT OF FUND PERFORMANCE
For the period from
January 1, 2011 to June 30, 2011
This interim management report of fund performance (the "Report") contains financial highlights of Deans Knight Income Corporation (the "Company"). This Report should be read in conjunction with the interim financial statements of the Company for the six month period ending June 30, 2011 (the "Financial Statements"), which, if not included with this Report, can be obtained at your request, at no cost by emailing info@dkincomecorp.com, visiting our website at www.dkincomecorp.com for contact details or on SEDAR at www.sedar.com. Shareholders may also contact us to request a free copy of the Company's proxy voting policies and procedures, proxy voting disclosure record or quarterly portfolio disclosure.
A Note on Forward-Looking Statements
This Report contains certain forward-looking statements. These statements relate to future events or future performance, including the Company's targeted dividend payout, investment strategy, behaviour of financial markets and reflect the Company's expectations regarding the growth, results of operations, performance and business prospects and opportunities of the Company and its investments. Such forward-looking statements reflect the Company's current beliefs and are based on information currently available to the Company. In some cases, forward-looking statements can be identified by terminology such as "may", "will", "should", "expect", "plan", "anticipate", "believe", "estimate", "predict", "potential", "continue" or the negative of these terms or other comparable terminology. With respect to such forward-looking statements, the Company has made assumptions regarding, among other things, what type of debt securities will be included in its investment portfolio. A number of factors could cause actual events or results to differ materially from the results discussed in the forward-looking statements. In evaluating these statements, prospective investors should specifically consider various factors, including the risks outlined under "Risk Factors" in the AIF (as defined herein), which may cause actual results to differ materially from any forward-looking statement. Although the forward-looking statements contained in the AIF are based upon what the Company believes to be reasonable assumptions, the Company cannot assure investors that actual results will be consistent with these forward-looking statements. Forward-looking statements are made as of the date of this Report and, other than as required by applicable law, the Company assumes no obligation to update or revise them to reflect new events or circumstances.
This Report also contains certain financial and operational information obtained from public sources in respect of certain companies included in the Company's investment portfolio. While management believes this data to be reliable, such information is subject to variations and cannot be verified due to limits on the availability and reliability of data inputs, the nature of the data gathering process and other limitations and uncertainties inherent in such information. Accordingly, the accuracy, currency and completeness of this information cannot be guaranteed. The Company has not independently verified any of the data from third party sources referred to in this Report or ascertained the underlying assumptions relied upon by such sources.
Investment Objective and Strategies
The Company is a closed-end, non-redeemable investment company focused on investing in corporate debt securities. The Company's assets are actively managed by Deans Knight Capital Management Ltd. ("Deans Knight"), a respected British Columbia-based investment firm focused on managing high income and growth mandates for high net worth individuals. Deans Knight, formed in 1992, has an experienced management team and a long history of successful investing in corporate debt securities.
The Company's investment objectives are to: (i) maximize the total return for Shareholders, consisting of dividend income and capital appreciation; and (ii) provide Shareholders (as defined herein) with monthly dividends, which have, to date, been set at $0.0583 per month. The Company intends to achieve these objectives by investing primarily in corporate debt securities rated BBB or below by Standard & Poor's Rating Services ("S&P") or an equivalent rating by another nationally recognized statistical rating organization. The Company may also invest in investment grade debt securities rated above BBB and non-rated debt securities from time to time.
The Company believes there are attractive investment opportunities today in owning corporate debt of businesses with tangible assets, strong cash flows and reasonable leverage.
When evaluating bonds to purchase for the Company, Deans Knight focuses on the following:
- amount of security or collateral within a business to offset the value of the bonds;
- the position of the debt in the capital structure;
- covenants;
- liquidity;
- the business's ability to reduce or refinance the debt; and
- the overall term of the debt and yield to bondholders.
Deans Knight employs the above credit-based analysis to identify corporate debt for inclusion in the Company's investment portfolio with attractive valuations in order to maintain its targeted dividend payment.
Risk
The overall risks of the Company are as described in its annual information form dated March 15, 2011 (the "AIF"). The Company does not believe there have been any changes over the financial period that has affected the overall level of risk associated with an investment in the Company.
Prior to the reorganization and change in business, as discussed in the notes of the Financial Statements, the Company had generated significant tax losses and other tax attributes as a result of its prior businesses and research activities. The Company has recorded, as a tax asset, the full amount of the potential tax benefit of such items to the extent of its projected taxable income. There is no guarantee that the tax authorities will allow the Company to deduct some or all of the tax losses and other attributes. Should the Company be denied the deductions, the recorded amount of the tax assets, as well as such amounts claimed to date, would be recorded as a charge to income. The total tax assets recognized and tax losses and other attributes claimed to date, which are subject to uncertainty, amount to $21,247,000, representing $2.02 per common share at June 30, 2011.
Given the type of investments made by the Company, an investment in the Company may be considered to be speculative. An investment in the Company is generally suitable for investors who are looking to receive income, yet who are willing to tolerate volatility in the value of their investment.
Results of Operations
As per the financial statements, the net assets of the Company at June 30, 2011 were $143,428,658, or $13.61 per common share, compared to $143,343,361, or $13.60 per common share at December 31, 2010. The net assets of the Company consisted of the following components:
                                                              June 30, 2011
                                --------------------------------------------
                                                  Per common
                                            $        share(1)             %
Investments(2)                    133,558,796          12.67           93.1
Cash and short-term deposits        2,618,721           0.25            1.8
Accrued income                      1,888,705           0.18            1.3
Prepaid expenses                      158,159           0.02            0.0
Future income tax asset(3)          5,870,000           0.56            4.1
Accounts payable and accrued
 liabilities                         (665,723)         (0.07)          (0.3)
                                --------------------------------------------
                                  143,428,658          13.61          100.0
                                --------------------------------------------
                                --------------------------------------------

(1) Based on 10,537,263 common shares, including 10,191,592 voting common
    shares and 345,671 non-voting common shares, as outlined in the notes
    to the Financial Statements.
(2) The details of the investments are outlined in the Summary of
    Investment Portfolio below.
(3) Refer to the Taxation note to the Financial Statements for more detail.

                                                          December 31, 2010
                                --------------------------------------------
                                                  Per common
                                            $        share(1)             %
Investments(2)                    128,449,450          12.19           89.6
Cash and short-term deposits        7,137,967           0.68            5.0
Accrued income                      1,808,756           0.17            1.2
Prepaid expenses                       89,662           0.01            0.1
Future income tax asset(3)          6,550,000           0.62            4.6
Accounts payable and accrued
 liabilities                         (692,474)         (0.07)          (0.5)
                                --------------------------------------------
                                  143,343,361          13.60          100.0
                                --------------------------------------------
                                --------------------------------------------

(1) Based on 10,537,263 common shares, including 10,191,592 voting common
    shares and 345,671 non-voting common shares, as outlined in the notes
    to the Financial Statements.
(2) The details of the investments are outlined in the Summary of Investment
    Portfolio below.
(3) Refer to the Taxation note to the Financial Statements for more detail.
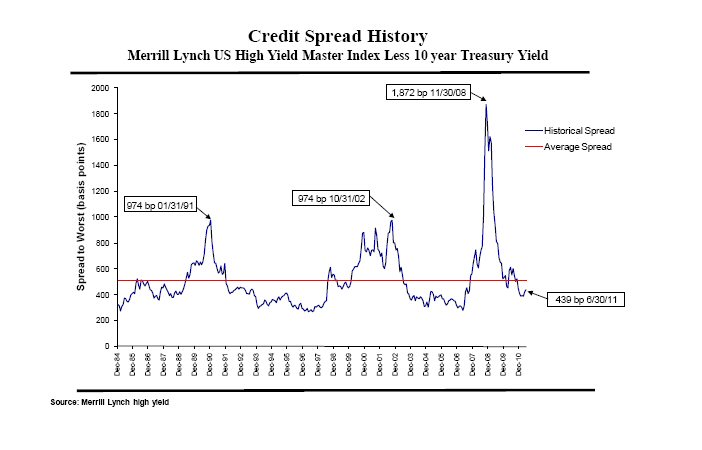
In early 2009, in the midst of the global recession and financial panic, non-investment grade corporate bond prices collapsed. The spread between high yield bonds and government bonds widened to unprecedented levels not seen before (see graph below).
http://media3.marketwire.com/docs/805dnc1.jpg
At that time, the Investment Manager felt strongly that the market was overreacting because of fear. It saw many opportunities where they believed that bonds were backed by solid assets, and in the unlikely case of default, full recovery of investments was reasonably assumed.
To take advantage of these opportunities, the Company raised $94,100,000 (net of offering costs of $6,268,900) by way of an initial public offering ("IPO") that closed on March 18, 2009. Although the recovery has been disappointing in some respects, unemployment remains stubbornly high and real estate continues to be a soft spot, confidence has gradually been restored. Non-investment grade bond prices have recovered and yield spreads have returned to normal levels.
The Company's net asset value has risen 36% since the IPO, excluding the $0.70 per share annual dividend we have maintained since June 30, 2009.
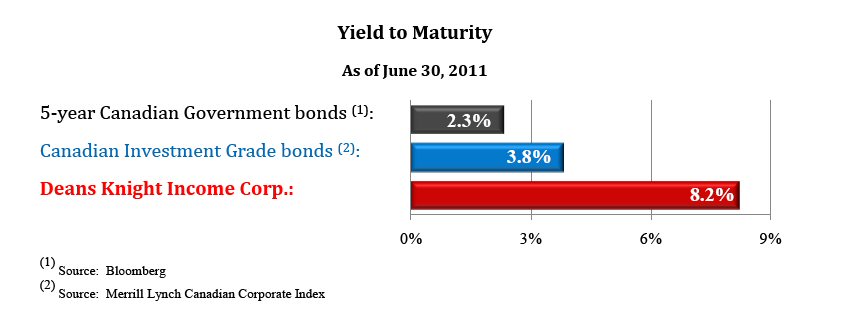
As we move through 2011, the U.S. economic recovery is slowing; China's growth is slowing; and Greece's debt woes have called the stability of the Eurozone into question. Nevertheless, the fundamentals of many companies, including the portfolio's investments, are stronger now than prior to the recession. Moreover, the average yield on the Company's bond holdings is still very attractive....double that of investment grade bonds and three times that of government bonds.
http://media3.marketwire.com/docs/805dnc2.jpg
Given the solid credit quality of the Company's holdings, the current 8.2% yield is very attractive compared to either government or investment grade bonds. The yields provided by government and investment grade bonds are far too low to compensate investors for the risk of rising interest rates. Further to this, the average duration of the Company's portfolio at June 30, 2011 is 4.2 years, compared to 4.7 years for 5-year Canadian Government Bonds' and 5.6 years for Canadian Investment Grade bonds.
The Company also attempts to add additional value, by opportunistically investing in private debt financings with equity incentives. In August 2009, the Company purchased a portion of a $10 million, 8% convertible debenture for Whitecap. The Whitecap Debenture had an exercise price of $2.88 and on December 8, 2010, the Company converted the Whitecap Debenture into equity. On June 30, 2011 Whitecap's share price closed at $6.27 per share. Whitecap has grown production from 850 barrels of oil equivalent per day ("boepd") to 6,000 boepd, 60% of which is oil, and the Company believes management can continue to grow production per share and create additional value for shareholders going forward. Deans Knight Income Corp. sold 52% of its holding in Whitecap at $6.16, but still holds 1,254,167 shares (5.5% of the Company's net asset value).
Recent Developments
Comparison of net asset value and net assets
National Instrument 81-106 ("NI 81-106") permits investment companies to have two different net asset values: (i) one for financial statements, which will be prepared in accordance with Canadian Generally Accepted Accounting Principles ("GAAP") including Section 3855 (and referred to as "net assets", previously disclosed as "GAAP Net Assets"); and (ii) another for all other purposes, including unit pricing for investor transactions (referred to as "net asset value", previously referred to as "Pricing NAV"). The main difference in calculating net assets and net asset value is that GAAP requires bid price to be used in valuing securities traded in an active market where quoted prices are readily and regularly available, rather than the use of a price between the bid and the ask price currently used for determining net asset value. This difference results in a difference of approximately $0.02 per common share at June 30, 2011, as outlined in the notes to the Financial Statements.
International Financial Reporting Standards
The Company is required to adopt international financial reporting standards ("IFRS"). The Canadian Accounting Standards Board (AcSB) previously announced January 1, 2011 as the date international financial reporting standards (IFRS) will replace current Canadian standards and interpretations as GAAP for publicly accountable enterprises, which include investment companies.
However, on January 12, 2011, the AcSB issued a decision to defer adoption of IFRS for investment companies until years beginning on or after January 1, 2013. This is a further delay from the previously issued exposure draft of proposed accounting standard to defer IFRS for investment companies currently applying Accounting Guideline 18 - Investment Companies until years beginning on or after January 1, 2012.
Under the above noted decision, the Company's first set of financial statements to be reported on under IFRS will be for the semi-annual period ending June 30, 2013. These statements will include corresponding comparative financial information for 2012, including an opening statement of net assets as at January 1, 2012.
The Company has established a transition plan to ensure that it is able to meet its reporting requirements. The plan consists of three main elements, which include:
- Identifying differences between the current accounting policies of the Company, which reflect current Canadian GAAP, and those expected to apply under IFRS and the likely financial statement impact resulting from the adoption of IFRS;
- Analyzing the impact of the adoption of IFRS on business and reporting processes;
- Disclosing the qualitative impact in the December 31, 2009 management report of fund performance and disclosing the quantitative impact, if any, in the December 31, 2012 management report of fund performance.
Based on the Company's analysis of current accounting policies and presentation under GAAP against IFRS the adoption of IFRS is not expected to have a material effect on the Company's net assets or net assets per share. The primary impact will be in the areas of presentation and note disclosure. Further, the Company does not believe that the changeover to IFRS will materially affect the Company's existing business arrangements.
However, it should be noted that there are additional changes to IFRS expected during 2011 and 2012. This potential for change creates some uncertainty regarding the expected accounting standards that will be applicable upon the Company adopting IFRS. As such, the Company cannot conclusively determine the impact that the adoption of IFRS will have.
Throughout the remainder of 2011 and 2012, the Company will continue to monitor new standards and recommendations as they are issued by both the International Accounting Standards Board, who is responsible for the development and publication of IFRS, and the AcSB, to update its analysis as appropriate. By the fourth quarter of the year predating the required adoption, the Company expects to complete its analysis, determine overall financial statement presentation, and complete its assessment. Any changes required with respect to its business arrangements will then be adopted.
Related Party Transactions
The officers, and certain directors, of the Company are also employees of the Investment Advisor, Deans Knight Capital Management Ltd. These officers, and directors, are not paid by the Company. Deans Knight provides investment management services to the Company, as well as administration, financial reporting and other ancillary services required by a publicly listed company. Management fees, for the services outlined above, are computed and paid quarterly, at an annual rate of 1.5% of the net asset value plus applicable taxes, and adjusted for certain non-investment related assets.
For the six month period ended June 30, 2011, management fees totaled $1,165,607 (2010 - $980,755). In calculating the amount, the net asset value was reduced by the value of the future income tax asset included in the statement of net assets.
A director of the Company is a partner at a law firm that provides legal services to the Corporation. During the six month period ended June 30, 2011, the Corporation incurred $17,895 (2010 - $17,409) in legal services and disbursements received from this related party. At June 30, 2011, accounts payable and accrued liabilities include $1,532 (December 31, 2010 - $1,355) to the law firm for legal fees and disbursements, which have not been billed.
Financial Highlights
The following tables show selected key financial information about the Company and are intended to help you understand the Company's financial performance since it began operating its new business of investing in corporate debt in March 2009.
The Company's Net Assets per Common Share (1)

                                   Six months       Year ended December 31,
                                        ended
                                      June 30,
                                         2011           2010           2009
                                            $              $              $
----------------------------------------------------------------------------
Net assets, beginning of period         13.60          12.21           9.12
Increase (decrease) from
 operations
Total revenue                            0.52           0.95           0.62
Total expenses                          (0.14)         (0.25)         (0.20)
Realized gains (losses) for the
 period                                  0.41           1.82           1.25
Unrealized (losses) gains for
 the period                             (0.37)         (0.27)          1.21
Recovery of future income taxes         (0.06)         (0.16)          0.62
----------------------------------------------------------------------------
Total increase from operations           0.36           2.09           3.50
----------------------------------------------------------------------------
Dividends from income (3)               (0.35)         (0.70)         (0.41)
----------------------------------------------------------------------------
Net assets at end of period (4)         13.61          13.60          12.21
----------------------------------------------------------------------------
----------------------------------------------------------------------------

(1) The information is derived from the Company's audited annual and
    unaudited interim financial statements. Common shares outstanding are
    10,537,263, including 10,191,592 voting common shares and 345,671
    non-voting common shares.
(2) Net assets and dividends are based on the actual number of shares
    outstanding at the relevant time. The increase/decrease from operations
    is based on the weighted average number of shares outstanding over the
    period from the date the Company began operating its new business to
    December 31, 2009.
(3) Dividends were paid in cash.
(4) The net assets per share presented in the financial statements differs
    from the net asset value per share calculated for fund pricing purposes
    due to the provisions of CICA Handbook Section 3855. An explanation of
    the differences can be found in the notes to the financial statements.

Ratios and Supplemental Data       Six months       Year ended December 31,
                                        ended
                                      June 30,
                                         2011           2010           2009
                                            $              $              $
----------------------------------------------------------------------------
Net asset value (000's)               143,343        143,880        128,930
Number of common shares
outstanding (000's)                    10,537         10,537         10,537
Management expense ratio (1)
 (2)                                     1.56%          1.91%          5.51%
Portfolio turnover rate (3)              26.7%         86.60%         36.69%
Trading expense ratio (4)                0.00%          0.01%          0.01%
Net asset value per common
 share                                 $13.63         $13.65         $12.23
Closing market price - common
 share                                 $12.61         $12.54         $11.40

(1) Management expense ratio is based on total expenses for the period and
    is expressed as an percentage of weekly average net asset values over
    the period. For 2009, this ratio is calculated from the date the Company
    began operating its business as an investment fund, on March 17, 2009,
    to December 31, 2009.
(2) The Management expense ratio for 2009 includes offering costs for the
    IPO of $6,268,800 less the offsetting related future tax benefit of
    $1,692,500.
(3) The Company's portfolio turnover rate indicates how actively the
    Company manages its portfolio investments. A portfolio turnover rate of
    100% is equivalent to the Company buying and selling all of the
    securities in its portfolio once in the course of the year. The higher a
    portfolio turnover-rate in a year, the greater the trading costs payable
    by the Company in the year. There is not necessarily a relationship
    between a high turnover rate and the performance of the investment
    portfolio.
(4) The trading expense ratio represents total commissions and other
    portfolio transaction costs expressed as an annualized percentage of
    daily average net asset value during the period. As the purchasing and
    selling of bonds do not attract a commission from the buying or selling
    party.
Management Fees
Deans Knight provides investment management services to the Company, as well as administration, financial reporting and other ancillary services required by a publicly listed company. Management fees are computed and paid quarterly, at an annual rate of 1.5% of the net asset value plus applicable taxes, and adjusted for certain non-investment related assets.
Past Performance
This section shows the Company's past performance, since it began operating its business as an investment fund. The past performance information includes changes in net asset value and assumes the reinvestment of all dividends paid to common shareholders. It is important to note that the past performance will not necessarily indicate what performance in the future will be.
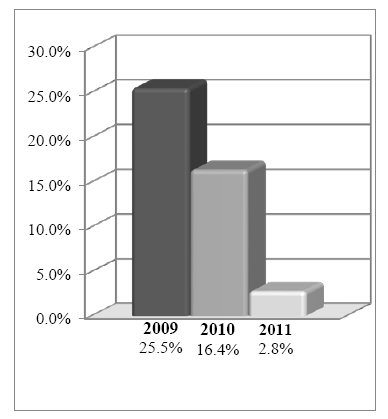
Year-by-year returns
The accompanying bar chart shows the Company's performance for the periods shown and illustrates how the Company's performance has changed from period to period. The bar chart shows, in percentage terms, how much an investment made when it began its operation as an investment fund, March 17, 2009 to December 31, 2009, how much an investment made for the year ended December 31, 2010, and how much an investment made for the six month period ending June 30, 2011.
http://media3.marketwire.com/docs/805dnc3.jpg
Summary of Investment Portfolio
----------------------------------------------------------------------------
Top 25 Investments % of Net
Asset Value
Paramount Resources Ltd. 8.250% 13-Dec-17 6.6
North American Energy 9.125% 7-Apr-17 6.1
Stone Energy Corp. 8.625% 1-Feb-17 6.0
Whitecap Resources Inc. N/A N/A 5.5
CCS Inc. 11.000% 15-Nov-15 5.4
Calfrac Holdings LP 7.500% 1-Dec-20 4.1
Southern Pacific Resource Corp. 10.750% 7-Jan-16 4.1
Mirabella Nickel Inc. 8.750% 15-Apr-18 4.0
Perpetual Energy Inc. 8.750% 15-Mar-18 3.5
Harvest Energy, Inc. 7.250% 30-Sep-13 3.3
Skylink Aviation Inc. 12.250% 15-Mar-16 3.3
Mercator Minerals 6.500% 3-Jan-13 3.1
Cott Beverages Inc. 8.375% 15-Nov-17 3.1
National Money Mart Company 10.375% 15-Dec-16 3.0
Cara Operations Ltd. 9.125% 1-Dec-15 2.7
Tembec Industries Inc. 11.250% 15-Dec-18 2.6
Trinidad Drilling Ltd. 7.875% 15-Jan-19 2.4
Gateway Casinos & 8.875% 15-Nov-17 2.0
Entertainment Inc.
Black Press Group 10.000% 4-Feb-14 1.9
Pacific Rubiales Energy 8.750% 10-Nov-16 1.9
Beazer Homes USA, Inc. 9.125% 15-Jun-18 1.9
Garda World Security Corp. 9.750% 15-Mar-17 1.8
Sure Energy Inc. 6.250% 21-Jan-14 1.7
Newalta Corp. 7.625% 23-Nov-17 1.6
McMoran Exploration 11.875% 15-Nov-14 1.4
----------------------------------------------------------------------------
Portfolio Composition % of Net
Asset Value
Equity and Warrants 5.7
Fixed Income
Canadian denominated in CAD 40.2
Canadian denominated in USD 24.8
United States denominated in USD 17.6
---------
82.6
---------
Convertible Debentures
Canadian denominated in CAD 3.3
Other Foreign denominated in AUD 1.1
Investment Portfolio 92.7
Cash & Short-term Deposits 1.8
Other Net Assets 5.5
---------
100.0
---------
---------
Sector Breakdown
Energy 57.0
Consumer Discretionary 9.6
Services 6.1
Materials & Metals 9.4
Forestry 3.8
Financial Services 3.0
Industrial/Manufacturing 3.8
---------
Investment Portfolio 92.7
Cash & Short-term Deposits 1.8
Other Net Assets 5.5
---------
100.0
---------
---------
Deans Knight Income Corporation
Financial Statements
June 30, 2011
(Unaudited)
Deans Knight Income Corporation
Statement of Net Assets
As at June 30, 2011 (Unaudited)
----------------------------------------------------------------------------
June 30, December 31,
2011 2010
$ $
Assets
Current
Investments - at fair value (cost - June 30,
2011 - $127,518,870;
December 31, 2010 - $118,563,957) 133,558,796 128,449,450
Cash and cash equivalents 2,618,721 7,137,967
Accrued interest receivable 1,888,705 1,808,756
Prepaid expenses 158,159 89,662
Future income tax benefits (note 8) 2,250,000 2,150,000
----------------------------------------------------------------------------
140,474,381 139,635,835
Non-current
Future income tax benefits (note 8) 3,620,000 4,400,000
----------------------------------------------------------------------------
144,094,381 144,035,835
----------------------------------------------------------------------------
Liabilities
Accounts payable and accrued liabilities (note 6) 665,723 692,474
----------------------------------------------------------------------------
Net Assets 143,428,658 143,343,361
----------------------------------------------------------------------------
----------------------------------------------------------------------------
Shareholders' Equity
Common shares (note 4) 99,366,429 99,366,429
Contributed surplus (note 4) 9,904,504 9,904,504
Retained earnings (note 5) 34,157,725 34,072,428
----------------------------------------------------------------------------
143,428,658 143,343,361
----------------------------------------------------------------------------
----------------------------------------------------------------------------
Number of common shares outstanding (note 4) 10,537,263 10,537,263
----------------------------------------------------------------------------
----------------------------------------------------------------------------
Net assets per common share (notes 8 and 11) 13.61 13.60
----------------------------------------------------------------------------
----------------------------------------------------------------------------
Contingencies (notes 2 and 8)
Commitment (note 10)
Subsequent events (note 12)
The accompanying notes are an integral part of these financial statements.
Deans Knight Income Corporation
Statement of Operations
Six-month period ended June 30, 2011 (Unaudited)
----------------------------------------------------------------------------
2011 2010
$ $
Investment income
Interest and other 5,459,044 5,036,042
----------------------------------------------------------------------------
Expenses
Management fees (note 6) 1,165,607 980,755
Public company reporting costs 93,067 72,699
Directors' fees and expenses 87,086 84,535
Audit, accounting and tax fees 37,043 53,384
Custodial fees 24,607 15,408
Legal fees 17,895 17,409
Independent Review Committee fees 4,500 4,500
----------------------------------------------------------------------------
1,429,805 1,228,690
----------------------------------------------------------------------------
Net investment income 4,029,239 3,807,352
----------------------------------------------------------------------------
Realized and unrealized gains (losses) on
investments
Net realized gain on securities sold (note 7) 2,064,001 2,572,267
Net realized gain on settlement of foreign
currency contracts (note 7) 2,203,559 444,042
Change in unrealized (depreciation) appreciation
on investments (4,457,177) 5,246,375
Unrealized appreciation (depreciation) on
foreign currency contracts 611,610 (1,438,353)
----------------------------------------------------------------------------
Net gain on investments 421,993 6,824,331
----------------------------------------------------------------------------
Increase in net assets from operations before
tax 4,451,232 10,631,683
Provision for future income tax (note 8) (680,000) (2,190,000)
----------------------------------------------------------------------------
Increase in net assets from operations 3,771,232 8,441,683
----------------------------------------------------------------------------
----------------------------------------------------------------------------
Increase in net assets from operations per
weighted average
common share (note 3) 0.36 0.80
----------------------------------------------------------------------------
----------------------------------------------------------------------------
The accompanying notes are an integral part of these financial statements.
Deans Knight Income Corporation
Statement of Changes in Net Assets
Six-month period ended June 30, 2011 (Unaudited)
----------------------------------------------------------------------------
2011 2010
$ $
Increase in net assets from operations 3,771,232 8,441,683
Dividends to common shareholders (notes 5 and 10) (3,685,935) (3,685,935)
----------------------------------------------------------------------------
Increase in net assets during the period 85,297 4,755,748
Net assets - Beginning of period 143,343,361 128,681,694
----------------------------------------------------------------------------
Net assets - End of period 143,428,658 133,437,442
----------------------------------------------------------------------------
----------------------------------------------------------------------------
The accompanying notes are an integral part of these financial statements.
Deans Knight Income Corporation
Statement of Cash Flows
Six-month period ended June 30, 2011 (Unaudited)
----------------------------------------------------------------------------
2011 2010
$ $
Cash flows from operating activities
Increase in net assets from operations 3,771,232 8,441,683
Items not affecting cash
Net realized gain on securities sold (2,064,001) (2,572,267)
Net realized gain on settlement of foreign
currency contracts (2,203,559) (444,042)
Change in unrealized depreciation
(appreciation) on investments 4,457,177 (5,246,375)
Unrealized (appreciation) depreciation on
foreign exchange contracts (611,610) 1,438,353
Future income tax provision 680,000 2,190,000
----------------------------------------------------------------------------
4,029,239 3,807,352
Cost of investments purchased (note 7) (40,887,826) (26,584,338)
Proceeds from investments sold (note 7) 36,200,473 24,049,707
Net change in non-cash balances related to
operations
Accrued interest receivable (79,949) (1,070,412)
Prepaid expenses (68,497) (77,779)
Accounts payable and accrued liabilities (26,751) 116,628
----------------------------------------------------------------------------
(833,311) 241,158
----------------------------------------------------------------------------
Cash flows from financing activities
Dividends paid to common shareholders (note 5) (3,685,935) (3,685,935)
----------------------------------------------------------------------------
(3,685,935) (3,685,935)
----------------------------------------------------------------------------
Net decrease in cash during the period (4,519,246) (3,444,777)
Cash and cash equivalents - Beginning of period 7,137,967 6,042,756
----------------------------------------------------------------------------
Cash and cash equivalents - End of period 2,618,721 2,597,979
----------------------------------------------------------------------------
----------------------------------------------------------------------------
Cash and cash equivalents comprise
Cash 2,618,721 2,597,979
Short-term deposits - -
----------------------------------------------------------------------------
2,618,721 2,597,979
----------------------------------------------------------------------------
----------------------------------------------------------------------------
The accompanying notes are an integral part of these financial statements.
Deans Knight Income Corporation
Statement of Investments
As at June 30, 2011 (Unaudited)
----------------------------------------------------------------------------
Percentage of
total fair
Par value Average cost Fair value value
(1) (2) (2) (3)
$ $ $ %
Fixed income -
Canadian
Denominated in
Canadian dollars
Air Canada 10.13%
08-01-2015 1,500,000 1,485,690 1,545,000 1.2
Black Press Group
10% 02-04-2014 2,750,000 2,750,000 2,750,000 2.1
Cara Operations Ltd.
9.13% 12-01-2015 3,750,000 3,750,000 3,890,625 2.9
Flint Energy
Services 7.5%
06-15-2019 1,750,000 1,732,500 1,723,750 1.3
Garda World Security
9.75% 03-15-2017 2,500,000 2,472,105 2,643,750 2.0
Gateway Casinos
8.88% 11-15-2017 2,750,000 2,816,875 2,860,000 2.1
Mercator Minerals
Ltd. 6.50% 01-03-2013 4,500,000 4,500,000 4,500,000 3.4
Newalta Corp. 7.63%
11-23-2017 2,250,000 2,250,000 2,345,625 1.8
North American
Energy Partners Inc.
(4) 9.13% 8,750,000 8,793,125 8,815,625 6.6
04-07-2017
Paramount Resources
8.25% 12-13-2017 9,250,000 9,250,000 9,458,125 7.1
Perpetual Energy
Inc. 8.75% 03-15-2018 5,000,000 5,000,000 4,975,000 3.7
Sherritt
International Corp.
7.75% 10-15-2015 1,500,000 1,165,045 1,606,875 1.2
Skylink Aviation
Inc. 12.25%
03-15-2016 4,750,000 4,750,000 4,666,875 3.5
Sure Energy 6.25%
01-21-2014 2,500,000 2,500,000 2,500,000 1.9
Trident Exploration
Corp. 8.25%
04-13-2018 1,650,000 1,650,000 1,596,375 1.2
Vermilion Energy
Inc. 6.50% 02-10-2016 1,750,000 1,750,000 1,780,625 1.3
-----------------------------------------
56,615,340 57,658,250 43.3
-----------------------------------------
Denominated in
United States dollars
CCS Inc. 11.00%
11-15-2015 7,750,000 3,879,423 7,809,625 5.8
CHC Helicopter 9.25%
10-15-2020 250,000 253,623 218,776 0.2
Harvest Operations
Corp. 6.88%
10-01-2017 1,750,000 1,783,273 1,742,370 1.3
Mirabela Nickel Ltd.
8.8% 04-15-2018 6,000,000 5,811,649 5,727,942 4.3
National Money Mart
10.38% 12-15-2016 4,000,000 4,363,855 4,233,277 3.2
Pacific Rubiales
Energy Corp. 8.75% 2,500,000 2,655,612 2,726,558 2.0
11-10-2016
Southern Pacific
Resource Corp.
LIBOR+8.5% 5,970,000 5,897,667 5,814,440 4.4
01-07-2016
Tembec Industries
11.25% 12-15-2018 3,750,000 4,015,216 3,787,891 2.8
Trinidad Drilling
7.88% 01-15-2019 3,500,000 3,507,651 3,493,177 2.6
-----------------------------------------
32,167,969 35,554,056 26.6
-----------------------------------------
Total Canadian fixed
income 88,783,309 93,212,306 69.9
-----------------------------------------
(1) Par values are presented in their source currency
(2) All amounts are shown in Canadian dollars
(3) Percentages are shown as a percentage of total investments
(4) These investments share a common director with the Company
Deans Knight Income Corporation
Statement of Investments...continued
As at June 30, 2011 (Unaudited)
----------------------------------------------------------------------------
Percentage
of
total fair
Par value(1) Average cost(2) Fair value(2) value(3)
$ $ $ %
Fixed income - United
States
Denominated in United
States dollars
ABI Escrow Corp. 10.25%
10-15-2018 1,585,910 1,635,073 1,659,283 1.2
Beazer Homes USA, Inc.
9.13% 06-15-2018 3,250,000 3,327,056 2,710,888 2.0
Calfrac Holdings LP
7.5% 12-01-2020 6,000,000 6,130,329 5,858,123 4.4
Cott Beverages Inc.
8.38% 11-15-2017 4,350,000 4,622,109 4,404,440 3.3
McMoRan Exploration Co.
11.88% 11-15 2014 2,000,000 2,114,471 2,073,245 1.6
Stone Energy Corp.
8.63% 2-01-2017 8,750,000 8,821,638 8,564,189 6.4
----------------------------------------------------------------------------
Total United States
fixed income 26,650,676 25,270,168 18.9
----------------------------------------------------------------------------
Total fixed income 115,433,985 118,482,474 88.8
----------------------------------------------------------------------------
Convertible debentures -
Canadian
Denominated in Canadian
dollars
Harvest Energy 7.25%
09-30 -2013 4,595,000 3,036,941 4,721,363 3.5
Convertible debentures -
Australian
Denominated Australian
dollars
Western Areas NL 8.0%
07-02-2012 1,500,000 1,322,276 1,587,125 1.2
----------------------------------------------------------------------------
4,359,217 6,308,488 4.7
----------------------------------------------------------------------------
Equity
Sure Energy Inc.-
purchase warrants 625,000 - 292,599 0.2
Whitecap Resources Inc.
common shares 1,254,167 7,725,668 7,863,625 5.9
----------------------------------------------------------------------------
7,725,668 8,156,224 6.1
----------------------------------------------------------------------------
Investments subtotal 127,518,870 132,947,186 99.6
----------------------------------------------------------------------------
Hedges
Denominated in United
States and
Australian dollars
Foreign currency
exchange contracts
(note 9) 67,600,000 - 611,610 0.4
----------------------------------------------------------------------------
127,518,870 133,558,796 100.0
----------------------------------------------------------------------------
----------------------------------------------------------------------------
(1) Par values are presented in their source currency
(2) All amounts are shown in Canadian dollars
(3) Percentages are shown as a percentage of total investments
(4)These investments share a common director with the Company
The accompanying notes are an integral part of these financial statements.
Deans Knight Income Corporation
Notes to Financial Statements
As at June 30, 2011 (Unaudited)
1 Nature of operations and basis of presentation
Deans Knight Income Corporation (the "Company") is a corporation continued under the laws of Canada on April 11, 2001. The Company is a closed-end, non-redeemable investment company. It invests, primarily, in corporate debt rated BBB or below by recognized credit rating organizations.
Prior to the Company completing its reorganization in May 2008, it was in the business of pharmaceutical research. In May 2008, the Company was reorganized and the pharmaceutical research operations and all assets and liabilities were transferred out of the Company (note 2). In March 2009, the Company completed an initial public offering, whereby it raised gross proceeds of $100,368,900 and began operating its new business of investing in corporate debt.
The common shares of the Company will be redeemed on, or around, April 30, 2014, for a cash amount equal to 100% of the net asset value per share.
The accompanying financial statements are prepared in accordance with Canadian generally accepted accounting principles ("GAAP"). All amounts are presented in Canadian dollars, unless otherwise noted.
2 Reorganization
Prior to the Reorganization, the Company was a life sciences company involved in the research, development and commercialization of innovative products for the prevention and treatment of life-threatening diseases. Forbes Medi-Tech Inc ("Forbes"), who now carries on the prior business of the Company, has provided an indemnity to the Company with respect to liabilities relating to the Company's assets transferred to Forbes and the Company's prior business. In addition, Forbes obtained, on behalf of the Company, product liability insurance for certain claims that may arise in the future in connection with the Company's prior business. To date, no such claims or potential claims have arisen. There can be no assurance that the above noted guarantee will be sufficient to cover any future claims.
3 Summary of significant accounting policies
The following is a summary of significant accounting policies followed by the Company, and these policies are consistent with the most recent annual financial statements. These statements should be read in conjunction with the most recent annual financial statements.
Financial instruments
Investments
Investments are held for trading and are recorded at fair values determined as follows:
Fixed income investments
Fixed income investments traded on a public securities exchange or traded on an over-the-counter market are valued at the closing bid price. Where no closing bid price is available, the last sale or close price is used where, in management's opinion, this provides the best estimate of fair value.
Unlisted or non-exchange traded investments, or investments where a last bid, sale or close price is unavailable, or investments for which market quotations are, in the Company's opinion, inaccurate, unreliable, or not reflective of all available material information, are valued at their fair value as determined by the Company using appropriate and accepted industry valuation techniques including valuation models. The fair value determined using valuation models requires the use of inputs and assumptions based on observable market data including volatility and other applicable rates or prices. In certain circumstances, the fair value may be determined using valuation techniques that are not supported by observable market data.
The resulting values for investments not traded in an active market may differ from values that would be determined had a ready market existed, and the difference could be significant.
Forward currency contracts
Forward currency contracts are recorded at fair value. The proceeds (payments) on contracts settled during the six month period are included in the net realized gain on settlement of foreign currency contracts (note 7). The Company's policy is to hedge 95% - 106% of the fair value of foreign denominated investments with foreign exchange forward sell contracts.
Public company equities
Publicly traded equities are recorded at bid prices as quoted on recognized stock exchanges.
The amounts at which the Fund's publicly-traded investments could be disposed of currently may differ from carrying value based on market quotes, as the value at which significant ownership positions are sold is often different than the quoted market price due to a variety of factors such as premiums paid for large blocks or discounts due to illiquidity.
Warrants
Warrants are recorded at their estimated fair value, using appropriate and accepted industry valuation techniques.
The impact of changes in fair value on net income of the Company arising from changes in estimated fair value for investments is recorded in the statement of operations.
Cash and cash equivalents
Cash and cash equivalents are accounted for at amortized cost. They consist of cash and deposits with maturities, at the time of purchase, of three months or less and are held with a Canadian chartered bank.
Accrued interest receivable
Accrued interest is designated as loans and receivables and is accounted for at amortized cost. Due to the immediate and short-term nature, carrying value approximates fair value.
Financial liabilities
Financial liabilities, consisting of accounts payable and accrued liabilities, are designated as other financial liabilities and are accounted for at amortized cost. Due to the immediate and short-term nature, carrying value approximates fair value.
Investment transactions
Investment transactions are recorded on the trade date. Transaction costs are incremental costs that are directly attributable to the acquisition, issue or disposal of an investment, which include fees and commissions paid to agents, advisors, brokers and dealers, levies by regulatory agencies and securities exchanges, and transfer taxes and duties. These costs are expensed and are included in the statement of operations.
Income recognition
Income from investments is recognized on an accrual basis. Interest income is accrued based on the number of days the investment is held. Gains or losses on the sale of investments, including foreign exchange gain or loss on such investments, are calculated on an average cost basis.
Forward foreign currency contracts
Forward foreign currency contracts (note 9) entered into by the Company are valued at an amount that is equal to the gain or loss that would be realized if the position were to be closed out, which is equivalent to the difference between the deliverable asset and the value of the asset to be received. Changes in the value of a forward contract or the assets deliverable under such a contract are included as unrealized appreciation/depreciation of foreign currency contracts in the statement of operations.
Foreign exchange
Assets and liabilities denominated in foreign currencies are translated into Canadian dollars at the exchange rate applicable on the valuation date. Purchases and sales of investments, investment income and expenses are calculated at the exchange rates prevailing on the dates of the transactions.
Income taxes
The Company follows the asset and liability method of accounting for income taxes. Future income tax assets and liabilities are measured using rates expected to apply to the taxable income in the years in which the temporary differences are expected to be settled. The Company accounts for uncertain tax positions using the contingent liability model, whereby a provision is established only where it is likely that a payment will be required to be made.
A valuation allowance is recognized to the extent it is more likely than not that future income tax assets will not be realized. Management has estimated the income tax provision and future income tax balances taking into account its expectation of future income and an interpretation of the various income tax laws and regulations. It is possible, due to the complexity inherent in estimating income taxes, that the tax provision and future tax balances could change (note 8), and the change could be significant.
Use of estimates
The preparation of financial statements in conformity with GAAP requires management to make estimates and assumptions that affect the reported amounts of assets, liabilities, income and expenses. Actual results could differ from those reported and such differences could be material. Significant areas involving the use of estimates include determining the estimated fair value of investments and future income tax assets.
Net assets per common share
The net assets per common share is computed by dividing the net assets of the Company by the total number of common shares outstanding on the balance sheet date.
Increase in net assets from operations per weighted average common share
The increase in net assets from operations per common share represents the increase in net assets from operations divided by the weighted average number of common shares outstanding during the period.
The weighted average number of shares outstanding during the six month period ended June 30, 2011 was 10,537,263 (June 30, 2010 - 10,537,263). This weighted average includes both the voting common shares and non-voting common shares of the Company.
Comparative figures
Certain of the comparative figures have been reclassified to conform with the current period presentation.
4 Capital stock
The Company is authorized to issue an unlimited number of voting common shares without par value, and an unlimited number of non-voting common shares without par value.
There have been no changes in the number of voting and non-voting common shares for the periods ended June 30, 2010 and June 30, 2011.
The total shares outstanding at June 30 are summarized as follows:

                                        June 30, 2011     December 31, 2010
                              Number of        Amount  Number of     Amount
                                 Shares             $     Shares          $

Voting common shares         10,191,592    96,273,343 10,191,592 96,273,343
Non-voting common shares        345,671     3,093,086    345,671  3,093,086
                            ------------------------------------------------
Total common shares
 outstanding                 10,537,263    99,366,429 10,537,263 99,366,429
                            ------------------------------------------------
                            ------------------------------------------------

Contributed surplus

The contributed surplus balance did not change during the six month period,
and consists of:
                                                     June 30,   December 31,
                                                        2011           2010
                                                           $              $
Surplus related to stock compensation,
 warrants and options
  associated with common shares                    8,030,295      8,030,295
Surplus relating to warrants associated with
 previously issued preferred shares                1,874,209      1,874,209
                                                ----------------------------
                                                   9,904,504      9,904,504
                                                ----------------------------
                                                ----------------------------

5 Retained earnings

The changes in retained earnings for the six month
period ended June 30 were as follows:
                                                        2011           2010
                                                           $              $
Retained earnings - Opening balance               34,072,428     19,410,761
Increase in net assets from operations             3,771,232      8,441,683
Dividends paid from net investment
 income                                           (3,685,935)    (3,685,935)
                                                ----------------------------
Retained earnings - closing balance               34,157,725     24,166,509
                                                ----------------------------
                                                ----------------------------
6 Related party transactions and balances
Management fees are paid quarterly to Deans Knight Capital Management Ltd. (the Investment Advisor), a corporation with certain common directors and officers of the Company, for services received in connection with the management of the investment portfolio and financial accounts, among other services provided. Management fees are computed quarterly at an annual rate of 1.5% of net asset value, adjusted for certain non-investment related assets. For the six month period ended June 30, 2011, management fees totalled $1,165,607 (June 30, 2010 - $980,755). At June 30, 2011, $576,164 (December 31, 2010 - $599,474 ) was owed to the Investment Advisor, which was included in accounts payable and accrued liabilities in the statement of net assets and is payable immediately.
A director of the Company is a partner at a law firm that provides legal services to the Company. During the six month period ended June 30, 2011, the Company incurred $17,895 (June 30, 2010 - $17,409) in legal services and disbursements received from this related party. At June 30, 2011, accounts payable and accrued liabilities include $1,532 (December 31, 2010 - $1,355) due to the law firm for legal fees and disbursements.
7 Net realized gains on investments sold and foreign currency contracts

The net realized gain on sale of investments for the six-month period
 ended June 30 was as follows:
                                                        2011           2010
                                                           $              $
  Proceeds from sale of investments               36,200,473     24,049,707
                                                ----------------------------
  Investments at cost - Beginning of period      118,563,957    100,510,397
  Add: Cost of investments purchased              40,887,826     26,584,338
                                                ----------------------------
                                                 159,451,783    127,094,735
  Less: Investments at cost - End of period     (127,518,870)  (106,061,337)
                                                ----------------------------
  Cost of investments sold                        31,932,037     21,033,398
                                                ----------------------------
  Net realized gains on investments sold           4,267,560      3,016,309
                                                ----------------------------
                                                ----------------------------
Net realized gains on investments sold
 consist of:
                                                        2011           2010
                                                           $              $
  Realized gains on securities sold                2,064,001      2,572,267
  Realized gains on settlement of foreign
   currency contracts                              2,203,559        444,042
                                                ----------------------------
                                                   4,267,560      3,016,309
                                                ----------------------------
                                                ----------------------------
8 Taxation
Uncertainty of deductibility of tax losses
Prior to the reorganization and change in business as discussed in notes 1 and 2, the Company had generated significant tax losses and other tax attributes as a result of its prior businesses and research activities. The Company has recorded, as a tax asset, the full amount of the potential tax benefit of such items to the extent of its projected taxable income. There is no guarantee that the tax authorities will allow the Company to deduct some, or all, of the tax losses and other attributes. Should the Company be denied the deductions, the recognized amount of the tax assets, as well as such amounts claimed to date, would be recorded as a charge to income. The total tax assets recognized and tax losses and other attributes claimed to date, which are subject to uncertainty, amount to $21,247,000 (December 31, 2010 - $20,747,249), representing $2.02 per common share at June 30, 2011 (December 31, 2010 - $1.97 per common share).
Future tax asset
Canadian GAAP requires a valuation allowance to be recognized against any future tax asset to the extent that it is more likely than not that the future income tax asset will not be realized. This is also the Company's stated accounting policy.
Prior to commencing operations as an investment corporation in March 2009, the Company had determined that it had not met this test. As such, the Company recorded a full valuation allowance against the potential value of all of its tax losses and deductions available to be taken against future years' taxable income.
As the Company's investments in debt securities are now generating interest income, and are expected to continue to generate income during the years of operations through to April 30, 2014, the Company concluded that the valuation allowance should be reduced accordingly. The difference between the total value of these tax benefits less the valuation allowance, being $5,870,000 (December 31, 2010 - $6,550,000), is the amount of the future income tax asset that has been recorded by the Company in the statement of net assets. The valuation allowance is reviewed periodically, based on updated projections of taxable income, and adjusted accordingly by a credit or charge to the statement of operations in that period.
The tax effects of temporary differences that give rise to significant components of the future income tax assets at the statutory enacted rates are as follows:
                                                     June 30,   December 31,
                                                        2011           2010
                                                           $              $
Future tax assets
Research and development expenditures              7,630,000      8,467,000
Investment tax credits                             6,032,450      6,032,450
Share issuance costs                                 629,900        959,100
                                                ----------------------------
Total gross future tax assets                     14,292,350     15,458,550
Valuation allowance                               (8,422,350)    (8,908,550)
                                                ----------------------------
Net future tax asset                               5,870,000      6,550,000
Less: current portion                             (2,250,000)    (2,150,000)
                                                ----------------------------
                                                   3,620,000      4,400,000
                                                ----------------------------
                                                ----------------------------
The tax balances and income tax expense recognized by the Company are based on management's interpretation of the tax laws. Due to the complexity inherent in tax interpretations, regulations and legislation, there are significant estimates required to compute income tax balances. It is possible that some or all of the Company's significant components of the future income tax assets may not be deductible for tax purposes and, accordingly, the amount of future income taxes and provision for (recovery of) income taxes recorded in the financial statements could change by a material amount.
In determining the amount of future income tax assets recognized, management assessed the projected taxable income of the Company. Inherent in all forward looking information is uncertainty and actual amounts could differ from these estimates and the difference could be material. In developing the projection, management has assumed full payment of all contractual interest, that investments maturing prior to April 30, 2014 will be redeemed for par value, that reinvested funds will achieve an 8% yield, and that investments maturing after April 30, 2014 will be sold at their current value.
Tax pools available to offset future tax expense and payable
The operations of the Company and related tax interpretations, regulations and legislation are continually changing. As a result, significant estimates are required to compute income tax balances. As at June 30, 2011, the Company has accumulated scientific research and experimental development expenditures in the amount of $30,264,000 available for carry-forward indefinitely. The Company also has accumulated approximately $7,097,000 of unclaimed federal investment tax credits, which expire as follows:
                                                                 Investment
                                                                tax credits
                                                                          $
Year of expiry
2018                                                                265,000
2019                                                                990,000
2020                                                              1,872,000
2021                                                              2,483,000
2022                                                                298,000
2023                                                                187,000
2024                                                                496,000
2025                                                                506,000
                                                ----------------------------
                                                                  7,097,000
                                                ----------------------------
                                                ----------------------------


Reconciliation of income tax expense

The reconciliation of income tax computed at the statutory tax rate to
income tax expense at June 30, using a 26.5 % statutory tax rate
(2010 - 28.5%), is:

                                                         2011          2010
                                                            $             $

Increase in net assets from operations before taxes 4,451,232    10,631,683
Statutory tax rate                                       26.5%         28.5%
                                                    ------------------------

Income tax expense at statutory rates               1,179,576     3,030,030
Use of prior year losses                                    -    (2,672,708)
Use of scientific research and experimental
 development
 expenditures                                        (847,330)            -
Changes in valuation allowance                        680,000     2,190,000
Current tax deductions for offering costs            (332,246)     (357,322)
                                                    ------------------------
                                                    ------------------------

Income tax provision                                  680,000     2,190,000
                                                    ------------------------
                                                    ------------------------
9 Financial instruments
The following tables illustrate the classification of the Company's financial instruments within the fair value hierarchy:
                            Financial assets at fair value - June 30, 2011
                       ----------------------------------------------------

                          Level 1       Level 2      Level 3          Total
                                $             $            $              $

Corporate debt                  -   102,085,725   16,396,749    118,482,474
Convertible debentures          -     6,308,488            -      6,308,488
Equity                  7,863,625             -      292,599      8,156,224
Foreign currency
 forward contracts              -       611,610            -        611,610
                       ----------------------------------------------------

                        7,863,625   109,005,823   16,689,348    133,558,796
                       ----------------------------------------------------
                       ----------------------------------------------------


                        Financial assets at fair value - December 31, 2010
                       ----------------------------------------------------

                          Level 1       Level 2      Level 3         Total
                                $             $            $             $

Corporate debt                  -    91,969,703   14,475,875   106,445,578
Convertible debentures          -     9,334,369    3,617,677    12,952,046
Equity                  7,826,002             -      400,000     8,226,002
Foreign currency
 forward contracts              -       825,824            -       825,824
                       ----------------------------------------------------

                        7,826,002   102,129,896   18,493,552   128,449,450
                       ----------------------------------------------------
                       ----------------------------------------------------
All investments remained at their respective levels within the fair value hierarchy during the six month period.
The following table reconciles the Company's Level 3 fair value measurements:
                              Corporate  Convertible
                                   debt   debentures    Equity        Total
                                      $            $         $            $

Balance - December 31,
 2009                       11,616,418   10,561,008         -   22,177,426
Purchases                    7,500,000    1,879,862         -    9,379,862
Sales                       (6,061,608) (17,921,531)        -  (23,983,139)
Unrealized appreciation
 included in net
 gain on investments         1,421,065    9,098,338   400,000   10,919,403
                       ----------------------------------------------------

Balance - December 31,
 2010                       14,475,875    3,617,677   400,000   18,493,552
                       ----------------------------------------------------
Purchases                    4,500,000            -         -    4,500,000
Sales                       (5,000,000)  (2,148,120)        -   (7,148,120)
Unrealized appreciation
 included in net gain on
 investments                   833,749      117,568  (107,401)     843,916
                       ----------------------------------------------------

Balance - June 30, 2011     14,809,624    1,587,125   292,599   16,689,348
                       ----------------------------------------------------
                       ----------------------------------------------------
Management of financial risks
In the normal course of business, the Company is exposed to various financial risks, including credit risk, liquidity risk and market risk (consisting of interest rate risk, currency risk and other price risk). The Company's overall risk management program seeks to minimize potentially adverse effects of these risks on the Company's financial performance by employing a professional, experienced portfolio adviser, monitoring daily the Company's positions and market events, diversifying the investment portfolio within the constraints of the investment guidelines and periodically using derivatives to hedge certain risk exposures. Further, the Company monitors the portfolio to ensure compliance with its investment strategy, investment guidelines and securities regulations.
Fair value risk
The Company's investments are exposed to market price risk and this risk affects the fair value of the investments. All fixed income investments have an inherent risk of loss of capital. The maximum risk resulting from investments is determined by their fair value. The Company seeks to manage valuation risks by careful selection of fixed income investments prior to making an investment and by regular ongoing monitoring of the investment performance of the individual investee companies.
Credit risk
Credit risk is the risk that a counterparty to a financial instrument will fail to discharge an obligation or commitment that it has entered into with the Company.
All transactions executed by the Company in listed securities are settled/paid for upon delivery using approved brokers. The risk of this settlement not occurring is considered minimal, as delivery of securities sold is only made once the broker has received payment. Payment is made on a purchase once the securities have been received by the broker. The trade will fail if either party fails to meet its obligation. Since the Company invests in high-yield debt instruments and derivatives, this represents the main concentration of credit risk. The fair value of debt securities includes consideration of the creditworthiness of the debt issuer. The maximum credit exposure of these assets is represented by their carrying amounts. This maximum exposure may be offset to varying degrees in each investment, based on the collateral held, if any. Collateral may include such things as a general security agreement over all assets, or specific security over specific assets. It may also entitle the debt holder to take over the overall business, through restructuring of the investment.
The Company's credit risk exposure by credit ratings on its investments is listed as follows:
                                                       As a % of net assets
                                                    ------------------------

                                                     June 30,   December 31,
                                                        2011           2010
Credit rating
BB                                                       5.5           10.7
B                                                       50.9           36.0
CCC                                                     21.3           21.3
CC                                                         -            1.0
Not rated(1)                                            15.0           20.0
                                                    ------------------------

                                                        92.7           89.0
                                                    ------------------------
                                                    ------------------------

(1) Unrated debt securities consist primarily of equity securities,
    convertible debentures and promissory notes in publicly traded
    companies.
Credit ratings are obtained from various credit rating agencies and sources. Where one or more rating is obtained for a security, the lowest rating has been used.
The Company's credit risk exposure by sector on its investments is as follows:
                                                       As a % of net assets
                                                    ------------------------

                                                     June 30,   December 31,
                                                        2011           2010

Sector
Energy                                                  57.0           57.1
Consumer goods                                           9.6            9.4
Materials and metals                                     9.4            6.0
Services                                                 6.1            3.6
Industrial/manufacturing                                 3.8            2.2
Forestry                                                 3.8            4.3
Financial services                                       3.0            3.0
Chemicals                                                  -            3.4
                                                    ------------------------

                                                        92.7           89.0
                                                    ------------------------
                                                    ------------------------
Interest rate risk
Interest rate risk arises from the possibility that changes in interest rates will affect future cash flows or fair values of financial instruments.
The Company invests primarily in interest-bearing financial instruments. As such, the Company is exposed to the risk that the value of such financial instruments will fluctuate due to changes in the prevailing levels of market interest rates. The table below summarizes the Company's exposure to interest rate risk by term to maturity:
                                                                 Fair value
                                                ----------------------------
                                                    June 30,   December 31,
                                                        2011           2010
                                                           $              $
Maturity
Less than 1 year                                     611,610      5,825,824
1 - 3 years                                       16,058,487     16,154,645
3 - 5 years                                       29,187,309     27,443,442
Greater than 5 years                              79,545,166     70,799,537
                                                ----------------------------

                                                 125,402,572    120,223,448
                                                ----------------------------
                                                ----------------------------
As at June 30, 2011, if the prevailing interest rates had been raised or lowered by 1%, assuming a parallel shift in the yield curve, with all other factors remaining constant, net assets could possibly have decreased or increased, respectively, by approximately $5,150,000, or approximately 3.6% of net assets (December 31, 2010 - $4,900,000, or approximately 3.4% of net assets).
Liquidity risk
As the Company is a publicly traded, closed-end investment company with a fixed number of common shares outstanding, unlike an open-ended mutual fund, it is not exposed to the liquidity risk associated with daily cash redemptions of securities.
Investments in fixed income investments may not be able to be liquidated quickly at an amount close to their fair value to respond to specific events such as deterioration in the creditworthiness of any particular issuer. Fixed income investments purchased by the Company may be subject to resale restrictions such as hold periods. The resulting values for fixed income investments may differ from values that would be realized had a ready market existed.
The Company actively reviews its investment portfolio, and the fixed income market, to assess liquidity risk on its holdings.
Currency risk
Currency risk is the risk that the value of a financial instrument will fluctuate due to changes in foreign exchange rates. The Company invests a portion of its assets is securities that are denominated in a currency other than the Canadian dollar, which represents the functional currency of the Company. Consequently, the Company is exposed to currency risk as the value of the portfolio securities denominated in currencies other than the Canadian dollar will vary due to changes in foreign currency exchange rates.
The Company enters into foreign currency contracts with financial institutions to hedge the value of foreign currency denominated investments. The fair value of these contracts is reflected in investments. Gains or losses arising from these contracts offset the gains or losses from the underlying investments. The unrealized gains or losses are reflected in unrealized appreciation/depreciation on foreign currency contracts on the statement of operations.
The tables below indicate the foreign currency to which the Company had significant exposure in Canadian dollar terms. The tables also illustrate the potential impact to the Company's net assets, all other variables held constant, as a result of a 5% change in this currency relative to the Canadian dollar, assuming the forward currency contracts in place did not offset the foreign currency risk.
                                                        As at June 30, 2011
                                                  --------------------------
                               Cash and   Foreign
                                   cash  exchange                 Impact on
                Investments equivalents contracts       Total    net assets
                          $           $         $           $             $

Currency
United States
 dollars         60,824,223   1,165,454   611,458  61,378,239     3,068,912
As a % of net
 assets                42.4         0.8       0.4        42.8           2.1
Australian
 dollars          1,587,125           -       173   1,586,952        79,348
As a % of net
 assets                 1.1           -         -         1.1           0.1

                                                    As at December 31, 2010
                                                  --------------------------
                               Cash and   Foreign
                                   cash  exchange                 Impact on
                Investments equivalents contracts       Total    net assets
                          $           $         $           $             $

Currency
United States
 dollars         61,640,143   5,024,395   916,045  67,580,583     3,379,029
As a % of net
 assets                43.1         3.5       0.6        47.3           2.4
Australian
 dollars          3,617,677           -   (90,221)  3,527,456       176,373
As a % of net
 assets                 2.5         0.0      -0.1         2.5           0.1
At June 30, 2011, the Company had outstanding foreign exchange contracts to sell US$66,000,000 and AUS$1,600,000 against future commitments at exchange rates ranging between 0.9736 and 0.97436 for US dollar foreign exchange contracts and 1.0320 for the AUS dollar foreign exchange contract. Those contracts have maturities ranging up to July 28, 2011 and are with AAA rated Canadian bank counterparties.
10 Capital management
The capital of the Company is divided into voting and non-voting common shares, each having an unlimited authorized amount. The number of voting and non-voting shares outstanding, and changes thereto, are outlined in note 4.
The Company manages its capital in accordance with the Company's investment objectives. The Company's investment objectives are to: (i) maximize the total return for common shareholders, consisting of dividend income and capital appreciation; and (ii) provide shareholders with monthly dividends targeted to payout a minimum of 75% of net earnings annually. Net earnings in reference to the Company's dividend payments to shareholders exclude any realized and unrealized capital gains and losses from debt securities in the portfolio and any income or loss not derived from debt securities in the portfolio. The Company commenced its dividend payments on June 30, 2009, making monthly payments of $0.0583 per voting and non-voting common share, or $614,322. During the six month period ended June 30, 2011, the Company made dividend payments of $3,685,935 (June 30, 2010 - $3,685,935).
The Company is committed to continue paying a monthly dividend of $0.0583 per voting and non-voting common share for the three months ending September 30, 2011, totalling $1,842,966.
11 Comparison of net asset value per share and net assets per share
In accordance with Section 3.6(1) of National Instrument 81-106, the Company's net asset value per share, the net assets per share calculated in accordance with Canadian GAAP for financial reporting purposes, and an explanation of the differences between such amounts, are required disclosures in the notes to the financial statements. For investments that are traded in an active market, Canadian GAAP requires that bid prices be used in the fair value of instruments, rather than the use of the last traded price, as currently used for the purpose of determining net asset value. This change accounts for the difference between the net asset value and the net assets.
                                                     June 30,   December 31,
                                                        2011           2010
                                                           $              $

Net asset value per share                              13.63          13.65
Canadian GAAP adjustments                               0.02          (0.05)
Net assets per share                                   13.61          13.60
12 Subsequent events
The Company announced a monthly dividend of $614,322, or $0.0583 per common share, payable on each of July 29, 2011, August 31, 2011 and September 30, 2011.
Contact Information:
Craig Langdon
Chief Executive Officer and Director
(604)669-0212
Deans Knight Income Corporation
Mark Myles
Chief Financial Officer
(604)669-0212