VANCOUVER, BRITISH COLUMBIA--(Marketwired - Aug. 21, 2014) - Deans Knight Income Corporation (the "Company") (TSX:DNC) is pleased to release its Interim Management Report of Fund Performance and Financial Statements for the period ended June 30, 2014.
These documents can be found on SEDAR at www.sedar.com or the Company's website: www.dkincomecorp.com.
Forward-Looking Statements
This press release contains forward-looking statements. More particularly, this press release contains forward-looking statements concerning the Company's corporate objectives, availability of tax losses and deductions and other forward-looking statements as described in the management report of fund performance. Although the Company believes that the expectations reflected in these forward-looking statements are reasonable, undue reliance should not be placed on them because the Company can give no assurance that they will prove to be correct since forward-looking statements address future events and conditions and by their very nature, involve inherent risks and uncertainties. The forward-looking statements contained in this press release are made as of the date hereof and the Company disclaims any intention or obligation to update or revise any forward-looking statements whether as a result of new information, future events or otherwise, unless so required by applicable securities laws.
Interim Management Report of Fund Performance
For the period from January 1, 2014 to June 30, 2014
This interim management report of fund performance (the "Report") contains financial highlights of Deans Knight Income Corporation (the "Company"). This Report should be read in conjunction with the financial statements of the Company for the six month period ending June 30, 2014 (the "Financial Statements"), which, if not included with this Report, can be obtained at your request, at no cost by emailing info@dkincomecorp.com, visiting our website at www.dkincomecorp.com for contact details or on SEDAR at www.sedar.com. Readers may also contact us to request a free copy of the Company's proxy voting policies and procedures, proxy voting disclosure record or quarterly portfolio disclosure.
A NOTE ON FORWARD-LOOKING STATEMENTS
This Report contains certain forward-looking statements. In particular, this Report contains forward-looking statements in respect of the Company's, investment strategy, behaviour of financial markets, the availability and use of the tax attributes of the Company, the resolution and disposition of the CRA Matter (as defined herein) including the extent of the Potential Tax Liability (as defined herein), the anticipated receipt of the 2013 Tax Refund (as defined herein) and reflects the Company's expectations regarding the results of operations and performance of the Company and its investments. In some cases, forward-looking statements can be identified by terminology such as "may", "will", "should", "expect", "plan", "anticipate", "believe", "estimate", "predict", "potential", "continue" or the negative of these terms or other comparable terminology. Such forward-looking statements reflect the Company's current beliefs and are based on information currently available to the Company. With respect to such forward-looking statements, the Company has made assumptions regarding, among other things, the liquidity and potential proceeds to be realized from the Remaining Investments (as defined herein), currency, exchange and interest rates. A number of factors could cause actual events or results to differ materially from the results discussed in the forward-looking statements. In evaluating these statements, prospective investors should specifically consider various factors, including global equity and capital markets, business competition, technological change, changes in government regulations, unexpected judicial or regulatory proceedings, and catastrophic events and the risks outlined under "Risk Factors" in the AIF (as defined herein), which may cause actual results to differ materially from any forward-looking statement. Although the forward-looking statements contained in this Report are based upon what the Company believes to be reasonable assumptions, the Company cannot assure investors that actual results will be consistent with these forward-looking statements. Forward-looking statements are made as of the date of this Report and, other than as required by applicable law, the Company assumes no obligation to update or revise them to reflect new events or circumstances.
This Report also contains certain financial and operational information obtained from public sources in respect of certain companies included in the Company's investment portfolio. While management believes this data to be reliable, such information is subject to variations and may not be able to be verified due to limits on the availability and reliability of data inputs, the nature of the data gathering process and other limitations and uncertainties inherent in such information. Accordingly, the accuracy, currency and completeness of this information cannot be guaranteed. The Company has not independently verified any of the data from third party sources referred to in this Report or ascertained the underlying assumptions relied upon by such sources.
Investment Objectives and Strategies
The Company is a closed-end, non-redeemable investment company that, prior to April 30, 2014, was focused on investing in corporate debt securities. The Company's assets are managed by Deans Knight Capital Management Ltd. ("Deans Knight"), a respected British Columbia-based investment firm focused on managing high income and growth mandates for high net worth individuals, foundations, endowments and pension funds.
Since making a special cash distribution ("Cash Distribution") on April 30, 2014, the Company has ceased all investing and portfolio activities, such that the Company's business now consists of: (i) attending to, and if necessary, litigating, the Canada Revenue Agency ("CRA") audit and, if applicable, the related tax appeal; (ii) divesting of the securities held in the Company's portfolio that were not liquidated prior to the Cash Distribution (the "Remaining Investments"); and, (iii) attending to any additional distributions to shareholders of any surplus cash and the eventual wind-up and termination of the Company thereafter.
Risk
The overall risks of the Company are as described in its annual information form of the Company dated March 6, 2014 (the "AIF").
Prior to the reorganization and change in the Company's business that occurred in 2008, as discussed in Note 1 of the Financial Statements, the Company had generated significant tax losses and other tax attributes as a result of its prior business activities. In its tax filings since the reorganization, the Company has taken the position that these losses and other tax attributes could be used to offset profits generated by the Company, thereby reducing its taxes payable.
On July 16, 2014, the Company received Notices of Reassessment ("NORAs") from the CRA for the taxation years 2009 to 2012, inclusive. In the NORAs, the CRA denied the use of certain tax attributes by the Company on the basis that an acquisition of control of the Company occurred and on the basis of the General Anti-Avoidance Rule in the Income Tax Act (Canada) (the "CRA Matter").
The NORAs indicate the Company's tax liability for the 2009 to 2012 taxation years to be approximately $22.7 million or $2.15 per Share ("Disputed Amount"), including arrears interest and penalties. If the CRA's position were to be followed by the Company in future years, the overall tax liability will continue to fluctuate depending on the profitability of the Company. Given the Company's financial results for 2013, the Company estimates it is entitled to a refund of $1.1 million ("2013 Tax Refund") following the CRA's position. As such, the Company estimates its overall potential net tax liability to be approximately $21.6 million, or $2.05 per Share ("Potential Tax Liability").
Should the Company be successful in defending its tax filing position, the Disputed Amount will be refunded to the Company with interest. However, if the Company is unsuccessful, the recorded amount of the tax assets, if any, as well as such amounts claimed to date would be recorded as a charge to income.
On April 15, 2014, the Voting Shares (as defined herein) were delisted from trading on the Toronto Stock Exchange. As a result, the Company's shares are no longer traded in a public market, there is no active market through which the shares may be sold and there is no guarantee that an active trading market will develop. The lack of a market for the Company's shares may affect the price of the shares in any secondary market that may develop; however, there can be no assurance that an active trading market or secondary market will develop, or if developed, that such a market will be sustained at the price level of the net asset value per share.
Given the majority of the Company's business is now limited to attending to the CRA Matter, the resolution and disposition of this matter which is uncertain at this time, an investment in the Company may be considered to be speculative. Therefore, an investment in the Company is only suitable for investors who are looking for potential capital appreciation and are willing to tolerate volatility in the value of their investment.
Results of Operations
On April 30, 2014, the Company executed on its plan to distribute a substantial portion of its assets to holders of voting common shares ("Voting Shares") and non-voting common shares ("Non-Voting Shares" and together with the Voting Shares, the "Common Shares") of the Company through the payment of the Cash Distribution in the aggregate amount of $102.7 million ($9.75 per Common Share). The Cash Distribution was considered a return of capital to holders of Common Shares for income tax purposes.
Given the Cash Distribution, the net assets of the Company at June 30, 2014 ($27,518,217 or $2.61 per Common Share) were significantly lower than at December 31, 2013 ($130,367,007 or $12.37 per Common Share). The net assets of the Company consisted of the following components:
| June 30, 2014 | |||||||
$ |
Per Common Share(1) |
% |
|||||
| Remaining Investments(2) | 3,511,452 | 0.33 | 12.8 | ||||
| Cash and short-term deposits | 1,274,500 | 0.12 | 4.6 | ||||
| Accrued income | 54,004 | 0.01 | 0.2 | ||||
| Prepaid tax payment(3) | 22,690,000 | 2.15 | 82.4 | ||||
| Prepaid assets less accrued liabilities | (11,739 | ) | 0.00 | (0.0 | ) | ||
| 27,518,217 | 2.61 | 100.0 | |||||
| (1) | Based on 10,537,263 Common Shares, including 10,191,592 Voting Shares and 345,671 Non-Non-Voting Shares, as outlined in the notes to the Financial Statements. | ||
| (2) | The details of the Remaining Investments are outlined in the Summary of Investment Portfolio below. | ||
| (3) | The prepaid tax payment excludes the expected 2013 Tax Refund. The result of receiving this anticipated refund will be an increase in cash and short-term deposits and a decrease to the prepaid tax payment. Refer to the Taxation note to the Financial Statements for more detail. |
| December 31, 2013 | ||||||||
$ |
Per Common Share(1) |
% |
||||||
| Investments(2) | 65,659,396 | 6.23 | 50.4 | |||||
| Cash and short-term deposits | 64,573,401 | 6.13 | 49.5 | |||||
| Accrued income | 786,745 | 0.07 | 0.6 | |||||
| Prepaid expenses | 41,370 | 0.00 | 0.0 | |||||
| Future income tax asset(3) | 180,000 | 0.02 | 0.2 | |||||
| Accounts payable and accrued liabilities | (873,905 | ) | (0.08 | ) | (0.7 | ) | ||
| 130,367,007 | 12.37 | 100.0 | ||||||
| (1) | Based on 10,537,263 Common Shares, including 10,191,592 Voting Shares and 345,671 Non-Voting Shares, as outlined in the notes to the Financial Statements. | ||
| (2) | The details of the investments are outlined in the Summary of Investment Portfolio below. | ||
| (3) | Refer to the Taxation note to the Financial Statements for more detail. |
The Company's net investment income, being interest for distribution purposes and royalty income less expenses, for the six month period to June 30, 2014 was approximately $0.371 million ($0.04 per share) versus $4.077 million ($0.39 per share). The decrease is the result of the Company liquidating the majority of its income generating investments in anticipation of paying the Cash Distribution. In addition, the Company also incurred $3.897 million of realized capital losses in the period from the sale of all the liquid investments held in the portfolio, the exchange of debt securities for common shares of Mirabela Nickel, and the settlement of foreign currency contracts. Conversely, the sales resulted in the majority of the change in unrealized appreciation on investments of $3.596 million.
Going forward, investment income is anticipated to be generated from the Company's investments in Skylink Aviation Inc. and the royalty stream it is entitled to from Rapid Eye Canada Inc. For the six months ended June 30, 2014, these investments generated $243,647 of investment income.
In late June 2014, there were positive developments regarding the Company's investment in Mirabela Nickel Limited ("Mirabela"). As previously disclosed, in late 2013 Mirabela began a process to recapitalize, as it fell victim to a two year slump in the nickel market. Deans Knight worked for over 6 months as part of a debtholder group to restructure the nickel company. As a result, in late June, the Company was able to exchange the debt it held for shares in the restructured business along with a subordinated note with minimal value. The new shares were re-listed on the Australian Stock Exchange on June 30, 2014 and closed at a price of AUS$0.04 per share. At AUS$0.04 per share, the total value of the shares was approximately equal to the fair value ascribed to debt investment immediately before the exchange. The ultimate recovery on the initial debt investment will be determined by the value of the Mirabela shares.
There were no other significant developments to report relating to the Company's other Remaining Investments. The Company will continue to look for opportunities to sell the Remaining Investments as prudently as possible. Otherwise, the Company's business will be limited solely to attending to the CRA Matter and, if applicable, the related tax appeal, and attending to any additional distributions to shareholders of any surplus cash and the eventual wind-up of the Company.
CRA Matter
The Company, in consultation with its legal advisors, remains of the view that its tax filing position is appropriate, and intends to vigorously defend its position. As such, on July 24, 2014, the Company filed Notices of Objection to the NORAs. If the CRA does not reverse its ruling within 90 days from the date the Notices of Objection were filed, the Company intends to appeal to the Tax Court of Canada to defend its tax filing position.
The NORAs indicate the Disputed Amount to be approximately $22.7 million or $2.15 per Common Share, based on the aggregate reassessment amounts for the 2009 through 2012 taxation years, including arrears interest and penalties.
The Company has estimated the Potential Tax Liability to be approximately $21.6 million, or $2.05 per Share, being the Disputed Amount, totaling approximately $22.7 million, less the 2013 Tax Refund of approximately $1.1 million.
The Company has prepaid the Disputed Amount to the CRA to minimize any further interest from accruing. Should the Company be successful in defending it tax filing position, the Disputed Amount will be refunded with interest. However, should the Company be denied the deductions in full, the recorded amount of the tax assets, if any, as well as such amounts claimed to date would be recorded as a charge to income.
Recent Developments
Cash Distribution and Extension of Termination Date
On April 4, 2014, shareholders voted in favour of the special resolution authorizing: (i) the reduction in the stated capital of the Voting Shares; (ii) an extension of the termination date of the Company until such time as is reasonably practicable following the conclusion of the CRA Matter (as defined herein) or such other date as the Company deems appropriate on not less than 30 days' notice to shareholders; and (iii) the removal of the restrictions on business that the Company can carry on.
With these shareholder approvals, on April 30, 2014, the Company executed on its plan to distribute a substantial portion of its assets to shareholders through the payment of the Cash Distribution in the amount of $9.75 per Common Share. Further, the Company is now limiting its business solely to attending to the CRA Matter, liquidating the Remaining Investments in a prudent manner with a view to distributing the proceeds of such Remaining Investments to shareholders as soon as reasonably practicable.
International Financial Reporting Standards
This reporting period represents the Company's first set of financial statements reported under IFRS. The statements include corresponding comparative financial information for 2013, including an opening statement of net assets as at January 1, 2013.
The Company's transition to IFRS is as outlined in the notes to the Financial Statements. More specifically, Note 11 of the Financial Statements outlines the Company's transition to IFRS and the related impact on the Company's equity and comprehensive income. This change has resulted in certain comparative figures in this management report of fund performance being updated to reflect the changes to the Company's financial statements.
Related Party Transactions
The officers and directors of the Company are also employees of Deans Knight, the Company's investment advisor. These officers and directors are not paid by the Company. Deans Knight provides administration, financial reporting and other ancillary services required by a public company, as well as investment management services related to the Remaining Investments, all as more particularly set forth in the Services Agreement between the Company and Deans Knight dated May 20, 2014 and available for review on SEDAR at www.sedar.com. Deans Knight is paid a nominal fee of $10 per month, starting May 1, 2014, for the services it provides to the Company under the Services Agreement. Prior to that, and for the period January 1, 2014 to April 30, 2014, Deans Knight was paid a management fee computed quarterly, at an annual rate of 1.5% of the net asset value plus applicable taxes, and adjusted for certain non-investment related assets.
For the six month period ending June 30, 2014, management fees totaled $554,701 (2013 - $1,089,013). At June 30, 2014, $20 (December 31, 2013- $512,138) was owed to Deans Knight, which was unsecured and included in accounts payable and accrued liabilities in the statement of financial position, and is payable immediately.
A former director of the Company, who was no longer a director in 2014, is a partner at a law firm that provides legal services to the Company. During the six month period ending June 30, 2013, the Company incurred $175,830 in legal services and disbursements received from this related party. At December 31, 2013, all amounts owing had been paid.
Financial Highlights
The following tables show selected key financial information about the Company and are intended to help you understand the Company's financial performance since it began operating its new business of investing in corporate debt in March 2009.
| The Company's Net Assets per Common Share (1) | ||||||||||||
| Six months ended June 30, 2014 |
Year ended December 31, | Period March 17 to December 31, 2009 |
||||||||||
| 2013 | 2012 | 2011 | 2010 | |||||||||
| $ | $ | $ | $ | $ | $ | |||||||
| Net assets, beginning of year (2) | 12.37 | 13.58 | 13.43 | 13.60 | 12.21 | 9.12 | ||||||
| Increase from operations | ||||||||||||
| Total revenue | 0.11 | 0.96 | 1.10 | 1.10 | 0.94 | 0.62 | ||||||
| Total expenses | (0.08 | ) | (0.29 | ) | (0.26 | ) | (0.26 | ) | (0.24 | ) | (0.20 | ) |
| Realized (losses) gains | (0.37 | ) | (0.50 | ) | 0.44 | 0.36 | 1.82 | 1.25 | ||||
| Unrealized gains (losses) | 0.34 | (0.47 | ) | (0.19 | ) | (0.52 | ) | (0.27 | ) | 1.21 | ||
| Future income taxes | (0.01 | ) | (0.21 | ) | (0.24 | ) | (0.15 | ) | (0.16 | ) | 0.62 | |
| Total increase from operations(2) | (0.01 | ) | (0.51 | ) | 0.85 | 0.53 | 2.09 | 3.50 | ||||
| Return of Capital | (9.75 | ) | - | - | - | - | - | |||||
| Dividends (2)(3) | - | (0.70 | ) | (0.70 | ) | (0.70 | ) | (0.70 | ) | (0.41 | ) | |
| Net assets, end of year (4) | 2.61 | 12.37 | 13.58 | 13.43 | 13.60 | 12.21 | ||||||
| (1) | The information is derived from the Company's audited annual and unaudited interim financial statements. Common shares outstanding are 10,537,263, including 10,191,592 voting common shares and 345,671 non-voting common shares. | ||
| (2) | Net assets, beginning of the period for 2009 reflect the net assets in the Company at March 17, 2009, after giving effect to the conversion of the convertible debenture and interest owing thereon and the issuance of common shares on the Company's initial public offering less total share issue expenses. | ||
| (3) | Net assets and dividends are based on the actual number of shares outstanding at the relevant time. The increase/decrease from operations is based on the weighted average number of shares outstanding over the period. | ||
| (4) | Dividends were paid in cash. |
| Ratios and Supplemental Data (1) | ||||||||||||||||||
| Six months ended June 30, 2014 |
Year Ended December 31, | Period March 17 to December 31, 2009 |
||||||||||||||||
2013 |
2012 |
2011 |
2010 |
|||||||||||||||
| Net asset value (000's) | $ | 27,518 | $ | 130,367 | $ | 143,065 | $ | 142,178 | $ | 143,880 | $ | 128,930 | ||||||
| Number of common shares outstanding (000's) | 10,537 | 10,537 | 10,537 | 10,537 | 10,537 | 10,537 | ||||||||||||
| Management expense ratio (2) | 0.71 | % | 2.21 | % | 1.96 | % | 1.90 | % | 1.91 | % | 5.51 | % | ||||||
| Portfolio turnover rate (3) | -92.11 | % | 25.23 | % | 14.79 | % | 79.90 | % | 86.60 | % | 36.69 | % | ||||||
| Trading expense ratio (4) | 0.02 | % | 0.00 | % | 0.01 | % | 0.00 | % | 0.01 | % | 0.01 | % | ||||||
| Net asset value per common share | $ | 2.61 | 12.37 | $ | 13.58 | $ | 13.49 | $ | 13.65 | $ | 12.23 | |||||||
| Closing market price - common share(5) | n/a | 10.01 | $ | 12.69 | $ | 11.84 | $ | 12.54 | $ | 11.40 | ||||||||
| (1) | Management expense ratio is annualized and based on total expenses for the period and is expressed as a percentage of weekly average net asset values over the period. For 2009, this ratio is calculated from the date the Company began operating its business as an investment corporation, on March 17, 2009, to December 31, 2009. | ||
| (2) | The Management expense ratio for 2009 includes offering costs for the IPO of $6,268,800 less the offsetting related future tax benefit of $1,692,500. | ||
| (3) | The Company's portfolio turnover rate indicates how actively the Company manages its portfolio investments. A portfolio turnover rate of 100% is equivalent to the Company buying and selling all of the securities in its portfolio once in the course of the year. The higher a portfolio turnover-rate in a year, the greater the trading costs payable by the Company in the year. There is not necessarily a relationship between a high turnover rate and the performance of the investment portfolio. | ||
| (4) | The trading expense ratio represents total commissions and other portfolio transaction costs expressed as an annualized percentage of daily average net asset value during the period. | ||
| (5) | Voting Shares were delisted from the TSX on April 15, 2014 |
Management Fees
Deans Knight provides administration, financial reporting and other ancillary services required by a publicly listed company, as well as investment management services related to the Remaining Investments, all as more particularly set forth in the Services Agreement between the Company and Deans Knight dated May 20, 2014 and available for review on SEDAR at www.sedar.com. Deans Knight is paid a nominal fee of $10 per month, starting May 1, 2014, for the services it provides to the Company under the Services Agreement. Prior to that, and for the period January 1, 2014 to April 30, 2014, Deans Knight was paid a management fee computed quarterly, at an annual rate of 1.5% of the net asset value plus applicable taxes, and adjusted for certain non-investment related assets.
Past Performance
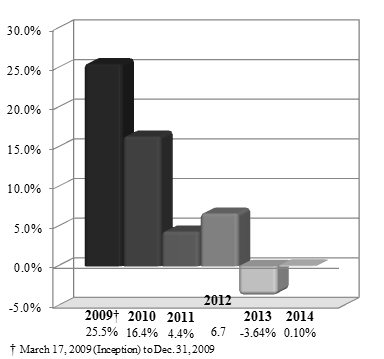
This section shows the Company's past performance, since it began operating its business as an investment fund. The past performance information includes changes in net asset value and assumes the reinvestment of all dividends paid to common shareholders. It is important to note that the past performance will not necessarily indicate what performance in the future will be.
Year-by-year Returns
The accompanying bar chart shows the Company's performance for the years shown and illustrates how the Company's performance has changed from year to year. The bar chart shows, in percentage terms, how much an investment made from when the Company began its operation as an investment fund on March 17, 2009 to December 31, 2009, and how much an investment made for the years ending December 31, 2010, 2011, 2012, 2013 and how much an investment made for the six-month period ending June 30, 2014. Given the Company has ceased all investing activities, other than liquidating the Remaining Investments, the return provided below for the six months ended June 30, 2014 of 0.10% is not necessarily indicative of what the return would have been for the period if the Company had continued to actively manage the investment portfolio.
To view the chart accompanying this press release, please visit the following link: http://media3.marketwire.com/docs/964025chart.jpg
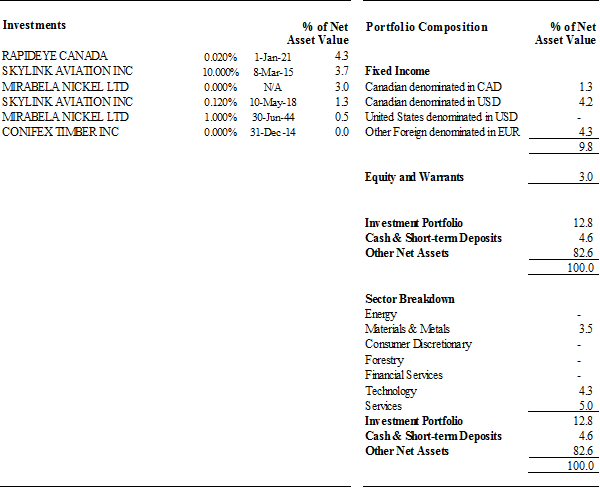
Summary of Investment Portfolio
The following is a summary of the Company's investment portfolio as at June 30, 2014. This is a summary only and will change as the Company divests the Remaining Investments. A quarterly update is available at www.dkincomecorp.com.
To view the table accompanying this press release, please visit the following link: http://media3.marketwire.com/docs/964025table.jpg
Interim Financial Statements
June 30, 2014
(Unaudited)
Notice of No Auditor Review of Interim Financial Statements
The accompanying unaudited interim financial statements of the Company have been prepared in compliance with International Financial Reporting Standards and are the responsibility of the Company's management.
The Company's independent auditor has not performed a review of these financial statements. The Company's auditor will perform an audit of the December 31, 2014 financial statements.
| Deans Knight Income Corporation | ||||||
| Interim Statements of Financial Position | ||||||
| (Unaudited) | ||||||
| June 30, 2014 $ |
December 31, 2013 $ |
January 1, 2013 $ |
||||
| Assets | ||||||
| Current Assets | ||||||
| Investments - at fair value (cost - June 30, 2014 - $2,479,138, December 31, 2013 - $68,222,974, January 1, 2013 - $117,207,284) | 3,511,452 | 65,659,396 | 119,578,722 | |||
| Cash and cash equivalents | 1,274,500 | 64,573,401 | 20,091,125 | |||
| Accrued interest receivable | 54,004 | 786,745 | 1,662,373 | |||
| Prepaid expenses | 32,000 | 41,370 | 56,460 | |||
| Prepaid tax asset | 22,690,000 | - | - | |||
| 27,561,956 | 131,060,912 | 141,388,680 | ||||
| Non-Current Assets | ||||||
| Deferred income tax benefits (note 6) | - | 180,000 | 2,390,000 | |||
| Total Assets | 27,561,956 | 131,240,912 | 143,778,680 | |||
| Liabilities | ||||||
| Current Liabilities | ||||||
| Accounts payable and accrued liabilities (note 4) | 43,739 | 873,905 | 713,711 | |||
| Net assets | 27,518,217 | 130,367,007 | 143,064,969 | |||
| Shareholders' equity | ||||||
| Common shares (note 3) | 17,724,189 | 99,366,429 | 99,366,429 | |||
| Contributed surplus (note 3) | 9,904,504 | 9,904,504 | 9,904,504 | |||
| (Deficit) Retained earnings | (110,476 | ) | 21,096,074 | 33,794,036 | ||
| 27,518,217 | 130,367,007 | 143,064,969 | ||||
| Number of common shares outstanding (note 3) | 10,537,263 | 10,537,263 | 10,537,263 | |||
| Net assets per common share (note 6) | 2.61 | 12.37 | 13.58 | |||
| Contingencies (notes 1 and 6) | ||||||
| Commitments (notes 1 and 8) | ||||||
| Going concern (note 1) | ||||||
| Subsequent events (note 6) | ||||||
| The accompanying notes are an integral part of these interim unaudited financial statements. |
| Deans Knight Income Corporation | |||||
| Interim Statements of Comprehensive Income | |||||
| Six-month period ended June 30, 2014 and 2013 | |||||
| (Unaudited) | |||||
| 2014 $ |
2013 $ |
||||
| Investment income | |||||
| Interest for distribution purposes | 985,212 | 5,404,383 | |||
| Royalty | 189,601 | 199,531 | |||
| Net realized loss on investments sold (note 5) | (3,446,354 | ) | (7,052,919 | ) | |
| Net realized loss on foreign currency contracts (note 5) | (450,708 | ) | (1,358,770 | ) | |
| Change in unrealized appreciation on investments (note 5) | 3,595,891 | 5,187,866 | |||
| Unrealized depreciation on foreign currency contracts (note 5) | - | (1,327,454 | ) | ||
| 873,642 | 1,052,637 | ||||
| Expenses | |||||
| Management fees (note 4) | 554,701 | 1,089,013 | |||
| Public company reporting costs | 107,088 | 98,088 | |||
| Director's fees and expenses | 40,292 | 79,100 | |||
| Legal fees (note 4) | 31,733 | 176,101 | |||
| Transaction costs | 28,552 | 11,187 | |||
| Audit, accounting and tax fees | 21,151 | 43,355 | |||
| Custodial fees | 14,376 | 23,798 | |||
| Independent Review Committee Fees | 6,225 | 6,225 | |||
| 804,118 | 1,526,867 | ||||
| Increase (decrease) in net assets from operations before tax | 69,524 | (474,230 | ) | ||
| Provision for deferred income tax (note 6) | (180,000 | ) | (1,130,000 | ) | |
| Decrease in net assets from operations | (110,476 | ) | (1,604,230 | ) | |
| Decrease in net assets from operations per weighted average common share (note 2) | (0.01 | ) | (0.15 | ) | |
| The accompanying notes are an integral part of these interim unaudited financial statements. |
| Deans Knight Income Corporation | ||||||||||
| Interim Statements of Changes in Equity | ||||||||||
| Six-month period ended June 30, 2014 and 2013 | ||||||||||
| (Unaudited) | ||||||||||
| Common shares $ |
Contributed surplus $ |
Retained earnings (deficit) $ |
Total shareholders' equity $ |
|||||||
| At January 1, 2013 | 99,366,429 | 9,904,504 | 33,794,036 | 143,064,969 | ||||||
| Decrease in net assets from operations | - | - | (1,604,230 | ) | (1,604,230 | ) | ||||
| Dividends paid from net investment income | - | - | (3,685,935 | ) | (3,685,935 | ) | ||||
| At June 30, 2013 | 99,366,429 | 9,904,504 | 28,503,871 | 137,774,804 | ||||||
| Common shares $ |
Contributed surplus $ |
Retained earnings (deficit) $ |
) | Total shareholders' equity $ |
||||||
| At January 1, 2014 | 99,366,429 | 9,904,504 | 21,096,074 | 130,367,007 | ||||||
| Decrease in net assets from operations | - | - | (110,476 | ) | (110,476 | ) | ||||
| Return of Capital (note 3) | (81,642,240 | ) | - | (21,096,074 | ) | (102,738,314 | ) | |||
| At June 30, 2014 | 17,724,189 | 9,904,504 | (110,476 | ) | 27,518,217 | |||||
| The accompanying notes are an integral part of these interim unaudited financial statements. |
| Deans Knight Income Corporation | |||||
| Interim Statements of Cash Flows | |||||
| Six-month period ended June 30, 2014 and 2013 | |||||
| (Unaudited) | |||||
| 2014 $ |
2013 $ |
||||
| Cash flows from operating activities | |||||
| Decrease in net assets from operations | (110,476 | ) | (1,604,230 | ) | |
| Items not affecting cash | |||||
| Net realized loss on investments sold | 3,446,354 | 7,052,919 | |||
| Net realized loss on settlement of foreign currency contracts | 450,708 | 1,358,770 | |||
| Change in unrealized appreciation on investments | (3,595,891 | ) | (5,187,866 | ) | |
| Unrealized depreciation on foreign currency contracts | - | 1,327,454 | |||
| Interest for distribution purposes | (985,212 | ) | (5,404,383 | ) | |
| Royalty | (189,601 | ) | (199,531 | ) | |
| Provision for deferred income tax | 180,000 | 1,130,000 | |||
| (804,118 | ) | (1,526,867 | ) | ||
| Cost of investments purchased (note 5) | (32,204 | ) | (16,081,596 | ) | |
| Proceeds from investments sold (note 5) | 61,878,978 | 20,273,556 | |||
| Net change in non-cash balances related to operations | |||||
| Interest received | 1,655,770 | 5,438,917 | |||
| Royalty received | 251,783 | 272,256 | |||
| Prepaid expenses | 9,370 | (44,982 | ) | ||
| Prepaid tax asset | (22,690,000 | ) | - | ||
| Accounts payable and accrued liabilities | (830,166 | ) | 38,470 | ||
| 39,439,413 | 8,299,751 | ||||
| Cash flows from financing activities | |||||
| Return of capital to common shareholders (notes 3 and 8) | (102,738,314 | ) | - | ||
| Dividends to common shareholders (note 8) | - | (3,685,935 | ) | ||
| (102,738,314 | ) | (3,685,935 | ) | ||
| Net (decrease) increase in cash and cash equivalents during | |||||
| the period | (63,298,901 | ) | 4,683,819 | ||
| Cash and cash equivalents - Beginning of period | 64,573,401 | 20,091,125 | |||
| Cash and cash equivalents - End of period | 1,274,500 | 24,774,944 | |||
| Cash and cash equivalents comprise | |||||
| Cash | 1,274,500 | 5,817,209 | |||
| Short-term deposits | - | 18,957,735 | |||
| 1,274,500 | 24,774,944 | ||||
| The accompanying notes are an integral part of these interim unaudited financial statements. |
| Deans Knight Income Corporation | |||||||
| Interim Schedule of Investment Portfolio | |||||||
| As at June 30, 2014 | |||||||
| (Unaudited) | |||||||
| Par value1 $ |
Average cost2 $ |
Fair value2
$ |
Percentage of total fair value3 % |
||||
| Fixed income | |||||||
| Denominated in Canadian dollars | |||||||
| Skylink Aviation Inc. 12.25% 05-10-2018 | 558,005 | 558,005 | 351,543 | 10.0 | |||
| Denominated in United States dollars | |||||||
| Mirabela Nickel Ltd. 1.00% 06-30-2044 | 117,084 | 124,999 | 124,999 | 3.6 | |||
| Skylink Aviation Inc. 10.00% 03-08-20154 | 965,183 | 982,991 | 1,030,430 | 29.4 | |||
| 1,107,990 | 1,155,429 | 33.0 | |||||
| Total fixed income | 1,665,995 | 1,506,972 | 43.0 | ||||
| Equities - Canada | |||||||
| Conifex Timber Inc. - purchase warrants | |||||||
| $9.33 strike, 12-31-2014 | 81,726 | - | 7,730 | 0.2 | |||
| Mirabela Nickel Ltd. - common shares | 20,231,470 | 813,143 | 814,600 | 23.2 | |||
| Total equities | 813,143 | 822,330 | 23.4 | ||||
| Royalties - Canada | |||||||
| Denominated in Euro | |||||||
| RapidEye Canada Royalty | - | 1,182,150 | 33.6 | ||||
| Total investments | 2,479,138 | 3,511,452 | 100.0 | ||||
| 1 Par values are presented in their source currency | |||||||
| 2 All amounts are shown in Canadian dollars | |||||||
| 3 Percentages are shown as a percentage of total investments | |||||||
| 4 These investments represent loans receivable | |||||||
| The accompanying notes are an integral part of these unaudited financial statements. |
Deans Knight Income Corporation
Notes to Interim Financial Statements
June 30, 2014
(Unaudited)
1. Nature of operations and basis of presentation
Deans Knight Income Corporation (the "Company") is a corporation continued under the laws of Canada on April 11, 2001. The Company is a public closed-end, non-redeemable investment company, which prior to April 15, 2014 was listed on the Toronto Stock Exchange. The address of the Company's registered office, and its principal place of business, is 1500 - 999 West Hastings Street, Vancouver, British Columbia.
In April 2014, the Company's shareholders voted in favour of the special resolution authorizing: (i) an extension of the termination date of the Company until such time as reasonably practicable following the conclusion of the Canada Revenue Agency ("CRA") tax matter (note 6); and (ii) the removal of the restrictions on business that the Company can carry on. Going forward, the Company's business will comprise of (i) divesting of any remaining investments held; (ii) attending to, and if necessary, litigating, the CRA audit and related tax appeal (note 6); and, (iii) attending to any distributions to shareholders of surplus cash and the eventual wind-up and termination of the Company thereafter.
Prior to April 30, 2014, the Company's investment objectives were to: (i) maximize the total return for shareholders, consisting of dividend income and capital appreciation; and (ii) provide shareholders with monthly dividends targeted to payout a minimum of 75% of net investment income annually. The Company did this through investing primarily in corporate debt rated BBB or below by recognized credit rating organizations. Prior to its reorganization in May 2008, the Company was a life sciences company involved in the research, development and commercialization of innovative products for the prevention and treatment of life-threatening diseases.
As per the Company's Articles of Incorporation, the common shares of the Company are to be redeemed at such time as is reasonably practicable following the resolution of the CRA tax audit and related tax appeal (note 6), or such other date as the Company deems appropriate, on not less than 30 days' notice to shareholders. The common shares are presented as equity because they meet the criteria in paragraphs 16C - D of International Accounting Standards ("IAS") 32 'Financial Instruments: Presentation' for such classification.
The Company does not anticipate that there will be a resolution to the CRA tax dispute in the next 12 months, and as such is not anticipating winding up in that period. Therefore, these financial statements have been prepared on a going concern basis. If a resolution was achieved, or the Company deems it appropriate to wind up, then the Company would settle all outstanding liabilities, including obtaining a tax clearance certificate, and redeem the common shares of the Company.
2. Summary of significant accounting policies
The following is a summary of significant accounting policies followed by the Company.
Basis of preparation and adoption of IFRS
These financial statements have been prepared in compliance with International Financial Reporting Standards ("IFRS") applicable to the preparation of interim financial statements, including IAS 34, Interim Financial Reporting and IFRS 1, First-time Adoption of International Financial Reporting Standards. The Company adopted this basis of accounting on January 1, 2014, as required by Canadian securities legislation and the Canadian Accounting Standards Board. Previously, the Company prepared its financial statements in accordance with Canadian generally accepted accounting principles as defined in the Part V of the Chartered Professional Accountant ("CPA") Canada Handbook ("Canadian GAAP"). The comparative information has been restated from Canadian GAAP to comply with IFRS. The Company has consistently applied the accounting policies used in the preparation of its opening IFRS statement of financial position as at January 1, 2013 and throughout all periods presented, as if these policies had always been in effect. Note 11 discloses the impact of the transition to IFRS on the Company's reported financial position, financial performance and cash flows, including the nature and effect of significant changes in accounting policies from those used in the financial statements for the year ended December 31, 2013 prepared under Canadian GAAP.
The policies applied in these financial statements are based on IFRS issued and outstanding as of August 15, 2014, which is the date on which the interim financial statements were authorized for issue by the Board of Directors. Any subsequent changes to IFRS that are given effect in the Company's annual financial statements for the year ending December 31, 2014 could result in restatement of these financial statements, including the transition adjustments recognized on transition to IFRS.
Financial instruments
a) Classification
The Company classifies its investments in debt and equity securities, and derivatives, as financial assets or financial liabilities at fair value through profit or loss ("FVTPL"). All other financial assets and liabilities are measured at amortized cost.
The FVTPL category has two sub-categories: financial assets or financial liabilities held for trading; and those designated at FVTPL at inception.
(i) Financial assets and liabilities held for trading
A financial asset or financial liability is classified as held for trading if it is acquired or incurred principally for the purpose of selling or repurchasing in the near term or if on initial recognition is part of a portfolio of identifiable financial investments that are managed together and for which there is evidence of a recent actual pattern of short-term profit taking. Derivatives are also categorized as held for trading. The Company does not classify any derivatives as hedges in a hedging relationship.
(ii) Financial assets and liabilities designated at FVTPL at inception
Financial assets and financial liabilities designated at FVTPL at inception are financial instruments that are not classified as held for trading but are managed, and their performance is evaluated, on a fair value basis in accordance with the Company's documented investment strategy. The Company evaluates the information about these financial assets and liabilities on a fair value basis together with other related financial information.
Unlisted or non-exchange traded investments, or investments where a last bid, sale or close price is unavailable, or investments for which market quotations are, in the Company's opinion, inaccurate, unreliable, or not reflective of all available material information, are valued at their fair value as determined by the Company using appropriate and accepted industry valuation techniques including valuation models. The fair value determined using valuation models requires the use of inputs and assumptions based on observable market data including volatility and other applicable rates or prices. In certain circumstances, the fair value may be determined using valuation techniques that are not supported by observable market data.
The resulting values for investments not traded in an active market may differ from values that would be determined had a ready market existed, and the difference could be significant.
(b) Recognition, de-recognition and measurement
Regular way purchases and sales of investments are recognized on the trade date - the date on which the Company commits to purchase or sell the investment. Financial assets are derecognized when the rights to receive cash flows from the investments have expired or the Company has transferred substantially all risks and rewards of ownership.
Financial assets and financial liabilities at FVTPL are initially recognized at fair value. Transaction costs are expensed as incurred. Subsequent to initial recognition, all financial assets and financial liabilities at FVTPL are measured at fair value. Gains and losses arising from changes in the fair value of the 'financial assets or financial liabilities at FVTPL' category are included in the statements of comprehensive income in the period in which they arise.
Under the amortized cost method, financial assets and liabilities reflect the amount required to be received or paid, discounted, when appropriate, at the contract's effective interest rate. The calculation includes all fees paid or received between parties to the contract that are an integral part of the effective interest rate, transaction costs and all other premiums or discounts.
At each reporting date, the Company assesses whether there is objective evidence that a financial asset at amortized cost is impaired. If such evidence exists, the Company recognizes an impairment loss as the difference between the amortized cost of the financial asset and the present value of the estimated future cash flows, discounted using the instrument's original effective interest rate. Impairment losses on financial assets at amortized cost are reversed in subsequent periods if the amount of the loss decreases and the decrease can be related objectively to an event occurring after the impairment was recognized.
The interest for distribution purposes shown on the statements of comprehensive income represents the coupon interest received by the Company accounted for on an accrual basis. The Company does not amortize premiums paid or discounts received on the purchase of fixed income securities except for zero coupon bonds, which are amortized on a straight line basis.
Realized gain/loss on sale of investments and unrealized appreciation/depreciation in investments are determined on an average cost basis. Average cost does not include amortization of premiums or discounts on fixed income securities with the exception of zero coupon bonds. Royalty income is recognized on an accrual basis as earned. Dividend income is recognized at the ex-dividend date.
Transaction costs are any costs that can be directly attributable to the acquisition and disposal of an investment, which include fees and commissions paid to agents, advisors, brokers and dealers; levies by regulatory agencies and securities exchanges; and transfer taxes and duties.
(c) Presentation
Financial assets and liabilities are offset and the net amount reported in the statements of financial position, when there is a legally enforceable right to offset the recognized amounts and there is an intention to settle on a net basis, or to realize the asset and settle the liability simultaneously. In the normal course of business, the Company may enter into master netting arrangements or similar agreements that do not meet the criteria for offsetting in the statements of financial position, but still allow for the related amounts to be offset in certain circumstances, such as bankruptcy or termination of the contracts.
Fair value measurement
Fair value is the price that would be received to sell an asset or paid to transfer a liability in an orderly transaction between market participants at the measurement date. The fair value of financial assets and liabilities traded in active markets (such as publicly traded derivatives and marketable securities) are based on quoted market prices at the close of trading on the reporting date. The Company uses the last traded market price for both financial assets and financial liabilities where the last traded price falls within that day's bid-ask spread. In circumstances where the last traded price is not within the bid-ask spread, management determines the point within the bid-ask spread that is most representative of fair value based on the specific facts and circumstances. The Company's policy is to recognize transfers into and out of the fair value hierarchy levels as of the date of the event or change in circumstances giving rise to the transfer.
The fair value of financial assets and liabilities that are not traded in an active market is determined using valuation techniques. The Company uses a variety of methods and makes assumptions that are based on market conditions existing at each reporting date. Valuation techniques include the use of comparable recent arm's length transactions, reference to other instruments that are substantially the same, discounted cash flow analysis, option pricing models and others commonly used by market participants and which make the maximum use of observable inputs. In certain circumstances, the fair value may be determined using valuation techniques that are not supported by observable market data.
The resulting values for investments not traded in an active market may differ from values that would be determined had a ready market existed, and the difference could be significant.
Specifically, financial assets and liabilities that are classified as held for trading are recorded at fair values determined as follows
Foreign currency contracts
Foreign currency contracts (note 7) entered into by the Company are valued at an amount that is equal to the gain or loss that would be realized if the position were to be closed out, which is equivalent to the difference between the deliverable asset and the value of the asset to be received.
Warrants
Warrants are recorded at their estimated fair value using a Black Scholes pricing model, which includes the following inputs: the underlying stock price; the warrant's exercise price; the expected term of the warrant; the underlying stock volatility, expected dividend yield and risk-free interest rate.
Financial assets and liabilities that are designated at FVTPL at inception are recorded at fair values determined as follows:
Equities
Publicly traded equities are recorded at closing prices as quoted on recognized stock exchanges.
The amounts at which the Company's publicly-traded investments could be disposed of currently may differ from the carrying value based on market quotes, as the value at which significant ownership positions are sold is often different than the quoted market price due to a variety of factors such as premiums paid for large blocks or discounts due to illiquidity.
Fixed income investments and convertible debentures
Fixed income investments traded on a public securities exchange or traded on an over-the-counter market are valued at the closing price. Where no closing price is available, the last sale price is used where, in management's opinion, this provides the best estimate of fair value.
Fixed income investments not traded on a public securities exchange or over-the-counter market are valued by considering data inputs such as the last price the security was traded at, most recent bid/ask information, prices of similar securities with available prices, and comparison of yields of comparable investments.
Royalties
Royalty investments are measured on a discounted cash flow basis, where the value is imputed through forecasting cash flows using an appropriate discount rate.
Foreign exchange
Assets and liabilities denominated in foreign currencies are translated into Canadian dollars at the exchange rate applicable on the valuation date, which is also its functional and presentation currency. Foreign currency transactions are translated into the functional currency using the exchange rates prevailing at the dates that transactions occur. Foreign currency assets and liabilities denominated in a foreign currency are translated into the functional currency using the exchange rate prevailing at the measurement date. Foreign exchange gains and losses relating to cash are presented as 'Foreign exchange gain (loss) on cash' and those relating to other financial assets and liabilities are presented within 'Net realized gain' and 'Change in unrealized appreciation (depreciation)' in the statements of comprehensive income.
Income taxes
The Company follows the balance sheet liability method of accounting for income taxes. Future income tax assets and liabilities are measured using rates expected to apply to the taxable income in the years in which the temporary differences are expected to be settled. The Company accounts for uncertain tax positions using the contingent liability model, whereby a provision is established only where it is probable that a payment will be required to be made.
Management has estimated the income tax provision and future income tax balances taking into account its expectation of deferred taxable income and an interpretation of the various income tax laws and regulations. It is possible, due to the complexity inherent in estimating income taxes, that the tax provision and deferred tax balances could change (note 6), and the change could be significant.
Net assets per common share
The net assets per common share are computed by dividing the net assets of the Company by the total number of common shares outstanding on the statements of financial position.
Increase in net assets from operations per weighted average common share
The increase in net assets from operations per weighted average common share represents the increase in net assets from operations divided by the weighted average number of common shares outstanding during the period.
The weighted average number of shares outstanding during the period ended June 30, 2014 was 10,537,263 (2013 - 10,537,263). This weighted average includes both the voting common shares and non-voting common shares of the Company.
3. Capital stock
The Company is authorized to issue an unlimited number of voting common shares without par value, and an unlimited number of non-voting common shares without par value. The holders of the voting common shares shall have one vote for each share held. The holders of non-voting common shares will have no such right to vote.
The holders of both the voting common shares and the non-voting common shares shall be entitled to receive dividends, which must be declared and paid in an equal amount per share and at the same time without preference or distinction.
In the event of the liquidation, dissolution or winding-up of the Company whether voluntary or involuntary, or any other distribution of the assets of the Company among its shareholders for the purpose of winding up its affairs, the holders of the voting common shares and the holders of the non-voting common shares shall rank equally and shall be entitled to share and receive the remaining property of the Company.
There were no changes in the number of voting and non-voting common shares during the periods ended June 30, 2014 and 2013. The total shares outstanding at June 30, 2014, December 31, 2013 and January 1, 2013 are
summarized as follows:
| Number of shares |
|
| Voting common shares | 10,191,592 |
| Non-voting common shares | 345,671 |
| Total common shares outstanding | 10,537,263 |
On April 30, 2014, the Company paid a return of capital to shareholders of $102,738,314. This was accounted for by first reducing retained earnings, and then reducing common shares by the residual amount. As a result, retained earnings decreased by $21,096,074, the carrying amount of voting common shares was reduced by $79,100,874 and the carrying amount of non-voting common shares was reduced by $2,541,366.
Contributed surplus
The contributed surplus balance did not change during the periods ended June 30, 2014 and 2013. The balance at June 30, 2014, December 31, 2013 and January 1, 2013 consists of:
| $ | |
| Surplus related to stock compensation, warrants and options associated with common shares | 8,030,295 |
| Surplus relating to warrants associated with previously issued preferred shares | 1,874,209 |
| 9,904,504 |
4. Related party transactions and balances
Deans Knight Capital Management (the "Investment Advisor"), a corporation with common directors and officers of the Company, provides administration, financial reporting and other ancillary services required by a public company. The Investment Advisor is also providing investment management services related to the disposition of the remaining investments held by the Company. The Investment Advisor is paid a nominal fee of $10 per month, starting May 1, 2014, for the services it provides to the Company under the Services Agreement. Prior to that, and for the period from January 1, 2014 to April 30, 2014, Deans Knight was paid a management fee computed quarterly, at an annual rate of 1.5% of the net asset value plus applicable taxes, and adjusted for certain non-investment related assets.
For the six-month period ending June 30, 2014, management fees totaled $554,701 (2013 - $1,089,013). At June 30, 2014, $20 (June 30, 2013 - $536,774) was owed to the Investment Advisor, which was unsecured and included in accounts payable and accrued liabilities in the statements of financial position, and is payable immediately.
A former director of the Company, who was no longer a director in 2014, is a partner at a law firm that provides legal services to the Company. During the six-month period ending June 30, 2013, the Company incurred $175,830 in legal services and disbursements received from this related party, of which $103,000 was owing. This amount was unsecured. At December 31, 2013, all amounts owing had been paid.
5. Net realized loss on investments sold and foreign currency contracts
The net realized loss on investments sold and foreign currency contracts for the six-month period ended June 30 was as follows:
| 2014 $ |
2013 $ |
||||
| Proceeds from sale of investments | 61,878,978 | 20,273,556 | |||
| Investments at cost - Beginning of period | 68,222,974 | 117,207,284 | |||
| Add: Cost of investments purchased | 32,204 | 16,081,596 | |||
| 68,255,178 | 133,288,880 | ||||
| Less: Investments at cost - End of period | (2,479,138 | ) | (104,603,635 | ) | |
| Cost of investments sold | 65,776,040 | 28,685,245 | |||
| Net realized loss on investments sold | (3,897,062 | ) | (8,411,689 | ) |
| Net realized loss on investments sold and foreign currency contracts consists of: | |||||
| 2014 $ |
2013 $ |
||||
| Realized loss on investments sold | (3,446,354 | ) | (7,052,919 | ) | |
| Realized loss on settlement of foreign currency contracts | (450,708 | ) | (1,358,770 | ) | |
| (3,897,062 | ) | (8,411,689 | ) | ||
6. Taxation
Uncertainty of deductibility of tax losses
Prior to the reorganization and change in business in May 2008 as discussed in note 1, the Company had generated significant tax losses and other tax attributes as a result of its prior businesses and research activities. In its tax filings since the reorganization, the Company has taken the position that these losses and other tax attributes could be used to offset profits generated by the Company, thereby reducing its taxes payable.
On July 16, 2014, the Company received Notices of Reassessment ("NORAs") from the CRA for the taxation years 2009 to 2012, inclusive. In the NORAs, the CRA denied the use of certain tax attributes by the Company on the basis that an acquisition of control of the Company occurred and on the basis of the General Anti-Avoidance Rule in the Income Tax Act (Canada) (the "CRA Matter").
The Company, in consultation with its legal advisors, remains of the view that its tax filing position is appropriate, and intends to vigorously defend its position. As such, on July 24, 2014, the Company filed Notices of Objection to the NORAs. If the CRA does not reverse its ruling within 90 days from the date the Notices of Objection were filed, the Company intends to appeal to the Tax Court of Canada to defend its tax filing position.
The NORAs indicate the Company's tax liability for the 2009 to 2012 taxation years to be approximately $22.7 million or $2.15 per share ("Disputed Amount"), including arrears interest and penalties. If the CRA's position were to be followed by the Company in future years, the overall tax liability will continue to fluctuate depending on the profitability of the Company. Given the Company's financial results for 2013, the Company estimates it is entitled to a refund of $1.1 million ("2013 Tax Refund") following the CRA's position. As such, the Company estimates its overall potential net tax liability to be approximately $21.6 million, or $2.05 per share ("Potential Tax Liability").
The Company has prepaid the Disputed Amount to the CRA to minimize any further interest from accruing.
Should the Company be successful in defending its tax filing position, the Disputed Amount will be refunded with interest. However, if the Company is unsuccessful, the Disputed Amount of $22,690,000, as well as any amounts claimed subsequent to the 2012 taxation year would be recorded as a charge to income.
Deferred tax asset
Deferred income tax assets are recognized only to the extent that it is probable that future taxable income will be available against which temporary differences can be utilized.
The tax effects of temporary differences and tax credits that give rise to significant components of the future income tax assets, at the statutory enacted rates when such benefits are expected to be realized, are as follows:
| Research and development expenses $ |
Issuance costs $ |
Total $ |
||||||
| At January 1, 2013 | 2,076,560 | 313,440 | 2,390,000 | |||||
| Charged to the income statement | (816,560 | ) | (313,440 | ) | (1,130,000 | ) | ||
| At June 30, 2013 | 1,260,000 | - | 1,260,000 | |||||
| At January 1, 2014 | 180,000 | - | 180,000 | |||||
| Charged to the income statement | (180,000 | ) | - | (180,000 | ) | |||
| At June 30, 2014 | - | - | - | |||||
| Future tax assets expected to be realized in: | |||||
| June 30, 2014 $ |
December 31, 2013 $ |
January 1, 2013 $ |
|||
| Less than 12 months | - | 180,000 | 1,930,000 | ||
| Greater than 12 months | - | - | 460,000 | ||
| Net future tax asset | - | 180,000 | 2,390,000 | ||
The tax balances and income tax expense recognized by the Company are based on management's interpretation of the tax laws. Due to the complexity inherent in tax interpretations, regulations and legislation, there are significant estimates required to compute income tax balances. It is possible that some or all of the Company's significant components of the future income tax assets may not be deductible for tax purposes and, accordingly, the amount of future income taxes and provision for income taxes recorded in the financial statements could change by a material amount.
In determining the amount of future income tax assets recognized, management assessed the projected taxable income of the Company. Inherent in all forward looking information is uncertainty and actual amounts could differ from these estimates and the difference could be material. In developing the projection, management has assumed full payment of all contractual interest and that investments will be sold at their current value.
Tax pools available to offset future tax expense and payable
The operations of the Company and related tax interpretations, regulations and legislation are continually changing. As a result, significant estimates are required to compute income tax balances. As at June 30, 2014, the Company has accumulated non-capital losses of approximately $2,476,000 and scientific research and experimental development expenditures in the amount of $18,135,000 available to offset future tax expense and payable. The non-capital losses will expire in 2033, whereas the scientific research and experimental development expenditures are available for carry forward indefinitely. In addition, the Company also has accumulated approximately $7,097,000 of unclaimed federal investment tax credits, which expire as follows:
| Investment tax credits $ |
|
| Year of expiry | |
| 2018 | 265,000 |
| 2019 | 990,000 |
| 2020 | 1,872,000 |
| 2021 | 2,483,000 |
| 2022 | 298,000 |
| 2023 | 187,000 |
| 2024 | 496,000 |
| 2025 | 506,000 |
| 7,097,000 |
Reconciliation of income tax expense
The reconciliation of income tax computed at the statutory tax rate to income tax expense at June 30, using a 26.0% statutory tax rate (2013 - 25.75%), is:
| 2014 $ |
2013 $ |
||||
| Increase (decrease) in net assets from operations before tax | 69,524 | (474,230 | ) | ||
| Statutory tax rate | 26.00 | % | 25.75 | % | |
| Income tax expense (recovery) at statutory rates | 18,076 | (122,114 | ) | ||
| Non-capital loss carry forward | - | 122,114 | |||
| Use of non-capital loss carry forward | (18,076 | ) | - | ||
| Reduction of future tax asset | 180,000 | 870,000 | |||
| Provision for future income tax | 180,000 | 870,000 |
7. Financial instruments
The following tables present the carrying amounts of the Company's financial instruments by category as at June 30, 2014:
| Financial instruments by category | Amortized cost $ |
Assets/liabilities at FVTPL $ |
Total $ |
||
| Assets as per statements of financial position | |||||
| Held for trading: | |||||
| Warrants | - | 7,730 | 7,730 | ||
| Designated as FVTPL: | |||||
| Investments | - | 3,503,722 | 3,503,722 | ||
| Cash and accrued interest receivable | 1,328,504 | - | 1,328,504 | ||
| 1,328,504 | 3,511,452 | 4,839,956 | |||
| Liabilities as per statements of financial position | |||||
| Held for trading: | |||||
| Accounts payable and accrued liabilities | 43,739 | - | 43,739 | ||
| 43,739 | - | 43,739 | |||
The following tables present the carrying amounts of the Company's financial instruments by category as at December 31, 2013:
| Financial instruments by category | Amortized cost $ |
Assets/liabilities at FVTPL $ |
Total $ |
||
| Assets as per statements of financial position | |||||
| Held for trading: | |||||
| Warrants | - | 106,629 | 106,629 | ||
| Designated as FVTPL: | |||||
| Investments | - | 65,616,567 | 65,616,567 | ||
| Cash and accrued interest receivable | 65,360,146 | - | 65,360,146 | ||
| 65,360,146 | 65,723,196 | 131,083,342 | |||
| Liabilities as per statements of financial position | |||||
| Held for trading: | |||||
| Foreign currency contracts | - | 63,800 | 63,800 | ||
| Accounts payable and accrued liabilities | 873,905 | - | 873,905 | ||
| 873,905 | 63,800 | 937,705 | |||
The following tables present the carrying amounts of the Company's financial instruments by category as at January 1, 2013:
| Financial instruments by category | Amortized cost $ |
Assets/liabilities at FVTPL $ |
Total $ |
||
| Assets as per statements of financial position | |||||
| Held for trading: | |||||
| Warrants | - | 677,413 | 677,413 | ||
| Designated as FVTPL: | |||||
| Investments | - | 119,197,904 | 119,197,904 | ||
| Cash and accrued interest receivable | 21,753,498 | - | 21,753,498 | ||
| 21,753,498 | 119,875,317 | 141,628,815 | |||
| Liabilities as per statements of financial position | |||||
| Held for trading: | |||||
| Foreign currency contracts | - | 296,595 | 296,595 | ||
| Accounts payable and accrued liabilities | 713,711 | - | 713,711 | ||
| 713,711 | 296,595 | 1,010,306 | |||
Fair value measurement
Financial instruments are classified in a hierarchy that prioritizes the inputs to fair value measurement. Each level is based on the transparency of the inputs used to measure the fair values of assets and liabilities. The three levels of the fair value hierarchy are:
Level 1 - inputs that reflect unadjusted quoted prices in active markets for identical assets or liabilities;
Level 2 - inputs that reflect other than quoted prices that are observable for the assets or liabilities either directly or indirectly;
Level 3 - inputs that are not based on observable market data.
If inputs of different levels are used to measure an asset's or liability's fair value, the classification within the hierarchy is based on the lowest level input that is significant to the fair value measurement. The following table illustrates the classification of the Company's assets and liabilities measured at fair value within the fair value hierarchy as at June 30, 2014, December 31, 2013 and January 1, 2013:
The following tables illustrate the classification of the Company's financial instruments within the fair value hierarchy:
| Financial assets at fair value - June 30, 2014 | |||||||||
Level 1 $ |
Level 2 $ |
Level 3 $ |
Total $ |
||||||
| Corporate debt | - | - | 1,506,972 | 1,506,972 | |||||
| Equity | 814,600 | - | 7,730 | 822,330 | |||||
| Royalty | - | - | 1,182,150 | 1,182,150 | |||||
| 814,600 | - | 2,696,852 | 3,511,452 | ||||||
| Financial assets at fair value - December 31, 2013 | |||||||||
Level 1 $ |
Level 2 $ |
Level 3 $ |
Total $ |
||||||
| Corporate debt | - | 50,264,259 | 6,334,859 | 56,599,118 | |||||
| Convertible debentures | - | 1,060,000 | - | 1,060,000 | |||||
| Equity | 6,716,216 | - | 106,629 | 6,822,845 | |||||
| Royalty | - | - | 1,241,233 | 1,241,233 | |||||
| Foreign currency contracts | - | (63,800 | ) | - | (63,800 | ) | |||
| 6,716,216 | 51,260,459 | 7,682,721 | 65,659,396 | ||||||
| Financial assets at fair value - January 1, 2013 | |||||||||
Level 1 $ |
Level 2 $ |
Level 3 $ |
Total $ |
||||||
| Corporate debt | - | 94,459,352 | 13,965,857 | 108,425,209 | |||||
| Convertible debentures | - | 2,200,000 | - | 2,200,000 | |||||
| Equity | 8,696,425 | - | 677,413 | 9,373,838 | |||||
| Royalty | - | - | 1,238,770 | 1,238,770 | |||||
| Other | - | (1,362,500 | ) | - | (1,362,500 | ) | |||
| Foreign currency contracts | - | (296,595 | ) | - | (296,595 | ) | |||
| 8,696,425 | 95,000,257 | 15,882,040 | 119,578,722 | ||||||
There were no transfers between Level 1 and Level 2 of the fair value hierarchy.
All fair value measurements above are recurring.
The following tables reconcile the Company's Level 3 fair value measurements:
| Corporate debt $ |
Equities $ |
Royalty $ |
Total $ |
||||||||
| Balance - January 1, 2013 | 13,965,857 | 677,413 | 1,238,770 | 15,882,040 | |||||||
| Purchases | 982,991 | - | - | 982,991 | |||||||
| Sales | (3,000,000 | ) | - | - | (3,000,000 | ) | |||||
| Realized and unrealized (depreciation) appreciation included in net loss on investments | 319,805 | (286,794 | ) | 74,109 | 107,120 | ||||||
| Balance - June 30, 2013 | 12,268,653 | 390,619 | 1,312,879 | 13,972,151 | |||||||
| Unrealized appreciation (depreciation) | 319,805 | (286,794 | ) | 74,109 | 107,120 | ||||||
| Balance - January 1, 2014 | 6,334,859 | 106,629 | 1,241,233 | 7,682,721 | |||||||
| Settlement | (813,143 | ) | - | - | (813,143 | ) | |||||
| Sales | (4,000,000 | ) | (264,473 | ) | - | (4,264,473 | ) | ||||
| Realized and unrealized (depreciation) appreciation included in net loss on investments | (14,744 | ) | 165,574 | (59,083 | ) | 91,747 | |||||
| Balance - June 30, 2014 | 1,506,972 | 7,730 | 1,182,150 | 2,696,852 | |||||||
| Unrealized depreciation | (14,744 | ) | (26,466 | ) | (59,083 | ) | (100,293 | ) |
The settlement from Level 3 to Level 1 during the period ended June 30, 2014, totalling $813,143, related to corporate debt securities that were exchanged for common shares traded on an active market, as part of a corporate restructuring.
Level 3 fair value measurements have predominantly been valued by considering data inputs such as the last price the security was traded at, most recent bid/ask information, prices of similar securities with available prices, and comparison of yields of comparable investments. Accordingly, in the absence of any reasonably possible alternative assumptions, and except as noted below, it is not practicable to provide a sensitivity analysis.
For royalty investments measured on a discounted cash flow basis, the value is imputed through forecasted cash flows and discount rates. The following summarizes the affect a change in assumptions would have on total net assets at June 30, 2014:
| Increase by 5% | Decrease by 5% | ||||
| Cash flow growth rate | 237,700 | (184,100 | ) | ||
| Discount rate | (184,800 | ) | 275,300 |
Management of financial risks
In the normal course of business, the Company is exposed to various financial risks, including credit risk, liquidity risk and market risk (consisting of interest rate risk, currency risk and other price risk). The Company's overall risk management program seeks to minimize potentially adverse effects of these risks on the Company's financial performance by employing a professional, experienced portfolio advisor, monitoring daily the Company's positions and market events, diversifying the investment portfolio within the constraints of the investment guidelines and periodically using derivatives to hedge certain risk exposures. Further, the Company monitors the portfolio to ensure compliance with its investment strategy, investment guidelines and securities regulations.
Fair value risk
The Company's investments are exposed to market price risk and this risk affects the fair value of the investments. All investments have an inherent risk of loss of capital. The maximum risk resulting from investments is determined by their fair value. The Company seeks to manage valuation risks by careful selection of investments prior to making an investment and by regular ongoing monitoring of the investment performance of the individual investee companies. A 10% change in the value of the Company's equity investments (excluding warrants) would have an $81,460 impact on profit or loss.
Credit risk
Credit risk is the risk that a counterparty to a financial instrument will fail to discharge an obligation or commitment that it has entered into with the Company.
All transactions executed by the Company in listed securities are settled/paid for upon delivery using approved brokers. The risk of this settlement not occurring is considered minimal, as delivery of securities sold is only made once the broker has received payment. Payment is made on a purchase once the securities have been received by the broker. The trade will fail if either party fails to meet its obligation. Since the Company invests in high-yield debt instruments and derivatives, this represents the main concentration of credit risk. The fair value of debt securities includes consideration of the creditworthiness of the debt issuer. The maximum credit exposure of these assets is represented by their carrying amounts. However, this maximum exposure is mitigated to varying degrees in each investment, based on the collateral held, if any. Collateral may include such things as a general security agreement over all assets, or specific security over specific assets. It may also entitle the debt holder to take over the overall business through restructuring of the investment.
The Company's credit risk exposure by credit ratings on its investments is listed as follows:
| As a % of net assets | |||||
| June 30, 2014 |
December 31, 2013 |
January 1, 2013 |
|||
| Credit rating | |||||
| BB+ | - | 4.4 | 4.4 | ||
| BB | - | - | 1.8 | ||
| BB- | - | - | 0.9 | ||
| B+ | - | 2.8 | 8.3 | ||
| B | - | 4.3 | 6.0 | ||
| B- | - | 15.2 | 10.6 | ||
| CCC+ | - | 11.6 | 30.3 | ||
| CCC | - | - | 3.1 | ||
| CCC- | - | - | 2.4 | ||
| D | - | 0.9 | - | ||
| Not rated* | 12.8 | 11.1 | 15.7 | ||
| 12.8 | 50.3 | 83.5 | |||
| * Unrated debt securities consist primarily of loans receivable. |
Credit ratings are obtained from various credit rating agencies and sources. Where one or more rating is obtained for a security, the lowest rating has been used.
Credit risk associated with the Company's cash and cash equivalents is not considered significant, as they are held with Tier 1 Canadian Financial Institutions.
The Company's credit risk exposure by sector on its investments is as follows:
| As a % of net assets | |||||
| June 30, 2014 |
December 31, 2013 |
January 1, 2013 |
|||
| Sector | |||||
| Services | 5.0 | 1.0 | 0.2 | ||
| Technology | 4.3 | 1.0 | 0.9 | ||
| Materials and metals | 3.5 | 5.2 | 13.7 | ||
| Consumer goods | - | 6.5 | 8.4 | ||
| Energy | - | 30.3 | 49.8 | ||
| Financial services | - | 2.5 | - | ||
| Forestry | - | 3.8 | 6.2 | ||
| Industrial/manufacturing | - | - | 4.3 | ||
| 12.8 | 50.3 | 83.5 | |||
Interest rate risk
Interest rate risk arises from the possibility that changes in interest rates will affect future cash flows or fair values of financial instruments.
The Company invests primarily in interest-bearing financial instruments. As such, the Company is exposed to the risk that the value of such financial instruments will fluctuate due to changes in the prevailing levels of market interest rates. The table below summarizes the Company's exposure to interest rate risk by term to maturity on its interest-bearing investments:
| Fair value | |||||
| June 30, 2014 $ |
December 31, 2013 $ |
January 1, 2013 $ |
|||
| Maturity | |||||
| Less than 1 year | 1,030,430 | - | - | ||
| 1 - 3 years | - | 5,228,449 | 20,543,660 | ||
| 3 - 5 years | 351,543 | 38,100,249 | 46,527,959 | ||
| Greater than 5 years | 1,307,150 | 14,110,990 | 42,639,891 | ||
| 2,689,123 | 57,439,688 | 109,711,510 | |||
As at June 30, 2014, if the prevailing interest rates had been raised or lowered by 1%, assuming a parallel shift in the yield curve, with all other factors remaining constant, net assets could possibly have decreased or
increased, respectively, by approximately $120,000, or approximately 0.5% of profit or loss (December 31, 2013 - $2,100,000, or approximately 1.6% of net assets).
Liquidity risk
As the Company is a closed-end investment company with a fixed number of common shares outstanding, unlike an open-ended mutual fund, it is not exposed to the liquidity risk associated with daily cash redemptions of securities.
The Company's remaining investments may not be able to be liquidated quickly at an amount close to their fair value to respond to specific events such as deterioration in the creditworthiness of any particular issuer. Investments held by the Company may be subject to resale restrictions such as hold periods. The resulting values for the Company's remaining investments may differ from values that would be realized had a ready market existed.
The Company continually reviews its investment portfolio to assess liquidity risk on its holdings.
Currency risk
Currency risk is the risk that the value of a financial instrument will fluctuate due to changes in foreign exchange rates. The Company invests a portion of its assets in securities that are denominated in a currency other than the Canadian dollar, which represents the functional currency of the Company. Consequently, the Company is exposed to currency risk as the value of the portfolio securities denominated in currencies other than the Canadian dollar will vary due to changes in foreign currency exchange rates.
Prior to April 30, 2014, being the date the Company returned $102,738,314 of capital to its shareholders (note 3), the Company entered into foreign currency contracts with financial institutions to hedge the value of foreign currency denominated investments. The fair value of these contracts was reflected in investments. Gains or losses arising from these contracts offset the gains or losses from translation of the underlying investments. The unrealized gains or losses were reflected in unrealized appreciation/depreciation on foreign currency contracts on the statements of comprehensive income. The potential impact to net assets of a 5% change in foreign currency rates against the Canadian dollar, assuming all other variables remain constant, would be $157,600 at June 30, 2014 (December 31, 2013 - $160,000).
8. Capital management
The capital of the Company is divided into voting and non-voting common shares, each having an unlimited authorized amount. The number of voting and non-voting shares outstanding and changes thereto, are outlined in note 3. On April 30, 2014, the Company paid a return of capital of $102,738,314 to voting and non-voting common shareholders, equal to $9.75 per share.
The Company manages its capital in accordance with the Company's amended business objectives, as approved by shareholders at a meeting held April 4, 2014. The objectives include: (i) divesting of any remaining investments held; (ii) attending to, and if necessary, litigating, the CRA audit and related tax appeal (note 6); and, (iii) attending to any distributions to shareholders of surplus cash and the eventual wind-up and termination of the Company thereafter.
The Company discontinued its monthly dividend payment of $0.0583 per voting and non-voting common share after its December 2013 payment. As such, there were no dividend payments in the period ended June 30, 2014 (June 2013 - $3,685,935).
9. Cash and cash equivalents
For the purposes of the statements of financial position and cash flow, cash and cash equivalents comprise the following balances with original maturity of less than 90 days:
| June 30, 2014 |
December 31, 2013 |
January 1, 2013 |
|||
| Cash at bank | 1,274,500 | 7,665,211 | 9,110,875 | ||
| Short-term deposits | - | 56,908,190 | 10,980,250 | ||
| Total | 1,274,500 | 64,573,401 | 20,091,125 |
10. Critical accounting estimates and judgments
The preparation of financial statements requires management to use judgment in applying its accounting policies and to make estimates and assumptions about the future. The following discusses the most significant accounting judgments and estimates that the Company has made in preparing the financial statements:
Fair value measurement of derivatives and securities not quoted in an active market
The Company holds financial instruments that are not quoted in active markets. Fair values of such instruments are determined using valuation techniques and may be determined using reputable pricing sources (such as pricing agencies) or indicative prices from market makers. Broker quotes, as obtained from the pricing sources, may be indicative and not executable or binding. Where no market data is available, the Company may value positions using its own models, which are usually based on valuation methods and techniques generally recognized as standard within the industry. Models use observable data, to the extent practicable. However, areas such as credit risk (both own and counterparty), volatilities and correlations require the Company to make estimates. Changes in assumptions about these factors could affect the reported fair values of financial instruments. The Company considers observable data to be market data that is readily available, regularly distributed and updated, reliable and verifiable, not proprietary, and provided by independent sources that are actively involved in the relevant market. Refer to note 2 for further information about the fair value measurement of the Company's financial instruments and to note 7 for further information about level 3 investments.
Deferred income taxes
The tax balances and income tax expense recognized by the Company are based on management's interpretation of the tax laws. Due to the complexity inherent in tax interpretations, regulations and legislation, there are significant estimates required to compute income tax balances. It is possible that some or all of the Company's significant components of the deferred income tax assets may not be deductible for tax purposes and, accordingly, the amount of the prepaid tax assets, deferred income taxes, and provision for income taxes recorded in the financial statements could change by a material amount (note 6).
In determining the amount of deferred income tax assets recognized, management assessed the projected taxable income of the Company. Inherent in all forward looking information is uncertainty and actual amounts could differ from these estimates and the difference could be material. In developing the projection, management has assumed full payment of all contractual interest and that investments will be sold at their current value.
11. Transition to IFRS
Transition elections
The only voluntary exemption adopted by the Company was the ability to designate a financial asset or liability at fair value through profit or loss upon transition to IFRS. All financial assets designated at fair value through profit or loss upon transition were previously carried at fair value under Canadian GAAP as required by Accounting Guideline 18, Investment Companies.
The table below provides a reconciliation of equity and comprehensive income as previously reported under Canadian GAAP to IFRS:
| Equity | June 30, 2014 |
December 31, 2013 |
January 1, 2013 |
||
| Equity as reported per Canadian GAAP | 25,518,217 | 130,147,580 | 142,275,000 | ||
| Revaluation of investments at FVTPL | - | 219,427 | 789,969 | ||
| Equity per IFRS | 25,518,217 | 130,367,007 | 143,064,969 | ||
| Comprehensive income | June 30, 2014 |
June 30, 2013 |
|||
| Comprehensive income as reported per Canadian GAAP | (110,476 | ) | (1,379,632 | ) | |
| Revaluation of investments at FVTPL | - | (224,598 | ) | ||
| Comprehensive income per IFRS | (110,476 | ) | (1,604,230 | ) |
Revaluation of investments at fair value through profit or loss
Under Canadian GAAP, the Company measured the fair value of its investments in accordance with Section 3855, Financial Instruments - Recognition and Measurement, which required the use of bid prices for long positions and ask prices for short positions, to the extent such prices were available. Under IFRS, the Company measures the fair values of its investments using the guidance in IFRS 13, Fair Value Measurement, which requires that if an asset or a liability has a bid price and an ask price, then its fair value is to be based on a price within the bid-ask spread that is most representative of fair value. It also allows the use of mid-market pricing or other pricing conventions that are used by market participants as a practical expedient for fair value measurements within a bid-ask spread. As a result, upon adoption of IFRS an adjustment was recognized to increase the carrying amount of the Company's investments by $789,969 and $219,427 as at December 31, 2013 and January 1, 2013, respectively. The impact of this adjustment was to increase the Company's increase (decrease) in net assets attributable to shareholders by $570,542 for the year ended December 31, 2013.
Reclassification adjustments
In addition to the adjustments noted above, the Company reclassified certain amounts upon transition in order to conform to its financial statement presentation under IFRS. Under Canadian GAAP, the Company presented investment income on the statement of comprehensive income; under IFRS the Company presents royalty and interest and other income separately. Further, the statement of cash flows under IFRS requires the Company to provide the royalty and interest and other income accrued separately to the royalty and interest and other income received.
12. Future accounting changes
IFRS 9, Financial Instruments
The final version of IFRS 9 was issued by the International Accounting Standards Board ("IASB") in July 2014 and will replace IAS 39, Financial Instruments: Recognition and Measurement. IFRS 9 introduces a model for classification and measurement, a single, forward-looking 'expected loss' impairment model and a substantially reformed approach to hedge accounting. The new single, principle based approach for determining the classification of financial assets is driven by cash flow characteristics and the business model in which an asset is held. The new model also results in a single impairment model being applied to all financial instruments, which will require more timely recognition of expected credit losses. It also includes changes in respect of own credit risk in measuring liabilities elected to be measured at fair value, so that gains caused by the deterioration of an entity's own credit risk on such liabilities are no longer recognized in profit or loss. IFRS 9 is effective for annual periods beginning on or after January 1, 2018; however it is available for early adoption. In addition, the own credit changes can be early applied in isolation without otherwise changing the accounting for financial instruments. The Company is in the process of assessing the impact of IFRS 9 and has not yet determined when it will adopt the new standard.
Contact Information:
Craig Langdon
Chief Executive Officer and Director
(604) 669-0212
Deans Knight Income Corporation
Mark Myles
Chief Financial Officer
(604) 669-0212