EDMONTON, ALBERTA--(Marketwired - March 2, 2017) - EPCOR Utilities Inc. (EPCOR) today filed its annual and fourth quarter results for 2016.
"2016 was a defining year for EPCOR with consolidated net income at the highest in a decade reaching $309 million. This, in part, reflected a gain on the sale of EPCOR's remaining ownership interest in Capital Power Corporation," said Stuart Lee, EPCOR President & CEO.
"As well, EPCOR entered Texas with its investment in the 130 Pipeline, a water supply pipeline, near Austin and is set to re-enter the Ontario market with the pending acquisition of the assets of Natural Resource Gas Limited utility in southwestern Ontario. EPCOR also reached substantial completion of the City of Regina's upgraded wastewater treatment plant - on time and on budget. EPCOR will operate and finance the new infrastructure under a 30-year contract with the City."
Backed by a strong and sustainable long-term growth outlook, EPCOR increased its annual dividend to its Shareholder, the City of Edmonton, by $5 million to $146 million commencing in 2017.
"In addition to a strong growth outlook and excellent financial results, EPCOR recorded its best safety performance and highest employee engagement scores in company history. These results were among the most gratifying of the year," said Mr. Lee.
Highlights of EPCOR's financial performance are as follows:
- Net income was $88 million and $309 million for the three and twelve months ended December 31, 2016, respectively, compared with net income of $65 million and $260 million for the corresponding periods in the previous year. Net income was higher for the three months ended December 31, 2016, primarily due to gains resulting from the sale of Capital Power shares and greater favorable fair value adjustments related to financial electricity purchase contracts and interest rate swaps, partially offset by lower income from core operations, as described below. Net income was higher for the twelve months ended December 31, 2016, primarily due to gains resulting from the sale of Capital Power shares, greater favorable fair value adjustments related to financial electricity purchase contracts and higher income from core operations, as described below.
- Income from core operations was $51 million and $255 million for the three and twelve months ended December 31, 2016, respectively, compared with $74 million and $251 million for the corresponding periods in the previous year. Income from core operations was lower for the three months ended December 31, 2016, primarily due to lower transmission customer rates, lower billing charge rates, higher depreciation, and lower income related to industrial services contracts, partially offset by higher approved distribution and water customer rates. Income from core operations was higher for the twelve months ended December 31, 2016, primarily due to higher approved distribution, transmission and water customer rates, gains on sale of surplus land, and growth in the number of water customers, partially offset by higher depreciation, lower billing charge rates and lower water volumes in Canada due to higher precipitation.
- Net cash flows from operating activities was $109 million for the three months ended December 31, 2016, compared with $112 million for the corresponding period in the previous year. The small decrease reflects lower funds from operations offset by higher funds from the change in non-cash operating working capital. Net cash flows from operating activities was $475 million for the twelve months ended December 31, 2016, compared with $416 million for the corresponding period in the previous year. The increase of $59 million was due to higher funds from the change in non-cash operating working capital, partially offset by lower funds from operations.
- Investment in capital projects was $161 million and $553 million for the three and twelve months ended December 31, 2016, respectively, compared with $137 million and $463 million for the corresponding periods in the previous year. The year-to-date increase of $90 million was primarily due to the acquisition of the 130 Pipeline and increased spending in the Distribution and Transmission segment on the Advanced Meter Infrastructure Project and the Work Centre Redevelopment Project.
Management's discussion and analysis (MD&A) of the annual and fourth quarter results are shown below. The MD&A and the audited annual consolidated financial statements are available on EPCOR's website (www.epcor.com) and SEDAR (www.sedar.com).
EPCOR's wholly owned subsidiaries build, own and operate electrical transmission and distribution networks, water and wastewater treatment facilities and infrastructure in Canada and the United States. The Company's subsidiaries also provide electricity, natural gas and water products and services to residential and commercial customers. EPCOR, headquartered in Edmonton, is an Alberta Top 70 employer. EPCOR's website address is www.epcor.com.
EPCOR Utilities Inc.
Management's Discussion and Analysis
December 31, 2016
This management's discussion and analysis (MD&A), dated March 2, 2017, should be read in conjunction with the audited consolidated financial statements of EPCOR Utilities Inc. for the years ended December 31, 2016 and 2015, including related party transactions (note 27) and financial instruments (note 28), and the cautionary statement regarding forward-looking information at the end of this MD&A. In this MD&A, any reference to "the Company", "EPCOR", "it", "its", "we", "our" or "us", except where otherwise noted or the context otherwise indicates, means EPCOR Utilities Inc., together with its subsidiaries. In this MD&A, Capital Power refers to Capital Power Corporation and its directly and indirectly owned subsidiaries including Capital Power L.P., except where otherwise noted or the context otherwise indicates. Financial information in this MD&A is based on the audited consolidated financial statements, which were prepared in accordance with International Financial Reporting Standards (IFRS), and is presented in Canadian dollars unless otherwise specified. In accordance with its terms of reference, the Audit Committee of the Company's Board of Directors reviews the contents of the MD&A and recommends its approval by the Board of Directors. This MD&A was approved and authorized for issue by the Board of Directors on March 2, 2017.
Overview
EPCOR is wholly owned by The City of Edmonton (the City). EPCOR, through wholly owned subsidiaries, builds, owns and operates electrical transmission and distribution networks and provides Regulated Rate Option (RRO) and default supply electricity related services. EPCOR sells electricity and natural gas to Alberta residential consumers under contracts through its Encor brand. In addition, EPCOR builds, owns and operates water and wastewater treatment facilities and infrastructure in Canada and the Southwestern United States (U.S.). The water business includes design, build, finance, operating and maintenance services for municipal and industrial customers in Western Canada.
Net income was $88 million and $309 million for the three and twelve months ended December 31, 2016, respectively, compared with net income of $65 million and $260 million, for the comparative periods in 2015, respectively. The increase of $23 million in the quarter is primarily due to the recognition of the fair value gain resulting from the sale of Capital Power shares (also referred to as the "available-for-sale investment in Capital Power") and greater favorable fair value adjustments related to financial electricity purchase contracts and interest rate swaps, partially offset by lower income from core operations, as described below. The increase of $49 million for the twelve months ended December 31, 2016 was primarily due to the recognition of the fair value gain resulting from the sale of Capital Power shares, greater favorable fair value adjustments related to financial electricity purchase contracts and higher income form core operations as described below.
Net income from core operations was $51 million and $255 million for the three and twelve months ended December 31, 2016, respectively, compared with $74 million and $251 million for the comparative periods in 2015, respectively. The decrease of $23 million in the quarter is primarily due to lower transmission customer rates, lower billing charge rates, higher depreciation, and lower income related to industrial services contracts, partially offset by higher approved distribution and water customer rates. The increase of $4 million for the twelve months ended December 31, 2016 was primarily due to higher approved distribution, transmission and water customer rates, gains on sale of surplus land, and water customer growth, partially offset by higher depreciation, lower billing charge rates and lower water volumes in Canada due to higher precipitation.
Strategy
EPCOR's vision is to be a premier essential services utility company in North America, trusted by our customers and valued by our shareholder. To achieve this vision, EPCOR must excel at its utility operations and be successful in its pursuit of new business growth opportunities. EPCOR's electricity strategy includes maintaining and developing new distribution and transmission infrastructure in its franchise service area as well as the development and / or acquisition of new rate-regulated or contracted assets and operations outside of its service area.
EPCOR's water strategy includes maintaining and developing new water and wastewater infrastructure within its municipal franchise service areas and the development and / or acquisition of new rate-regulated or contracted assets and operations outside of its service areas. This includes design, build, finance and operate services for municipal water and wastewater treatment infrastructure and the provision of water and wastewater treatment services and potable and process water for industrial customers.
We believe the long-term outlook for the North American electricity and water and wastewater treatment businesses remains strong. The demand for electricity and water and wastewater infrastructure in North America is expected to increase due to population growth, aging infrastructure, water scarcity and increased consumer expectations for reliable power, safe, high quality water and environmentally responsible wastewater treatment.
Over the next five years we plan to invest in electricity and water and wastewater treatment assets where appropriate returns are expected, operational excellence can be delivered and the environmental impact is acceptable. We will seek growth opportunities within our existing utility footprint, in addition to the new geographies in which we have made recent acquisitions. This includes exploring opportunities in natural gas distribution through acquisitions and greenfield development. EPCOR also intends to invest in the area of renewable energy generation, including solar and bio gas facilities to enhance our environmental performance.
Maintaining our investment grade credit rating to ensure access to capital through existing and new credit facilities and public or private debt financing offerings remains a priority. We recognize that we are not immune to recessionary trends and will remain vigilant to maintain a prudent balance of rate-regulated and contracted operations within our financial capacity.
Key performance indicators
Operational and financial performance is measured through financial and non-financial measures that are approved by the Board of Directors. The measures fall under four broad categories composed of: health, safety and environment; people; growth (financial); and operational excellence, and are applied across the Company.
There are specific measures established for each business unit and the corporate shared service group in alignment with the Company's strategy. For example, under the health, safety and environment category, safety performance is based on total recordable injury frequency. Business unit measures under the operational excellence category are focused on customer related measures relevant to the particular business unit, such as customer satisfaction survey results and service reliability.
Recordable injury frequency rates for EPCOR overall were better (lower) in 2016 as compared to 2015. We remain committed to building a culture that supports a workplace free of occupational injury and illness with minimized harm to the environment. Segment performance measures are discussed under Segment Results of this MD&A.
Significant events
Sale of Investment in Capital Power
The Company sold 5,901,850 and 9,141,636 common shares of Capital Power, respectively, for net proceeds of $135 million and $204 million for the three and twelve months ended December 31, 2016, respectively. As a result of the sale of Capital Power shares, for the three months and twelve months ended December 31, 2016, the Company reclassified fair value gains of $30 million and $42 million, respectively, from other comprehensive income to net income. These sales were consistent with the Company's intention to sell the shares over time as market conditions permit.
At December 31, 2016, the Company owned 249,364 common shares of Capital Power which were subsequently sold for net proceeds of $6 million in January 2017.
Acquisition of the Assets of Blue Water Project 130 L.P. and Cross County Water Supply Corporation
On August 19, 2016, the Company completed the acquisition of the assets of Blue Water Project 130 L.P. (Blue Water) and Cross County Water Supply Corporation (CCWSC) through EPCOR 130 Project Inc., a wholly owned U.S. subsidiary, and 130 Regional Water Supply Corporation, a Texas Water Supply Corporation of which EPCOR 130 Project Inc. is the sole member. The total consideration was $82 million (US$64 million).
The Blue Water and CCWSC assets include an 85 kilometer water supply pipeline, near Austin, Texas, U.S., with designed capacity of nearly 68 million liters per day, along with groundwater well production systems and long term wholesale water supply agreements (collectively the EPCOR 130 Pipeline).
$48 million (US$37 million) of the total consideration was paid at closing with the balance to be paid in the future, the majority of which is contingent on securing new long term contracts for the supply of water. The Company has recorded the full amount of this contingent consideration at fair value based on expected growth in the region. The Company funded the closing payment by issuing US$40 million of private debt notes with a 25-year term.
The allocation of the purchase price was determined based on the relative fair values of the acquired assets and liabilities. For further information on the fair value estimates, refer to the audited consolidated financial statements of EPCOR Utilities Inc. for the years ended December 31, 2016 and 2015.
Substantial Completion of Regina Wastewater Treatment Facility
During 2016, Water Services reached substantial completion of the wastewater treatment facility for the City of Regina under a public-private partnership. The construction was completed on time and on budget and the Company continued to operate the existing wastewater treatment facility during the construction period. The upgraded facility meets higher effluent standards as established by the Saskatchewan Water Security Agency, in response to the Federal Wastewater Systems Effluent Regulations, in addition to meeting the needs of a growing population. Water Services will continue to operate the wastewater treatment facility for the City of Regina for a total term of 30 years.
Termination of Suncor Financing and Operating Agreements
In February 2015, Suncor gave the Company notice that it would exercise its contractual rights to buy back the leased assets and terminate the related financing and operating agreements including the transfer of assets and operations back to Suncor over an 18-month period. The transfer of assets and operations back to Suncor was completed in August 2016 in accordance with the terms of the notice. This event did not have a material impact on the Company or its operations.
Consolidated financial information
| ($ million) Years ended December 31, | 2016 | 2015 | 2014 |
| Revenues | $ 1,932 | $ 1,996 | $ 1,904 |
| Net income | 309 | 260 | 191 |
| Total assets | 6,161 | 6,088 | 5,738 |
| Loans and borrowings (non-current) | 1,905 | 1,875 | 1,963 |
| Other financial liabilities (non-current) | 37 | 1 | 1 |
| Common share dividends | 141 | 141 | 141 |
Revenues
| (unaudited, $millions) | Three months | Twelve Months |
| Revenues for the periods ended December 31, 2015 | $ 523 | $ 1,996 |
| Lower Water Services segment revenues | (11) | (25) |
| Higher (lower) electricity Distribution and Transmission segment revenues | (20) | 34 |
| Lower Energy Services segment revenues | (21) | (60) |
| Other | 3 | (13) |
| Decrease in revenues from core operations | (49) | (64) |
| Revenues for the periods ended December 31, 2016 | $474 | $1,932 |
Consolidated revenues were lower by $49 million and $64 million for the three and twelve months ended December 31, 2016, respectively, compared with the corresponding periods in 2015 primarily due to the net impact of the following:
- Water Services segment revenues were lower for the three months ended December 31, 2016, compared with the corresponding period in 2015 primarily due to lower construction revenues from the Regina wastewater treatment plant project and lower industrial service contracts revenues, partially offset by higher customer rates and growth, and the EPCOR 130 Pipeline commercial revenue.
Water Services segment revenues were lower for the twelve months ended December 31, 2016, compared with the corresponding period in 2015 primarily due to lower construction revenues from the Regina wastewater treatment plant project and lower water volumes in Canada due to higher precipitation, partially offset by higher customer rates and growth, higher industrial service contracts revenues, foreign exchange translation gains and the EPCOR 130 Pipeline commercial revenue.
- Electricity Distribution and Transmission segment revenues were lower for the three months ended December 31, 2016, compared with the corresponding period in 2015 primarily due to lower system access revenue and the collection of interim to final rate true-ups in 2015 with no corresponding collection in 2016.
Electricity Distribution and Transmission segment revenues were higher for the twelve months ended December 31, 2016, compared with the corresponding period in 2015, primarily due to higher system access revenue and higher electricity customer rates.
- Energy Services segment revenues were lower for the three and twelve months ended December 31, 2016, compared with the corresponding periods in 2015 primarily due to lower electricity prices and lower billing charge rates, partially offset by customer growth. In addition, electricity volumes were lower for the twelve months ended December 31, 2016, compared with the corresponding period in 2015.
Net Income
We use income from core operations to distinguish operating results from the Company's water and electricity businesses from results with respect to its investment in Capital Power and changes in the fair value of financial instruments. In the first quarter of 2016, the definition of income from core operations was revised to exclude changes in the fair value of financial instruments. The change in the fair value of financial instruments is the difference between the opening fair value of the derivative instruments for the period and the closing fair value of the derivative instrument. Income from core operations is a non-IFRS financial measure which does not have any standardized meaning prescribed by IFRS and is unlikely to be comparable to similar measures published by other entities. However, it is presented below as it provides a useful income performance measure of the Company's core operations and may be referred to by debt holders and other interested parties in evaluating the Company's financial performance and in assessing its creditworthiness.
| Three months | Twelve Months | |
| (Unaudited, $ millions) | ||
| Net income for the period ended December 31, 2015 | $ 65 | $ 260 |
| 2015 change in the fair value of contracts-for-difference | 3 | (1) |
| 2015 change in the fair value of interest rate swaps | - | 5 |
| 2015 equity share of income (loss) from Capital Power L.P. (net of income tax expense) | 9 | (5) |
| 2015 dividend income from available-for-sale investment in Capital Power | (4) | (10) |
| 2015 gain on sale of a portion of investment in Capital Power L.P. (net of income tax) | (4) | (23) |
| 2015 gain on reclassification of investment in | ||
| Capital Power L.P. as available-for-sale investment (net of income tax) | (5) | (35) |
| 2015 impairment of available-for-sale investment in Capital Power L.P. | 10 | 60 |
| 2015 income from core operations | 74 | 251 |
| Higher (lower) Water Services segment operating income | (4) | 13 |
| Higher (lower) electricity Distribution and Transmission segment operating income | (13) | 11 |
| Lower Energy Services segment operating income excluding change in the fair value of contracts-for-differences | (9) | (8) |
| Lower (higher) income tax expense | 1 | (4) |
| Lower deferred income tax recovery | (2) | (4) |
| Higher net financing expense | - | (4) |
| Other | 4 | - |
| Increase (decrease) in income from core operations | (23) | 4 |
| 2016 income from core operations | 51 | 255 |
| 2016 change in the fair value of contracts-for-difference | 2 | 7 |
| 2016 change in the fair value of interest rate swaps | 5 | (4) |
| 2016 dividend income from available-for-sale investment in Capital Power | - | 9 |
| 2016 fair value gain on available-for-sale investment in Capital Power reclassified from other comprehensive income | 30 | 42 |
| Net income for the period ended December 31, 2016 | $ 88 | $ 309 |
Changes in each business segment's operating results compared with the corresponding periods in 2015 are described in Segment Results below. Explanations of the remaining variances in net income for the three and twelve months ended December 31, 2016 are as follows:
- Greater favorable changes in the fair value of contracts-for-differences.
- Greater favorable fair value adjustments related to interest rate swaps which were realized upon settlement.
- EPCOR's equity share of income of Capital Power L.P. was lower for the three and twelve months ended December 31, 2016, compared with the corresponding period in 2015. This was due to the Company transitioning from equity accounting to accounting for its investment in Capital Power as an available-for-sale asset following the sale of Capital Power shares in April 2015, when the Company's ownership interest was reduced to below 10%.
- EPCOR's dividend income from the Capital Power shares was lower for the three months ended December 31, 2016, compared with the corresponding period in 2015 due to sell down of shares in the current quarter. EPCOR's dividend income from the Capital Power shares was lower for the twelve months ended December 31, 2016, compared with the corresponding periods in 2015. This was due to sell down of shares in the second half of 2016, partially offset by accounting for the investment in Capital Power as an available-for-sale asset commencing in the second quarter of 2015 as described above and an increase in the dividend rate.
- EPCOR recognized a gain on sale of a portion of its investment in Capital Power L.P. in 2015 with no corresponding transaction in 2016.
- EPCOR recognized a gain on the initial recognition of the investment in Capital Power as an available-for-sale investment with no corresponding gain in 2016.
- EPCOR recognized an impairment charge on the Capital Power shares in 2015 with no corresponding transaction in 2016.
- As a result of the sale of Capital Power shares, the Company reclassified fair value gains of $30 million and $42 million, for the three and twelve months ended December 31, 2016, respectively, from other comprehensive income to net income, with no corresponding reclassification in 2015.
- Income tax expense was lower for the three months ended December 31, 2016, compared with the corresponding period in 2015, primarily due to decreased tax expense in the Water Services segment resulting from decreased income in Canada. Income tax expense was higher for the twelve months ended December 31, 2016, compared with the corresponding period in 2015, primarily due to increased tax expense in the Water Services segment resulting from increased income in the U.S.
- Deferred income tax recovery was lower for the three months ended December 31, 2016, compared with the corresponding periods in 2015, primarily due to a lower projected increase in future taxable income. Deferred income tax recovery was lower for the twelve months ended December 31, 2016, compared with the corresponding period in 2015, primarily due to an increase in future tax rates in 2015 with no corresponding increase for 2016.
- Net financing expense was higher in the twelve months ended December 31, 2016, compared with the corresponding periods in 2015, primarily due to lower capitalized interest, higher foreign exchange on the interest expense for U.S. dollar denominated debt and new private debt notes issued in the year.
Segment results
Water Services
EPCOR's Water business segment's primary objective is to provide safe and reliable water and wastewater services while meeting or exceeding all environmental requirements and delivering value to customers and the shareholder. Water Services operates in Canada and the U.S. The majority of Water Services' income in Canada is earned through a performance based rate tariff charged to its Edmonton customers. The performance based rate (PBR) tariff is intended to allow Water Services the opportunity to recover its costs and earn a fair rate of return while providing an incentive to manage costs below inflation and other prescribed adjustments built into the tariff. In October 2016, EPCOR's Water Services segment received the decision related to its 2017 - 2021 Edmonton water and wastewater PBR application. The decision reduced the return on equity (ROE) from 10.875% to 10.175%. The decision is not expected to have a material impact on the Company's results. Water Services also operates in the U.S. states of Arizona, New Mexico and Texas. Customer rates in Arizona and New Mexico are subject to approval by the Arizona Corporation Commission and the New Mexico Public Regulation Commission respectively. Customer rates are intended to allow EPCOR the opportunity to recover costs and earn a reasonable rate of return under a historical cost-of-service framework.
At December 31, 2016, Water Services owned three and operated 14 other water treatment and / or distribution facilities in Alberta and British Columbia. Additionally, Water Services owned one wastewater treatment facility and operated 18 other wastewater treatment and / or collection facilities in Alberta, British Columbia and Saskatchewan. In Arizona and New Mexico, EPCOR owned operations in 14 water utility districts, each containing one or more water treatment and / or distribution facilities, and six wastewater utility districts, each containing one or more wastewater treatment and / or collection facilities. The EPCOR 130 Pipeline delivers water through a 30 inch pipeline to four municipal customers near Austin, Texas under long-term contracts. While these wholesale water contracts are technically subject to Texas Public Utilities Commission appellate review, they are considered to be effectively unregulated.
Water Services' core market is stable as Water Services is the supplier of water and provider of wastewater services within its various operating districts. Operationally, the facilities owned or managed by Water Services generally performed according to plan in 2016. In the third quarter of 2016, persistent rainfall throughout the North Saskatchewan River watershed significantly impacted the river's water quality. Edmonton and region residents were asked to reduce water consumption for a short period of time. EPCOR was able to maintain the required quality of Edmonton's drinking water throughout the period.
In addition, Water Services provides competitive contract-based water and wastewater services, including financing, in certain arrangements, to municipal and industrial customers. In August 2016, several agreements with Suncor were terminated and all financing arrangements and leases were settled and repaid to the Company.
Work on several significant projects within Edmonton progressed in 2016. These projects include the annual water main renewal program to improve Edmonton's water distribution system, water distribution line relocation as a result of the City's light rail transit expansion, construction of a hydrovac sanitary grit treatment facility at Gold Bar and upgrades to pre-treatment and other infrastructure at the Gold Bar wastewater treatment facility.
Water Services Operating Income
| ($ millions, including intersegment transactions) | Three months ended December 31, | Twelve months ended December 31, | |||
2016 | 2015 | 2016 | 2015 | ||
| Revenues | Water sales | $ 119 | $ 115 | $ 485 | $ 462 |
| Provision of services | 25 | 28 | 114 | 110 | |
| Construction revenues | 14 | 24 | 50 | 102 | |
| Finance lease income | 1 | 3 | 14 | 14 | |
| 159 | 170 | 663 | 688 | ||
| Expenses | Other raw materials | ||||
| and operating charges | 44 | 49 | 159 | 203 | |
| Staff costs and employee benefits expenses | 31 | 36 | 128 | 127 | |
| Depreciation and amortization | 29 | 27 | 91 | 89 | |
| Franchise fees and property taxes | 7 | 8 | 28 | 28 | |
| Other administrative expenses | 9 | 6 | 33 | 32 | |
| 120 | 126 | 439 | 479 | ||
| Operating income before corporate charges | 39 | 44 | 224 | 209 | |
| Corporate charges | 9 | 10 | 30 | 28 | |
| Operating income | $ 30 | $ 34 | $ 194 | $ 181 | |
| Three months ended December 31, | Twelve months ended December 31, | |
| Operating income for the year end ended December 31, 2015 | $34 | $181 |
| Higher approved customer rates and consumption | 5 | 19 |
| Higher (lower) industrial services margin | (7) | 2 |
| Foreign exchange | - | 2 |
| Higher operating costs excluding industrial and municipal services | (4) | (4) |
| Lower municipal services margin | - | (2) |
| Higher depreciation | (2) | (1) |
| Other | 4 | (3) |
| Increase (decrease) in operating income | (4) | 13 |
| Operating income for the year ended December 31, 2016 | $30 | $194 |
Water Services' operating income decreased by $4 million for the three months ended December 31, 2016, compared with the corresponding period in 2015 primarily due to lower income related to industrial services contracts, higher chemical and power costs, and higher depreciation, partially offset by higher approved customer rates and growth.
Water Services' operating income increased by $13 million for the twelve months ended December 31, 2016, compared with the corresponding period in 2015 primarily due to higher approved customer rates and growth, gains on sale of surplus land, higher income related to industrial services contracts and foreign exchange translation gains, partially offset by higher chemical and power costs, lower municipal service margin, lower water volumes in Canada due to higher precipitation and higher depreciation.
| Year ended December 31, | 2016 | 2015 |
| Water volumes (megalitres) | ||
| Water sales for Edmonton and surrounding region | 126,364 | 129,993 |
| Water sales for Arizona, New Mexico and Texas | 85,894 | 79,528 |
Edmonton water sales decreased in 2016 compared with 2015 mainly due to higher precipitation, partially offset by customer growth. Arizona and New Mexico water sales increased in 2016 compared with 2015 primarily due to higher average temperatures and lower precipitation during the summer months. In addition, water sales were higher due to the acquisition of the EPCOR 130 Pipeline which delivers wholesale water to customers in Texas.
Distribution and Transmission
Distribution and Transmission's priority is to be a trusted provider of safe and reliable electricity, known for operational excellence through innovative and practical solutions. Distribution and Transmission earns income principally by transmitting high-voltage electricity through its facilities that form part of the Alberta Interconnected Electrical System to points of distribution, and from there, distributing lower voltage electricity to end-use customers. The transmission services are provided to the Alberta Electric System Operator (AESO). The distribution services are provided to electricity retailers such as Energy Services and other competitive retailers. Distribution and Transmission's assets are located in and around Edmonton and are rate-regulated by the Alberta Utilities Commission (AUC). Transmission charges a rate-regulated tariff intended to allow recovery of prudent costs and earn a fair rate of return on invested capital. Distribution earns income through a performance based rate tariff charged to its customers. The PBR tariff is intended to allow Distribution the opportunity to recover its costs and earn a fair return on capital while providing an incentive to manage costs below inflation and other prescribed adjustments built into the tariff. This segment also provides competitive contract-based commercial services related to installation, maintenance and repair of street lighting, traffic signals and light rail transit, primarily to the City.
The AUC issued its 2016 Generic Cost of Capital decision in October 2016. The AUC directed that the ROE for 2016 remain at 8.3% and increase to 8.5% in 2017 for all Alberta natural gas and electricity distribution and transmission utilities. The AUC also set a deemed equity ratio of 37% for both distribution and transmission utilities targeting the utilities' maintenance of a credit rating in the A category. This decision results in a 3% decrease and a 1% increase in the deemed equity ratios for the EPCOR distribution and transmission utilities, respectively. The various true-ups related to the decision will occur over the next several years. The decision will not have a material impact on the financial results of the Company.
Distribution and Transmission Operating Income
| ($ millions, including, intersegment transactions) | Three months ended December 31, | Twelve months ended December 31, | |||
2016 | 2015 | 2016 | 2015 | ||
| Revenues | Distribution | $ 96 | $ 104 | $ 436 | $ 408 |
| Transmission | 25 | 35 | 97 | 94 | |
| Commercial and other | 26 | 28 | 101 | 98 | |
| 147 | 167 | 634 | 600 | ||
| Expenses | Energy purchases | ||||
| and system access fees | 26 | 38 | 182 | 175 | |
| Other raw materials and operating charges | 14 | 15 | 49 | 48 | |
| Staff costs and employee benefits expenses | 21 | 21 | 85 | 86 | |
| Depreciation and amortization | 24 | 20 | 80 | 69 | |
| Franchise fees and property taxes | 18 | 17 | 71 | 69 | |
| Other administrative expenses | 4 | 3 | 16 | 16 | |
| 107 | 114 | 483 | 463 | ||
| Operating income before corporate charges | 40 | 53 | 151 | 137 | |
| Corporate charges | 7 | 7 | 29 | 26 | |
| Operating income | $ 33 | $ 46 | $ 122 | $ 111 | |
| Three months ended December 31, | Twelve months ended December 31, | |
| Operating income for the year end ended December 31, 2015 | $46 | $111 |
| Higher distribution approved customer rates and net system access collections | 4 | 19 |
| Higher (lower) transmission customer rates | (10) | 3 |
| Higher depreciation expense | (4) | (11) |
| Other | (3) | - |
| Increase (decrease) in operating income | (13) | 11 |
| Operating income for the year ended December 31, 2016 | $33 | $122 |
Distribution and Transmission's operating income decreased by $13 million for the three months ended December 31, 2016, compared with the corresponding period in 2015 primarily due to lower transmission customer rates resulting from an interim to final rate true-up in 2015 and higher depreciation in 2016. This was partially offset by higher distribution approved customer rates and higher net system access collections.
Distribution and Transmission's operating income increased by $11 million for the twelve months ended December 31, 2016, compared with the corresponding period in 2015, primarily due to higher distribution approved customer rates, higher net system access collections and higher transmission customer rates. This was partially offset by higher depreciation.
| Year ended December 31, | 2016 | 2015 |
| Distribution reliability volumes | ||
| Reliability (system average interruption duration index in hours) | 0.92 | 0.91 |
| Electricity distribution (gigawatt-hours) | 7,609 | 7,669 |
Distribution and Transmission's primary measure of distribution system reliability is the System Average Interruption Duration Index (SAIDI), which it focuses on minimizing. This measure captures the annual average number of hours of interruption experienced by Distribution and Transmission's customers, including scheduled and unscheduled interruptions to its primary distribution circuits. In 2016, the SAIDI was 0.92 hours which is comparable to 0.91 in 2015. Distribution and Transmission will continue with its reliability improvement programs to further address controllable factors and help maintain and improve overall system reliability. Electricity distribution volumes in 2016 were relatively flat year over year.
Energy Services
The Energy Services' business focuses on providing cost effective retail electricity service and efficient customer care through a highly skilled, knowledgeable, caring and engaged customer service team. Energy Services earns income from selling electricity to customers under a regulated rate tariff (RRT) and default rate (customers with higher electricity volumes that are not under a competitive contract) in the EPCOR Distribution and Transmission Inc. and FortisAlberta Inc. service areas and several Rural Electrification Association service territories. The RRT is intended to allow Energy Services to recover its prudent costs and earn a return margin. Customers under the RRT are residential, farm and small commercial customers who are not under a competitive contract and receive their electricity under the RRO. Energy Services also provides billing, collection, and contact center services to other EPCOR operations and the City Waste and Drainage Services departments. Energy Services focuses on providing excellent service experiences for its customers and measures call answer performance, billing performance, and customer satisfaction. These results are reported to the AUC on a quarterly basis.
Energy Services' allowed electricity revenue is determined in accordance with an energy price setting plan (EPSP) approved by the AUC. Under the EPSP, Energy Services manages its exposure to customer load and fluctuating wholesale electricity spot prices by entering into financial electricity purchase contracts up to 120 days in advance of the month of consumption under a well-defined risk management process. Energy Services received approval of their 2016 - 2018 EPSP in the first quarter of 2016 and the Company implemented the new plan in the third quarter of 2016. The plan will adapt more quickly to changes in wholesale market conditions thereby reducing EPCOR's risk with commensurately lower risk compensation. Energy Services filed the next iteration of the EPSP applicable for 2018 - 2021 in January 2017.
In May 2014, Energy Services entered the competitive retail market by offering electricity and natural gas contracts to Alberta consumers under the Encor brand in order to mitigate the impact of RRO customer attrition. The expanded service offering, including green energy options, provides customers wishing to move from the RRO to a competitive contract with an EPCOR offering.
Energy Services Operating Income
| ($ millions, including, intersegment transactions) | Three months ended December 31, | Twelve months ended December 31, | |||
2016 | 2015 | 2016 | 2015 | ||
| Revenues | Electricity sales | $ 200 | $ 221 | $ 782 | $ 844 |
| Provision of services | 12 | 12 | 41 | 39 | |
| 212 | 233 | 823 | 883 | ||
| Expenses | Energy purchases | ||||
| and system access fees | 184 | 204 | 707 | 770 | |
| Staff costs and employee benefits expenses | 7 | 7 | 28 | 27 | |
| Depreciation and amortization | 1 | 1 | 6 | 6 | |
| Other administrative expenses | 8 | 6 | 27 | 24 | |
| 200 | 218 | 768 | 827 | ||
| Operating income before corporate charges | 12 | 15 | 55 | 56 | |
| Corporate charges | 3 | 2 | 10 | 9 | |
| Operating income | 9 | 13 | 45 | 47 | |
| Exclude change in the fair value of contracts-for-difference | (2) | 3 | (7) | (1) | |
| Operating income excluding change in the fair value of contracts-for-difference | $ 7 | $ 16 | $ 38 | $ 46 | |
| Three months ended December 31, | Twelve months ended December 31, | |
| Operating income excluding change in the fair value of contracts-for-difference for the year end ended December 31, 2015 | $16 | $46 |
| Higher (lower) EPSP margins | (1) | 8 |
| Lower billing charge rates | (6) | (15) |
| Other | (2) | (1) |
| Decrease in operating income | (9) | (8) |
| Operating income excluding change in the fair value of contracts-for-difference for the year end ended December 31, 2016 | $7 | $38 |
Energy Services' operating income, excluding change in the fair value of contracts-for-differences, decreased by $9 million for the three months ended December 31, 2016, compared with the corresponding period in 2015 primarily due to lower billing charge rates and lower EPSP margins.
Energy Services' operating income excluding change in the fair value of contracts-for-differences decreased by $8 million for the twelve months ended December 31, 2016, compared with the corresponding period in 2015 primarily due lower billing charge rates, partially offset by higher EPSP margins and growth in competitive business.
Energy Services' retail sales volumes were as follows:
| Year ended December 31, | 2016 | 2015 | |
| Electricity (gigawatt hours) | |||
| RRT | 4,919 | 4,947 | |
| Default and competitive supply | 772 | 761 | |
| Total Electricity | 5,691 | 5,708 | |
Energy Services' RRT sales volume decreased in 2016 compared with 2015 primarily due to a decrease in the average consumption per site. The increased default and competitive supply sales volume was primarily due to an increase in the number of competitive supply sites served, partially offset by a decrease in the number of default sites served.
Capital Spending and Investment
| ($ million) Years ended December 31, | 2016 | 2015 | 2014 |
| Water Services segment | 206 | 214 | 175 |
| Electricity Distribution and Transmission segment | 281 | 235 | 200 |
| Energy Services segment | 4 | 1 | 2 |
| Corporate segment | 11 | 13 | 8 |
| 502 | 463 | 385 | |
| Business acquisition | 51 | - | - |
| Total capital spending and investment | $ 553 | $463 | $385 |
In 2016, we continued to invest in our infrastructure assets to improve reliability and meet increasing electricity and treated water and wastewater demands. Total capital spending and investment was higher in 2016 compared with 2015 primarily due to the acquisition of the assets of Blue Water and CCWSC, increased spending in the Distribution and Transmission segment on the installation of advance meter infrastructure for customers in Edmonton and renovations to its major work centre, and increased spending in the Water Services segment on lifecycle projects. This was partially offset by decreased spending in the Distribution and Transmission segment on growth projects and decreased spending in the Water Services segment primarily due to the completion of construction of the new laboratory and office building at the Rossdale location in 2015 as well as decreased spending at Gold Bar and at the Walker and Big Lake booster stations in Edmonton.
Consolidated Statements of Financial Position - assets
| ($ millions) | December 31, 2016 | December 31, 2015 | Increase (decrease) | Explanation of material changes | |
| Cash and cash equivalents | $ 191 | $ 36 | $ 155 | Refer to Consolidated Statements of Cash Flows section. | |
| Trade and other receivables | 325 | 620 | (295) | Decrease primarily due to payment of the current portion of the Capital Power receivable related to the back-to-back debt, the Suncor receivable payment, the Regina milestone and substantial completion payments and lower electricity billings and accruals resulting from lower electricity price and volumes, partially offset by an increase in the current portion of the Regina long-term receivable (see below). | |
| Available-for-sale investment in Capital Power | 6 | 167 | (161) | Decrease due to sale of a substantial portion of the Capital Power shares, partially offset by fair value adjustments. The investment has been reclassified from non-current to current. | |
| Inventories | 14 | 15 | (1) | ||
| Other financial assets | 265 | 317 | (52) | Decrease primarily due to portions of the Regina long-term receivable reclassified to trade and other receivables and receipt of the Chestermere long-term receivable payment, net of construction financing. | |
| Deferred tax assets | 84 | 77 | 7 | Increase due to recognition of tax loss carry forward balances. | |
| Property, plant and equipment | 4,983 | 4,568 | 415 | Increase primarily due to capital expenditures and the acquisition of the assets of Blue Water and CCWSC, partially offset by depreciation, unfavorable foreign currency valuation adjustments, sales of surplus land, and asset retirements. | |
| Intangible assets and goodwill | 293 | 288 | 5 | Increase primarily due to the acquisition of the assets of Blue Water and CCWSC and capital expenditures, partially offset by amortization of assets with finite lives and unfavorable foreign currency valuation adjustments. | |
| Consolidated Statements of Financial Position - liabilities and equity | |||||
| ($ millions) | December 31, 2016 | December 31, 2015 | Increase (decrease) | Explanation of material changes | |
| Trade and other payables | 299 | 259 | 40 | Increase primarily due to higher capital accruals and higher gas purchases and other payables, partially offset by lower electricity accruals resulting from lower electricity volumes. | |
| Loans and borrowings (including current portion) | 1,920 | 2,117 | (197) | Decrease primarily due to repayment of short-term and long-term debt, including the Capital Power back-to-back debt, and favorable foreign currency valuation adjustments on U.S. dollar denominated debt, partially offset by proceeds from long-term debt issuance. | |
| Deferred revenue (including current portion) | 1,041 | 991 | 50 | Increase primarily due to contributions received and transfer of non-refundable contributions from customers and developers from provisions (see below), partially offset by deferred revenue recognized and favorable foreign currency valuation adjustments. | |
| Provisions (including current portion) | 111 | 121 | (10) | Decrease primarily due to payout of employee benefits, transfer of non-refundable contributions from customers and developers to deferred revenue (see above) and favorable foreign currency valuation adjustments, partially offset by employee benefits accrual and net receipts of contributions. | |
| Derivative liabilities (including current portion) | - | 12 | (12) | Decrease primarily due to settlement of interest rate swap. | |
| Other liabilities (including current portion) | 72 | 38 | 34 | Increase primarily due to the contingent consideration recorded on the acquisition of the Blue Water and CCWSC assets. | |
| Deferred tax liabilities | 46 | 35 | 11 | Increase primarily due to tax depreciation in excess of accounting depreciation. | |
| Equity attributable to the Owner of the Company | 2,672 | 2,515 | 157 | Increase due to increase in comprehensive income partially offset by dividends paid. | |
| Consolidated statements of cash flows | |||||
| ($ millions) Cash inflows (outflows) | |||||
| Three months ended December 31, | 2016 | 2015 | Increase (decrease) | Explanation | |
| Operating | $ 109 | $ 112 | $ (3) | Decrease reflects lower funds from operations as a result of reduced income from core operations, offset by changes in non-cash operating working capital resulting primarily from an increase in accounts payables. | |
| Investing | 24 | (154) | 178 | Increase primarily due to proceeds from the partial sale of the Capital Power shares and payments received on other financial assets including Chestermere and the Regina substantial completion payment, partially offset by higher capital expenditures and lower proceeds from disposal of assets. | |
| Financing | (27) | 44 | (71) | Decrease primarily due to higher issuance of short-term loans and borrowings in 2015, partially offset by higher receipt of contributions from developers and customers. | |
| Opening cash and cash equivalents | 85 | 34 | 51 | ||
| Closing cash and cash equivalents | $ 191 | $ 36 | $ 155 | ||
| ($ millions) Cash inflows (outflows) | |||||
| Twelve months ended December 31, | 2016 | 2015 | Increase (decrease) | Explanation | |
| Operating | $ 475 | $ 416 | $ 59 | Increase primarily reflects higher funds from changes in non-cash operating working capital, partially offset by lower funds from operations. The higher funds from non-cash operating working capital resulted from a decrease in trade and other receivables and a higher increase in accounts payable. The lower funds from operations are primarily a result of higher interest paid and lower contributions received. | |
| Investing | 1 | (257) | 258 | Increase primarily due to higher payments received on other financial assets including the payment received from Capital Power related to the back-to-back debt, the Suncor lease receivable payment, the Chestermere payment, and the Regina milestone and substantial completion payments, partially offset by lower proceeds on the partial sale of Capital Power shares, the acquisitions of the Blue Water and CCWSC assets, and higher capital expenditures. | |
| Financing | (321) | (160) | (161) | Decrease primarily due to higher repayments of long-term and short-term loans and borrowings, net of proceeds from debt issuance and higher receipt of contributions from developers and customers. | |
| Opening cash and cash equivalents | 36 | 37 | (1) | ||
| Closing cash and cash equivalents | $ 191 | $ 36 | $ 155 | ||
Operating Activities and Liquidity
The Company maintains its financial position through rate-regulated utility and contracted operations which generate stable cash flows.
The Company expects to have sufficient liquidity to finance its plans and fund its obligations in 2017 with a combination of cash on hand, cash flow from operating activities, interest and principal payments related to long-term loans receivable from Capital Power, the issuance of commercial paper, public or private debt offerings and draws upon existing credit facilities described below under Financing. Cash flows from operating activities would be impaired by events that cause severe damage to our facilities and would require unplanned cash outlays for system restoration repairs. Under those circumstances, more reliance would be placed on our credit facilities for working capital requirements until a regulatory approved recovery mechanism or insurance proceeds were in place.
Capital Requirements and Contractual Obligations
EPCOR's projected capital requirements for 2017 include $500 million to $650 million for investment in existing businesses and new business development.
The following table represents the Company's contractual obligations by year:
| ($ millions) | 2017 | 2018 | 2019 | 2020 | 2021 | 2022 and thereafter | Total |
| Distribution and Transmission segment projects1 | $ 24 | $ 40 | $ 13 | $ 7 | $ 7 | $ - | $ 91 |
| Water Services segment projects2 | 13 | - | - | - | - | - | 13 |
| Water Services power contracts3 | 9 | 6 | 3 | 3 | 3 | - | 24 |
| Water purchase and transportation of water agreements4 | 9 | 2 | - | - | - | 4 | 15 |
| Billing and customer care services agreement5 | 4 | 4 | 4 | 3 | 3 | - | 18 |
| Loans and borrowings net of sinking fund payments received6 | 10 | 409 | 7 | 7 | 193 | 1,297 | 1,923 |
| Interest payments on loans and borrowings | 112 | 100 | 80 | 79 | 79 | 1,141 | 1,591 |
| Operating leases, net7 | 10 | 10 | 9 | 8 | 7 | 77 | 121 |
| Total contractual obligations | $ 191 | $ 571 | $ 116 | $ 107 | $ 292 | $ 2,519 | $ 3,796 |
- The Company has commitments for several Distribution and Transmission projects as directed by the AESO.
- The Company has commitments for several Water Services projects in Canada through contract agreements.
- The Company has commitments to purchase power for its Edmonton wastewater treatment plant, water treatment plants and distribution sites. The agreements expire on or before December 31, 2021. Under the terms of the agreement, the Company is committed to purchase minimum contracted quantities at a fixed price. There are no early termination or cancellation clauses in this agreement.
- Water Arizona maintains agreements with the Central Arizona Water Conservation District for the purchase and transportation of water. These agreements are for terms of 100 years expiring at the end of 2107. Under the terms of these agreements, the Company is committed for the amount of water ordered in the fall of each year to be purchased and transported the following year.
Water New Mexico maintains agreements with the various well owners for the purchase of water. These agreements are generally for terms of ten years. Under the terms of these agreements, certain minimum purchases are due each year in order to maintain the agreements until they expire. - The Company has entered into an agreement for billing and customer care services for Water Arizona and Water New Mexico. The contract term is for ten years, expiring on August 31, 2021.
- A portion of the $409 million repayment in 2018 will be funded by collection of $174 million on the long-term loans receivable from Capital Power.
- In 2007, the Company entered into a long-term agreement to lease commercial space in a new office tower in Edmonton, Canada, primarily for its head office (head office lease). The agreement, which became effective in the fourth quarter of 2011, has an initial lease term of approximately 20 years, expiring on December 31, 2031, and provides for three successive five-year renewal options.
Under the terms of the lease, the Company's annual lease commitments, net of annual payments to be paid to the Company by Capital Power and another company under the sub-leases receivable are as follows:
| Minimum lease | |
| ($ millions) | payable |
| January 1, 2017 through December 31, 2022 | $ 6 |
| January 1, 2023 through December 31, 2023 | 7 |
| January 1, 2024 through December 31, 2031 | 8 |
All of the Company's operating lease obligations for premises, net of subleases receivable, are included in the contractual obligations table above.
If Drainage is transferred to EPCOR under the current proposal, as described in more detail in the Outlook section, EPCOR will assume assets and liabilities of approximately $3.3 billion and $0.7 billion, respectively. As well, EPCOR has proposed an increase in the dividend of $20 million subject to Board and Shareholder approval. For the first year of operations, capital spending is expected to be approximately $120 million to $200 million.
As a result of the acquisition of the Blue Water and CCWSC assets, the Company is committed to pay Blue Water a fee which is contingent on securing new long term contracts for the supply of water. This fee is capped at US$32 million with no time limit for payment of the fee. The Company is reasonably certain that it will be required to settle this commitment by way of cash payment and has accordingly recognized the liability for contingent consideration in the consolidated statement of financial position.
During the year, the Company terminated the long term "pay fixed, receive floating" interest rate swap, related to Regina, by settlement of the outstanding liability of $14 million to the counterparty. Subsequent to the year ended December 31, 2016, the remaining short term interest rate swap was also settled.
As at March 3, 2016, there were three common shares of the Company outstanding, all of which are owned by the City. In 2016, the annual dividend was set at $141 million (2015 - $141 million). As a result of EPCOR's consistent and sustainable performance, EPCOR's Board of Directors proposed to EPCOR's shareholder that the EPCOR annual dividend paid to the City be increased by $5 million to $146 million commencing in 2017. EPCOR's Shareholder approved this recommendation, and in accordance with the EPCOR Dividend Policy, this amount will remain in effect until such time as the EPCOR Board recommends that it be changed.
In the normal course of business, EPCOR provides financial support and performance assurances, including guarantees, letters of credit and surety bonds, to third parties in respect of its subsidiaries.
Financing
Generally, our external capital is raised at the corporate level and invested in the operating business units. Our external financing has consisted of commercial paper issuance, borrowings under committed syndicated bank credit facilities, debentures payable to the City, publicly issued medium-term notes, U.S. private debt notes and issuance of preferred shares.
In the third quarter of 2016, the Company issued US$40 million private debt notes to fund the acquisition of the Blue Water and CCWSC assets. The U.S. dollar denominated private debt notes were issued with a term-to-maturity of 25 years and three months and an interest rate of 3.63% per annum.
The Company has bank credit facilities, which are used principally for the purpose of backing the Company's commercial paper program and providing letters of credit, as outlined below:
| ($ millions) December 31, 2016 | Expiry | Total facilities | Banking commercial paper issued | Letters of credit and other facility draws | Net amounts available |
| Committed | |||||
| Syndicated bank credit facility1 | November 2019 | $ 200 | $ - | $ 73 | $ 127 |
| Syndicated bank credit facility | November 2020 | 350 | - | - | 350 |
| Total committed | 550 | - | 73 | 477 | |
| Uncommitted | |||||
| Bank line of credit | No expiry | 25 | - | - | 25 |
| Total credit facilities | $ 575 | $ - | $ 73 | $ 502 | |
| ($ millions) December 31, 2015 | Expiry | Total facilities | Banking commercial paper issued | Letters of credit and other facility draws | Net amounts available |
| Committed | |||||
| Syndicated bank credit facility1 | November 2018 | $ 200 | $ - | $ 48 | $ 152 |
| Syndicated bank credit facility | November 2020 | 350 | 98 | - | 252 |
| Total committed | 550 | 98 | 48 | 404 | |
| Uncommitted | |||||
| Bank line of credit | No expiry | 25 | - | - | 25 |
| Total credit facilities | $ 575 | $ 98 | $ 48 | $ 429 |
- Restricted to letters of credit.
Letters of credit are issued to meet the credit requirements of energy market participants and conditions of certain service agreements. Letters of credit totaling $73 million (2015 - $48 million) were issued and outstanding at December 31, 2016.
The committed syndicated bank credit facilities cannot be withdrawn by the lenders until expiry, provided that the Company operates within the related terms and covenants. The extension feature of EPCOR's committed syndicated bank credit facilities gives the Company the option each year to re-price and extend the terms of the facilities by one or more years subject to agreement with the lending syndicate. The Company regularly monitors market conditions and may elect to enter into negotiations to extend the maturity dates. In November 2016, the $200 million committed syndicated bank credit facility was extended by one year to November 2019. At this time, the covenants attached to both credit facilities were renegotiated.
The Company has a Canadian base shelf prospectus under which it may raise up to $1 billion of debt with maturities of not less than one year. At December 31, 2016, the available amount remaining under this base shelf prospectus was $1 billion (December 31, 2015 - $1 billion). The base shelf prospectus expires in December 2017.
No commercial paper was issued and outstanding at December 31, 2016 (December 31, 2015 - $98 million).
If the economy were to deteriorate in the longer term, particularly in Canada and the U.S., the Company's ability to extend the maturity or revise the terms of bank credit facilities, arrange long-term financing for its capital expenditure programs and acquisitions, or refinance outstanding indebtedness when it matures could be adversely impacted. We believe that these circumstances have a low probability of occurring. We continually monitor our capital programs and operating costs to minimize the risk that the Company becomes short of cash or unable to honor its debt servicing obligations. If required, the Company would look to reduce capital expenditures and operating costs.
Credit Ratings
| Years ended December 31, | 2016 | 2015 | 2014 | |
| Credit ratings | ||||
| Standard & Poor's Rating Services: | ||||
| Long-term debt | A- | A- | A- | |
| DBRS Limited: | ||||
| Short-term debt | R-1 (low) | R-1 (low) | R-1 (low) | |
| Long-term debt | A (low) | A (low) | A (low) | |
In August 2016, DBRS confirmed its A (low) / stable senior unsecured debt and R-1 (low) / stable short-term debt ratings for EPCOR and Standard & Poor's Ratings Services confirmed its A- / stable long-term corporate credit and senior unsecured debt ratings for EPCOR.
These credit ratings reflect the Company's ability to meet its financial obligations given the stable cash flows generated from the rate-regulated water and electricity businesses. The Company's continued sell-down of its interest in Capital Power in addition to the initial sale of the power generation assets in 2009 served to improve certain creditworthiness measures. The Company will continue to be indirectly exposed to power generation related risks primarily through its remaining long-term loans receivable from Capital Power until they are entirely repaid to EPCOR in 2018. Once the long-term loans receivable are repaid, the Company's creditworthiness is expected to improve even further. Improvement in the Company's creditworthiness may not result in further credit rating upgrades. A credit rating downgrade for EPCOR could result in higher interest costs on new borrowings and reduce the availability of sources and tenor of investment capital.
Financial Covenants
EPCOR is currently in compliance with all of its financial covenants in relation to its syndicated bank credit facilities, Canadian public medium-term notes and U.S. private debt notes. Based on current financial covenant calculations, the Company has sufficient borrowing capacity to fund current and long-term requirements. Although the risk is low, breaching these covenants could potentially result in a revocation of EPCOR's credit facilities causing a significant loss of access to liquidity or result in the Company's publicly issued medium-term notes and private debt notes becoming immediately due and payable causing the Company to find a means of funding which could include the sale of assets.
The key financial covenants and their thresholds, as defined in the respective agreements, and EPCOR's actual measures at December 31, 2016 and December 31, 2015 were as follows:
Actual 2016 | Financial Covenant 2016 | Actual 2015 | Financial Covenant 2015 | ||||
| Modified consolidated net tangible assets to consolidated net tangible assets1 | 100% | > or = 80% | 100% | > or = 85% | |||
| Consolidated senior debt to consolidated capitalization ratio2 | 42% | < or = 75% | 45% | < or = 70% | |||
| Interest coverage ratio3 | 5.35 | > or = 1.75:1.00 | 6.21 | > or = 1.75:1.00 | |||
| Debt issued by subsidiaries to consolidated net tangible assets4 | 0% | < or = 12.5% | 0% | < or = 12.5% |
- Modified consolidated net tangible assets to consolidated net tangible assets refers to the total assets of the material subsidiaries of the Company on a consolidated basis, less intangible assets, the Capital Power investment adjusted for cash distributions, and the back-to-back debt expressed as a percentage of the total assets of the Company on a consolidated basis, less intangible assets, the Capital Power investment adjusted for cash distributions and the back-to-back debt.
- Consolidated senior debt to consolidated capitalization refers the Company's total unsubordinated long-term debt expressed as a percentage of total unsubordinated long-term debt plus and shareholder's equity. This excludes subordinated debt which has a lower ranking for repayment.
- Interest coverage ratio refers to the Company's ability to pay the interest that arises on outstanding debt. It is calculated by dividing the Company's operating income before interest income and depreciation and amortization expense plus cash distributions and dividends received from Capital Power by the Company's interest expense on loans and borrowings less interest income. The interest coverage ratio is not applicable if the Company has an investment grade credit rating.
- Limitation of debt issued by subsidiaries refers to the total debt held by the Company's subsidiaries that is not guaranteed by the Company plus total debt held by material subsidiaries which is secured by the subsidiaries' assets, expressed as a percentage of the Company's total assets less any intangible assets.
Outlook
In 2017, we will continue to focus on growth in rate-regulated water and electricity infrastructure. We expect this investment to come from new infrastructure to accommodate customer growth and lifecycle replacement of existing infrastructure primarily related to the Edmonton and U.S. based operations. EPCOR intends to expand our water and electricity commercial services activities and to invest in the area of renewable energy generation, including solar and bio gas facilities to enhance our environmental performance.
Demand for water is expected to continue to increase and we anticipate escalating requirements for better water management practices including watershed management and conservation. We will pursue expansion of our portfolio of commercial water contracts.
In January 2017, Edmonton City Council asked its administration to prepare a Letter of Intent (LOI) for the potential transfer of its Drainage Utility Services (Drainage) to EPCOR. The LOI is intended to outline the terms of a possible transfer, and is to include assurances from EPCOR on matters such as transparency into operations, public consultation, audit rights and the requirement for a public hearing should a divestiture occur in the future. It will be brought back to Council in April 2017 for further consideration. EPCOR currently operates three of the four components of the City's water utility cycle - water treatment, water distribution and wastewater treatment. The City's Drainage department operates the fourth component of the water system, the wastewater and storm water collection system.
In November 2016, the Alberta government released several announcements impacting the electricity industry including the details of its Climate Change Plan. Among other things, these announcements included a cap on the RRO, a ban on door-to-door sales, and a shift to a capacity market framework from the existing energy-only market regime. These initiatives may lower the risk of RRO customer attrition in the long term. EPCOR's preliminary view is that these changes will not have a material impact. Energy Services will continue to evaluate these changes and determine any further course of action after consultations with the government and the AUC.
Also in November 2016, the Company entered into a definitive asset purchase agreement to acquire substantially all of the assets of Natural Resource Gas Limited (NRGL) for consideration of $21 million, subject to certain adjustments. NRGL is a natural gas distributor in southwestern Ontario near London, providing services to approximately 8,000 residential, commercial and industrial customers in the counties of Elgin, Middlesex, Oxford and Norfolk. The arrangement requires regulatory approval from the Ontario Energy Board, for which an application has been filed. The Company expects to complete the transaction by mid-2017.
EPCOR has been awarded franchises by three municipalities in the Southern Bruce region of Ontario near Kincardine to build and operate a natural gas distribution system. In March 2016, EPCOR applied to the Ontario Energy Board (OEB) for the approval of these franchise agreements. In January 2017 the OEB requested indications of interest from any parties interested in servicing these areas. A single company did indicate an interest and the OEB is now developing a process for hearing competing applications.
Risk factors and risk management
Approach to risk management
To view an image associated with this release, please visit the following link: http://media3.marketwire.com/docs/1087660_image.jpg
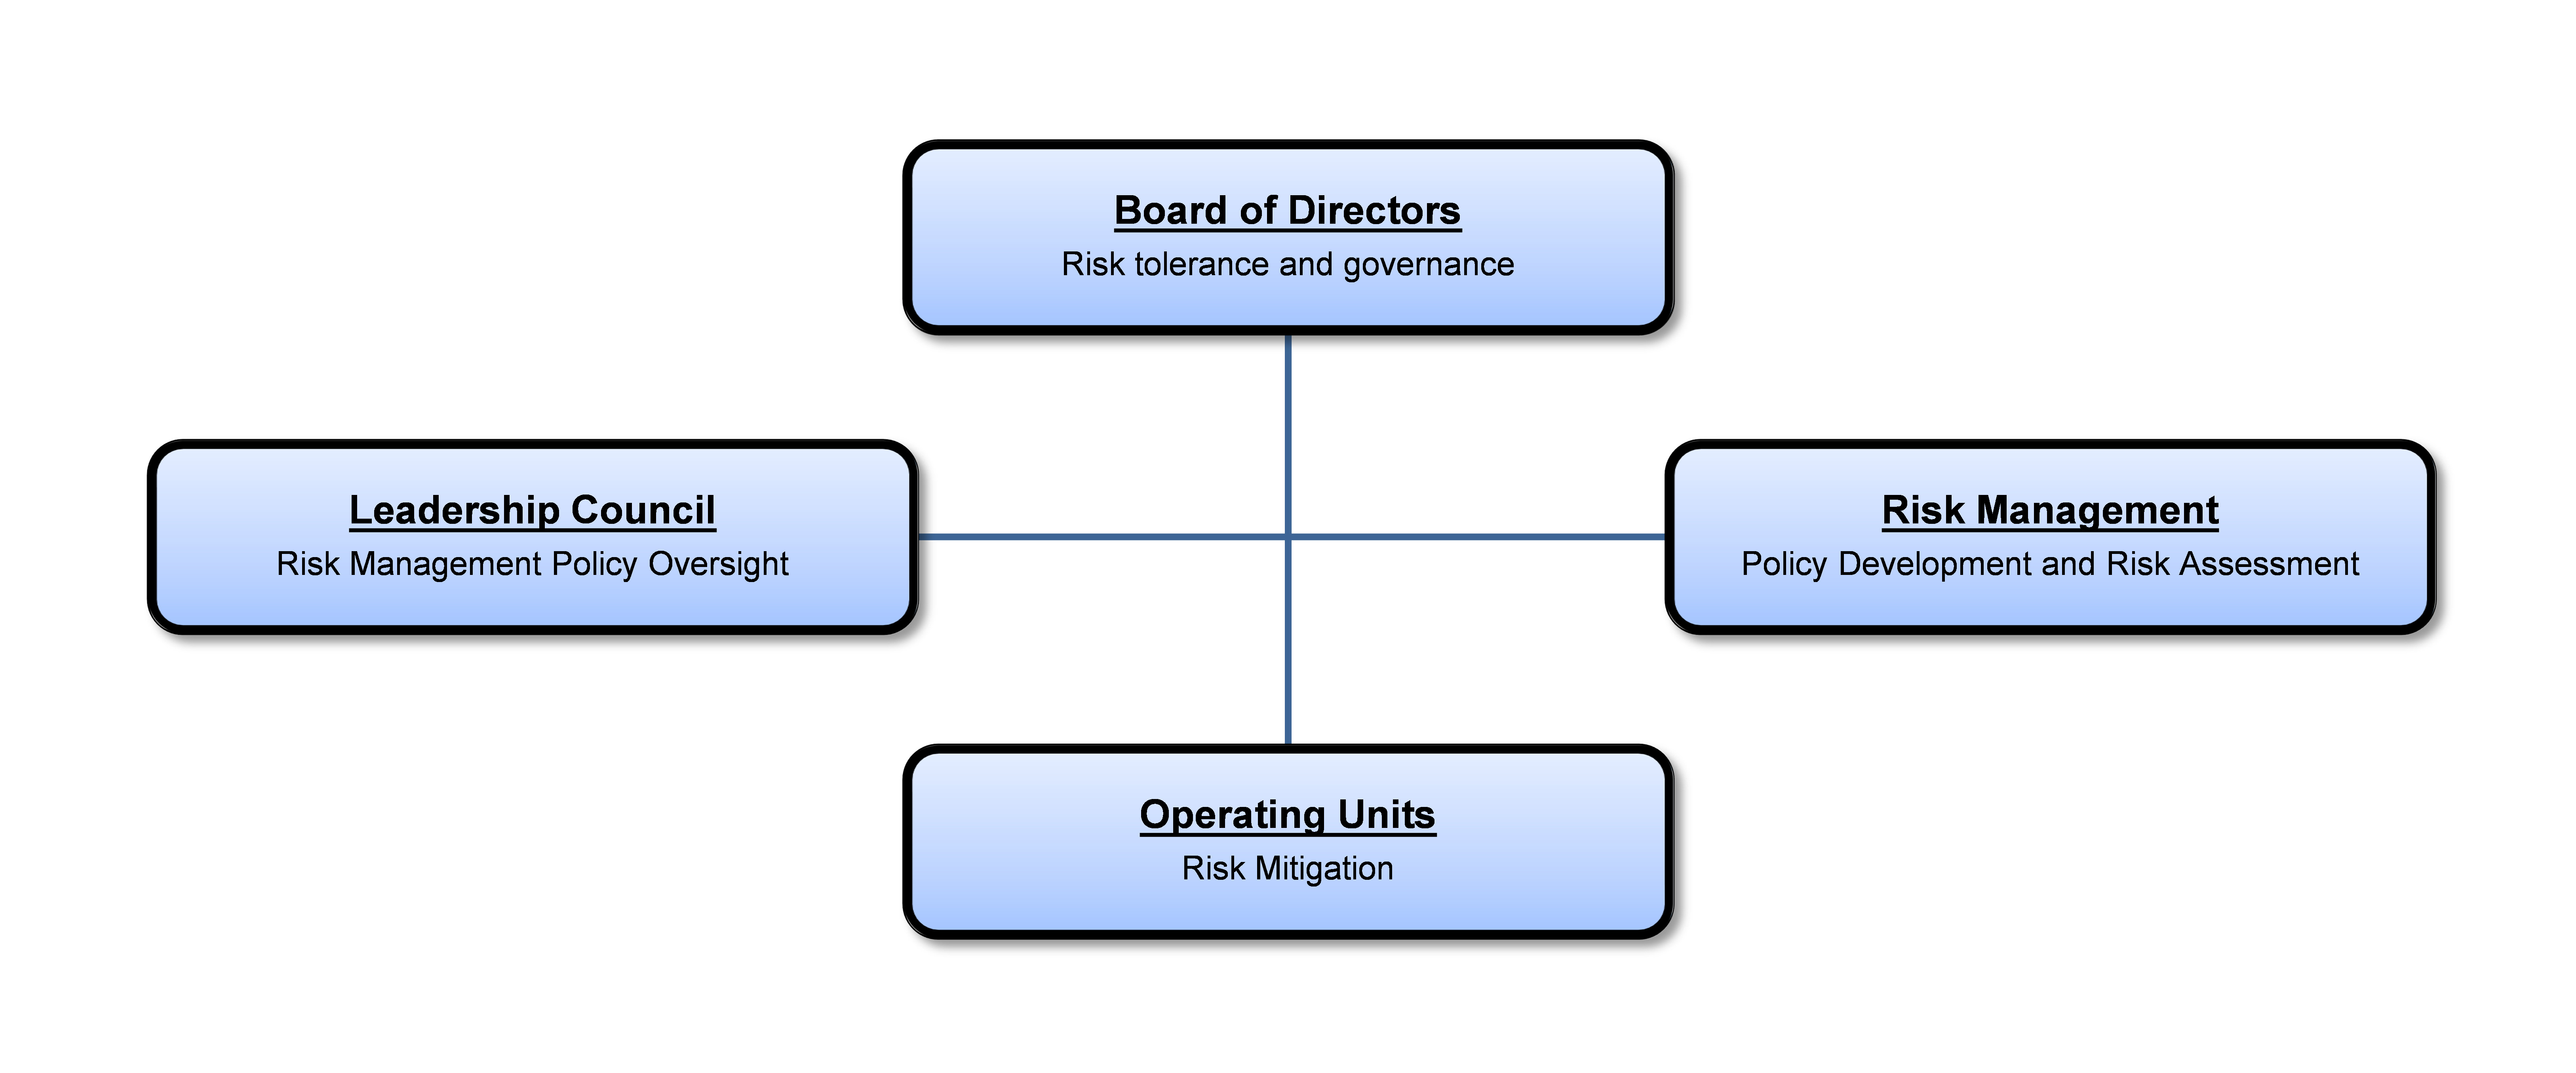
Our approach to Enterprise Risk Management (ERM) is to manage the key controllable risks facing the Company and consider appropriate actions to respond to uncontrollable risks. ERM includes the controls and procedures implemented to reduce controllable risks to acceptable levels and the identification of the appropriate management actions in the case of events occurring outside of management's control. Acceptable levels of risk and risk appetite for EPCOR are established by the Board of Directors, representing the shareholder, and are embodied in the decisions and corporate policies associated with risk management. EPCOR's framework for ERM is aligned with the Committee of Sponsoring Organizations 2004 Integrated ERM Framework and the ERM process follows CAN / CSA ISO 31000-10 Risk Management - Principles and Guidelines. EPCOR's ERM program and the risk management framework and process it supports is designed to identify, assess, measure, manage, mitigate and report on EPCOR's significant risks. The goal is to create and sustain business value by helping the Company reach its business objectives and strategies through better management of risk. The program promotes a common framework and language for managing risk across EPCOR. General ERM framework oversight, reviews and recommendations of risk compliance are provided by management and are based upon the objectives, targets and policies approved by the Board of Directors.
The Corporate Treasurer is responsible for developing the framework and assessing risk at an enterprise level and in conjunction with the Company's internal audit function, monitoring compliance with risk management policies. The Corporate Treasurer provides the Board of Directors with an enterprise risk assessment quarterly. The business units and shared service units are responsible for carrying out the risk management and mitigation activities associated with the risks in their respective operations. These risk management activities are integral aspects of the business units' and shared service units' operations. EPCOR believes that risk management is a key component of the Company's culture and we have put into place cost-effective risk management practices. At the same time, EPCOR views risk management as an ongoing process and we continually review our risks and look for ways to enhance our risk management processes.
Large scale emergencies resulting from various events discussed below may have a significant impact on the Company's ability to provide services that are considered essential services to the public. Maintaining essential services is critical to EPCOR's customers and EPCOR's reputation. The Company manages its ability to continually deliver services with emergency response protocols and business continuity plans which are periodically tested through various exercises and scenarios. These procedures provide assurance that the Company has the coordination, capacity and competence to respond appropriately to emergency situations arising from various forms of risk.
The Company's Ethics Policy includes procedures which provide for confidential disclosure of any wrong-doing relating to accounting, reporting and auditing matters. The policy prohibits any retaliation against any person making a complaint. During 2016, no significant substantiated complaints with respect to accounting, financial reporting and auditing matters were received under the Ethics Policy.
Strategy Execution Risk
Our growth strategy is dependent on the development, acquisition and operation of linear infrastructure for municipal, commercial and industrial customers in Canada and the U.S. Opportunities in Canada may be impacted by depressed oil prices and the weak Canadian economy for the foreseeable future. This could slow or delay the Company's growth plans.
Such growth is dependent on opportunities in the marketplace which will be impacted by the willingness of parties to sell such assets, political and public sentiment regarding third party ownership and EPCOR's cost competitiveness. These risks could result in delays or curtailment of EPCOR's growth plans.
Business development projects, including acquisitions, can take a relatively long period of time to execute, exposing such projects to event and external factor risks that may emerge and thereby alter project economics or completion.
For each new business development project, EPCOR seeks to ensure project success by addressing project risks, including events and external factors, as part of its due diligence process and project execution.
Political and Legislative Risk
EPCOR is subject to risks associated with changing political conditions and changes in federal, provincial, state, local or common law, regulations and permitting requirements in Canada and the U.S. It is not always possible to predict changes in laws or regulations that could impact the Company's operations, income tax status or ability to renew permits as required.
In December 2016, the Government of Alberta enacted Bill 21: the Modernized Municipal Government Act which could impose restrictions on the ability of a municipally controlled corporation (MCC) to conduct its business. EPCOR, which is a MCC of the City of Edmonton, was previously exempted from the MGA and a similar exemption is not present in the new MGA. EPCOR is working to ensure the previous exemption is re-instated as the related regulations are developed. The risk could materially impact EPCOR's ability to execute on its Long Term Plan.
Regulatory Risk
EPCOR is subject to risks associated with the rate regulation of the majority of its operations. Such processes can result in significant lags between the time when customer rates or tariffs are applied for and the time that regulatory decisions are received. Furthermore, the regulator may deny or alter the applied for customer rates or tariffs.
EPCOR's water treatment and distribution services to customers within Edmonton are rate regulated by Edmonton City Council pursuant to the 2012 - 2016 PBR Bylaw. In October 2016, EPCOR's Water Services segment received the decision related to its 2017 - 2021 Edmonton water and wastewater performance-based rate application for the five year period commencing April 1, 2017. The renewal also incorporated the costs associated with the provision of wastewater treatment services supplied from the Gold Bar wastewater treatment plant. Our ability to fully recover operating and capital costs and to earn a fair return is dependent upon achieving the performance targets prescribed in the bylaw, maintaining cost increases below inflation, managing operational risks and not exceeding approved capital additions. Rates for water sales to regional water commissions surrounding Edmonton are regulated by the AUC on a complaints-only basis. EPCOR sets the rates it charges to the regional water commissions to recover actual operating and capital costs including a fair rate of return.
Water and wastewater services provided by EPCOR's U.S. subsidiaries are subject to state laws and regulation by the state regulatory commissions within Arizona, New Mexico and Texas. Our ability to fully recover operating and capital costs and earn a fair return is dependent upon achieving our capital and operating cost targets built into the rates, and meeting the customer growth and water usage targets built into the rates. Since rates are established on a historical cost basis, any new capital additions for water or wastewater infrastructure must be carefully planned and evaluated before commencement since the addition of such costs to the regulatory rate base for subsequent recovery will only take place after the new infrastructure is built and the regulator approves the rate base additions through the rate application process.
The AUC utilizes a PBR structure for electricity and natural gas distribution utilities in Alberta. Under PBR, EPCOR's annual electricity distribution rates are set by a formula that is generally equal to last year's rate plus an inflation factor less a productivity factor plus a provision for additional approved capital additions. Capital projects may be applied for annually in a separate capital application (capital tracker). Our ability to recover the actual costs of providing service and to earn a fair return is dependent upon maintaining cost increases at or below inflation, achieving the productivity factor and not exceeding the approved capital additions, all as defined by the PBR formula or approved in a capital tracker application. The current performance based framework will set rates to December 31, 2017.
In December 2016, the AUC issued its 2018-2022 PBR decision (Next Generation PBR) continuing the use of a performance based framework to December 31, 2022. EPCOR's electricity distribution rates for 2018 will be based on approved capital additions to the end of 2017 and actual operating and capital expenditures incurred during the 2013-2017 PBR term. The productivity factor in the Next Generation PBR term will be 0.3%, down from 1.16% currently. In addition, the Next Generation PBR decision also revised the criteria for capital tracker applications which will limit the volume of eligible capital projects.
In November 2013, the AUC issued a decision in the Utility Asset Disposition Review proceeding directing that certain gains or losses due to extraordinary retirement of assets be borne by shareholders and not to be reflected in customer rates. In September 2015, the Alberta Court of Appeal (the Court) upheld the AUC's decision.
Health and Safety Risk
The Company is responsible for ensuring that the potable water it sells to customers is safe to drink. Water Services performs continuous and rigorous quality control testing of water purification consistent with government and industry standards to prevent public health issues due to inadequately treated, stored or distributed drinking water. The ability of the water treatment plants to meet potable water quality standards is dependent on continuous water testing in order that the prescribed requirements under regulation or conventional industry standards are met. Failure to properly maintain fully functioning treatment and measurement systems could result in regulatory fines or the occurrence of public health issues.
In Alberta, water quality for EPCOR's operations is regulated under the provincial Environmental Protection and Enhancement Act (EPEA). Regulation under the EPEA takes the form of an "Approval to Operate" which, among other things, specifies the quality of the treated water, the number, frequency and form of water quality testing, as well as mandatory standards for the water treatment process. The drinking water quality requirements in Alberta meet or exceed the National Guidelines for Canadian Drinking Water Quality recommended by Health Canada.
Raw water quality is an important factor in the treatment of potable water. In Edmonton, we obtain surface water from the North Saskatchewan River to treat and sell to customers in the greater Edmonton area. The North Saskatchewan Watershed Alliance, among other things, aims to protect and improve North Saskatchewan River water quality by developing and sharing knowledge and facilitating workshops with members and interested parties.
Drinking water quality and wastewater standards for EPCOR's U.S. operations are regulated by the U.S. Environmental Protection Agency (U.S. EPA) under the Safe Drinking Water Act and Clean Water Act, respectively. Among other things, the U.S. Environmental Protection Agency sets drinking water standards specifying the treatment, source water protection, operator training and funding for water system improvement and relies on the states and localities to carry out the standards. Oversight of water and wastewater systems is conducted by state and county authorities to the degree that they establish standards at least as stringent as the U.S. EPA.
In Arizona, we obtain surface water primarily from the Central Arizona Project canal to treat and sell to customers. The Central Arizona Project conducts water quality testing upstream of the take-off points and has a formal notification process in place to notify our Arizona operations of any water quality issues that may arise. Process and compliance sampling results are stringently analyzed and trended for all groundwater and surface water systems in Arizona and New Mexico to ensure systems continue to meet all regulatory standards. Each system in Arizona and New Mexico has an Emergency Operations Plan which addresses water quality issues and provides further risk mitigation.
There are no formal watershed protection groups in the Arizona and New Mexico service areas. The Arizona Department of Environmental Quality and New Mexico Environment Department oversee the water systems in their states, respectively. Water wells in Arizona, New Mexico and Texas are protected from contamination by proper well construction and system operation and management.
Our operations have hazardous elements, such as high voltage electricity and hazardous chemicals that could have adverse health and safety consequences to our employees, on-site suppliers and customers.
We manage health, safety and environment (HSE) risks through a management system and measure HSE performance against recognized industry and internal performance measures. We conduct external and internal compliance and conformance audits to verify that we meet or exceed all regulatory requirements. We are committed to working with industry partners to share and improve health, safety and environment practices within the industry. In 2016, all of our Edmonton water and wastewater treatment facilities, and electricity distribution and transmission operations remain OHSAS 18001 registered.
Information Technology Related Security Risks
We use several key information technology systems to support our core operations such as electricity and water distribution network control systems, electricity and water plant control systems and electricity settlement and utility billing systems. These systems and the associated hardware are vulnerable to malfunction and unauthorized access including cyber-attacks, which could lead to loss or unauthorized disclosure of sensitive customer or EPCOR information or extortion or otherwise disrupt operations. We take measures to reduce the risk of malicious corruption or failure of these systems, data and the hardware and network infrastructure on which they operate. EPCOR's security program is based on the ISO 27002 control framework. In applying this framework, EPCOR has implemented a series of complementary defense mechanisms, starting from the external IT perimeter down to the end user. Each layer is designed to prevent, detect and report on malicious activity.
We regularly monitor our information technology protection systems and periodically employ third-party security providers to test the effectiveness and to strengthen the system as new cyber threats arise.
Financial exposures associated with cyber-attacks are partly mitigated through our insurance programs.
Risk of Reputational Damage
EPCOR has controls and strategies in place to mitigate the exposure to the various risks that could result in damage to EPCOR's reputation should an event occur. The company proactively maintains positive and transparent interactions with stakeholders. In addition, EPCOR communicates with stakeholders and the media when issues first arise and actively monitors social media in order to address reputational matters before they escalate.
Environment Risk
There are a variety of environmental risks associated with EPCOR's water and wastewater operations and its electricity distribution and transmission businesses. EPCOR's power and water operations are subject to laws, regulations, and operating approvals which are designed to reduce the impacts on the environment. An environmental event could materially and adversely impact EPCOR's business, prospects, reputation, financial condition, operations or cash flow. Furthermore, such incidents could result in spills or emissions in excess of those permitted by law, regulations or operating approvals.
Environmental risks associated with water and wastewater operations include wastewater discharge, biogas release, and residuals management. EPCOR's wastewater operations are regulated with stringent wastewater treatment standards and controls covering quality of treated wastewater effluent as well as mandatory improvements to the wastewater treatment processes. Water and wastewater technologies and supporting processes are continuing to evolve and are influenced by more stringent regulation and environmental challenges. Failure to identify and deploy viable new technologies to meet these regulations and challenges could undermine the competitiveness of EPCOR's market position and exclude it from some market opportunities.
Risks associated with electricity distribution and transmission operations include the unintended environmental release of substances such as oil from its oil-filled pipe-type cable, hydraulic oil and polychlorinated biphenyl transformer fluid.
To the best of our knowledge we comply, in all material respects, with the laws, regulations and operating approvals affecting our facilities, and minimize the potential for incidents by incorporating environmental management practices in our strategy, policies, processes and procedures. To achieve this, we require each facility to have an environmental management system (EMS) which is based on the ISO 14001 standard. These systems encompass the identification of the scope, objectives, training and stewardship of our environmental responsibility. Each plant and facility is also subject to third party environmental audits to help ensure conformance with the EMS and compliance with all regulations. The Edmonton waterworks system (including the Rossdale and E.L. Smith water treatment plants) achieved EnviroVista Champion status as of June 2011. In 2016, all of our Edmonton water treatment facilities and reservoirs, the Gold Bar wastewater treatment plan, the Evan-Thomas water and wastewater treatment facility in Kananaskis, Alberta, our electricity distribution and transmission operations and our street lighting, traffic signal, light rail transit, hydrovac and cathodic protection operations remain ISO 14001 registered. The Company is also in the process of obtaining ISO 14001 registration for its Canadian water distribution and transmission operations.
Compliance with future environmental legislation may require material capital and operating expenditures. Failure to comply could result in fines and penalties or the regulator could force the curtailment of operations. There can be no assurances that compliance with or changes to environmental legislation will not materially and adversely impact EPCOR's business, prospects, financial conditions, operations or cash flow.
Business Interruption Risks
A variety of intentional, accidental or natural occurrences could cause interruption of EPCOR's operations and result in lost revenues or additional costs to resume operations including repair costs.
Business interruption due to operational failure in Water Services and Distribution and Transmission is managed through inherent redundancy and sound maintenance practices.
The quality of raw source water can be affected by such things as hydrocarbons and other inorganic or organic contaminants entering water ways and aquifers. Depending on the type and concentration of the contaminant, their removal may be beyond the capabilities of water treatment plant processes. This could result in the water treatment plants being shut down until the contaminants become diluted to the point where they can be treated within the water treatment plant capabilities.
The ability of the water treatment plants to meet potable water quality standards is dependent on continuous water testing in order that the prescribed requirements under regulation or conventional industry standards are met. Failure to properly maintain fully functioning treatment and measurement systems could result in regulatory fines, lost revenue or the occurrence of public health issues. Our maintenance practices are augmented by an inventory of strategic spare parts, which can reduce down-time considerably in the event of power or water system interruptions.
Maintenance and capital plans are determined annually based on rigorous assessment of its equipment and by continually monitoring the condition of assets.
Although water and power facilities have operated in accordance with expectations, there can be no assurance that they will continue to do so. To the extent we experience insufficient raw water supply or extreme raw water conditions, delivery of water and associated revenues may be negatively affected. To the extent our electricity facilities experience outages due to equipment failure, blackouts or constraints on the transmission system, delivery of power and associated revenues may be negatively affected.
The Company's business continuity plans aim to enable EPCOR to continue providing critical services to customers in the event a crisis. The Company's emergency response protocols are designed to ensure EPCOR can expeditiously resume operations following a business interruption. Financial exposures associated with business interruption are partly mitigated through our insurance programs.
Failure to Attract, Retain or Develop Top Talent
Our ability to continuously operate and grow the business is dependent upon attracting, retaining and developing sufficient labor and management resources. As with most organizations, the Company is facing the demographic shift where a large number of employees are expected to retire over the next few years. Failure to secure sufficient qualified technical and leadership talent may impact EPCOR's operations or increase expenses.
We believe that we employ good human resource practices and in 2016, we were named a top 70 employer in Alberta, by Mediacorp Canada Inc. We continue to monitor developments and review our human resource strategies so that we have an adequate supply of labor and management.
New Business Integration Risk
EPCOR plans to diversify its utility infrastructure investments across investment types and North American geographies to reduce investment risk. The Company is planning to accomplish this through expansion into natural gas distribution and its pursuit of the Drainage transfer from the City to EPCOR.
These types of utility businesses are new to EPCOR which introduces risk to the Company due to unfamiliarity with the associated operational, safety and regulatory risks in addition to the risks associated with integrating these businesses into EPCOR.
EPCOR develops comprehensive integration plans and ensures that personnel with appropriate skills are in place to manage all of the various risks when integrating any new businesses into the Company.
Water Scarcity Risk
Water scarcity is the risk of inadequate raw water supply, particularly in the desert region of the Southwestern U.S. This is primarily related to drought conditions which could potentially impact EPCOR's water operations in Arizona, New Mexico and Texas.
In Arizona in particular, a number of water management and supply augmentation strategies are employed to mitigate this risk including enacting some very progressive policies to protect groundwater supplies. While EPCOR is not obligated to demonstrate long term water adequacy for new customer growth, EPCOR actively manages its sources of water including replenishing reserves by injecting water into its wells when opportunity arises and working with regulators on rate rebalancing to mitigate the effects of declining consumption should it occur.
Despite these efforts, continued drought in the Southwestern U.S. could result in legislated measures to further reduce customer water consumption, potentially impacting financial performance in Arizona and New Mexico.
Electricity Price and Volume Risk
EPCOR sells electricity to RRO customers under a RRT. All electricity for the RRO customers is purchased in real time from the AESO in the spot market. Under the RRT, the amount of electricity to be economically hedged, the hedging method and the electricity selling prices to be charged to these customers is determined by the EPSP. Under the EPSP, the Company uses financial contracts to economically hedge the RRO requirements and incorporate the price into customer rates for the applicable month. Fixed volumes of electricity are economically hedged using financial contracts-for-differences up to 120 days in advance of the month in which the electricity (load) is consumed by the RRO customers. The volume of electricity economically hedged in advance is based on load (usage) forecasts for the consumption month. When consumption varies from forecast consumption patterns, EPCOR is exposed to prevailing market prices when the volume of electricity economically hedged is short of actual load requirements or greater than the actual load requirements (long). Exposure to variances in electricity volume can be exacerbated by other events such as unexpected generation plant outages and unusual weather patterns.
Under contracts-for-differences the Company agrees to exchange, with a single creditworthy and adequately secured counterparty, the difference between the AESO electricity spot market price and the fixed contract price for a specified volume of electricity up to 120 days in advance of the consumption date, all in accordance with the EPSP. The contracts-for-differences are referenced to the AESO electricity spot price and any movement in the AESO price results in changes in the contract settlement amount. If the risks of the EPSP were to become untenable, EPCOR could test the market and potentially re-contract the procurement risk under an outsourcing arrangement at a certain cost that would likely increase procurement costs and reduce margins. The Company may enter into additional financial electricity purchase contracts outside the EPSP to further economically hedge the price of electricity.
Project Risk
Our construction and development of water and wastewater treatment facilities and electricity transmission and distribution infrastructure and acquisition activities are subject to various engineering, construction, stakeholder, government and environmental risks. These risks can translate into performance issues, delays and cost overruns. Project delays may defer expected revenues and project cost overruns could make projects uneconomic. Many of the water and wastewater growth projects currently pursued by the Company require design and construction capabilities that are provided by third parties. In order to pursue these projects, strategic partnerships have been established with reputable firms that have an established track record of infrastructure design and construction. Should these partnerships dissolve or are not recognized by the market as a viable approach, the Company's growth plans could potentially be curtailed.
We attempt to mitigate project risks by performing detailed project analysis and due diligence prior to and during construction or acquisition, and by entering into appropriate contracts for various services to be provided as required. Our ability to complete projects successfully depends upon numerous factors such as weather, civil disobedience, availability of skilled labor, strikes and regulatory matters.
Weather Risk
Weather can have a significant impact on our operations. Melting snow, freeze / thaw cycles and seasonal precipitation in the North Saskatchewan River watershed affect the quality of water entering our Edmonton water treatment plants and the resulting cost of purification. Weather variability and seasonality also impact the demand and supply of water and electricity in our respective businesses in Canada and the U.S.
Extreme weather can cause damage to electricity distribution and transmission equipment and wires, temporarily disrupting the reliable supply of power to customers and can cause unpredictability in the demand for power. Unseasonal temperature changes can cause water main breaks temporarily disrupting the reliable supply of water to customers.
Weather that varies significantly from historical norms can result in changes in the quantity of provincial power consumption. EPCOR procures power to service its RRO customers in advance of the consumption month and the quantity procured is based on historical weather and usage patterns. Unseasonal temperatures can cause a mismatch between the power procured in advance of the consumption month and actual customer usage, resulting in unexpected variances in income from the RRO business.
Financial exposures associated with extreme weather are partly mitigated through our insurance programs.
Financial Liquidity Risk
EPCOR's internally generated cash flows from operating activities do not provide sufficient capital to undertake or complete ongoing or future development, enhancement opportunities or acquisition plans and accordingly, the Company requires additional financing from time to time. The ability of the Company to arrange such financing will depend in part upon prevailing market conditions at the time and the Company's business performance. If the Company's revenues or cash flows decline, it may not have the capital necessary to undertake or complete all the initiatives. There can be no assurance that debt or equity financing will be available or sufficient to meet these requirements or for other corporate purposes. Furthermore, if financing is available, there can be no assurance that it will be on terms acceptable to the Company. The inability of the Company to access sufficient capital for its operations could have a material adverse effect on the Company's business, prospects and financial condition. Further discussion is included in Liquidity and Capital Resources in this MD&A.
The Company manages liquidity risk through regular monitoring of cash and currency requirements by preparing short-term and long-term cash flow forecasts and also by matching the maturity profiles of financial assets and liabilities to identify financing requirements. EPCOR's financial risks are governed by a Board-approved financial exposure management policy, which is administered by EPCOR's Treasurer.
Counterparty and Credit Risk
Counterparty and credit risk is the possible financial loss associated with the ability of counterparties to satisfy their contractual obligations to EPCOR, including payment and performance including the long-term loans receivable from Capital Power.
We manage credit risk and limit exposures through our credit policies and procedures. These include an established credit review, rating and monitoring process, specific terms and limits, appropriate allowance provisioning and use of credit mitigation strategies, including collateral arrangements.
EPCOR's credit risks are governed by a Board-approved counterparty credit risk management policy, which is administered by EPCOR's treasury function.
Significant reliance is placed on the capacity of Capital Power to honor its remaining back-to-back debt obligations with EPCOR. Should Capital Power fail to satisfy these obligations, EPCOR's capacity to satisfy its debt obligations would be reduced and would need to be satisfied by other means. The back-to-back debt obligations may be called for repayment by EPCOR at any time now that the principal outstanding is less than $200 million and the repayment must occur within 180 days of notice. Capital Power has indemnified EPCOR for any losses arising from its inability to discharge its liabilities, including any amounts owing to EPCOR in relation to the long-term loans receivable.
Exposure to credit risk for residential RRO customers and commercial customers under default electricity supply rates are generally limited to amounts due from the customers for electricity consumed but not yet paid for. This portfolio is reasonably well diversified with no significant credit concentrations. Historically, credit losses in these customer segments have not been significant and depend in large part on the strength of the economy and the ability of the customers to effectively manage their financial affairs through economic cycles and competitive pressures. While electricity is considered an essential service, EPCOR may experience credit losses in the future should economic conditions deteriorate.
EPCOR's exposure to RRO and default customer credit risk, which is primarily the risk of non-payment for electricity consumed by these end-use customers, is summarized below. Exposures represent the accounts receivable value for this portfolio.
| ($ millions) December 31, | 2016 | 2015 |
| RRO and default supply customers1 | $ 116 | $ 134 |
- EPCOR monitors credit risk for this portfolio at the gross exposure level rather than by individual customer account.
The year-over-year decrease in exposure relates to lower customer rates and consumption.
Exposures to credit risk in our rate-regulated and non-rated-regulated water businesses are generally limited to amounts due from the customers for water consumed and wastewater discharged but not yet paid for, as well as amounts for water management services provided under contracts to municipal and industrial customers.
This portfolio is reasonably well diversified with no significant credit concentrations. While water is considered an essential service, EPCOR may experience credit losses in the future should economic conditions deteriorate. EPCOR's exposure to rate-regulated and non-rate-regulated customer credit risk, which is primarily the risk of non-payment for water consumed by these end-use customers, is summarized below. Exposures represent a 60-day potential accounts receivable value for this portfolio.
| ($ millions) December 31, | 2016 | 2015 |
| Unrated customers | $ 61 | $ 61 |
| Rated customers1 | 22 | 157 |
- Rated customers have investment grade credit ratings which are based on the Company's internal criteria and analyses, which take into account, among other factors, the investment grade ratings of external credit rating agencies when available.
Billing Error Risk
The customer consumption data used to bill utility customers is voluminous plus the sources and types of customer billing data are varied, requiring large, complex systems to process customer billings. In addition, the Company relies on third parties to provide customer meter data in certain circumstances and to produce bills for its U.S. customers. All of this contributes to the potential for billing errors caused by poor customer consumption data quality, billing system computational errors, incorrect customer rates being used or transactions and adjustments being applied incorrectly to customer accounts. The Company applies numerous manual and automated controls to ensure the quality of customer billings including a routine to identify various exceptions in the electricity meter data used to produce bills.
Foreign Exchange Risk
The Company is exposed to foreign exchange risk on foreign currency denominated transactions, firm commitments, monetary assets and liabilities denominated in a foreign currency and on its net investments in foreign entities.
The Company's financial exposure management policy attempts to minimize economic and material transactional exposures arising from movements in the Canadian dollar relative to the U.S. dollar or other foreign currencies. The Company's direct exposure to foreign exchange risk arises on capital expenditure commitments denominated in U.S. dollars or other foreign currencies and U.S. operations. The Company coordinates and manages foreign exchange risk centrally, by identifying opportunities for naturally occurring opposite movements and then dealing with any material residual foreign exchange risks. The Company's exposure to foreign exchange risk on its investment in foreign entities is partially mitigated by foreign-denominated financing.
The Company may use foreign currency forward contracts to fix the functional currency of its non-functional currency cash flows thereby reducing its anticipated U.S. dollar denominated transactional exposure. The Company looks to limit foreign currency exposures as a percentage of estimated future cash flows.
Conflicts of Interest
Certain conflicts of interest could arise as a result of EPCOR's relationship with the City, EPCOR's sole common shareholder and regulator for water and wastewater utility rates in Edmonton.
General Economic Conditions, Business Environment and Other Risks
The following factors could materially adversely impact EPCOR's business, prospects, financial condition, results of operations or cash flows: fluctuations in interest rates, product supply and demand, market competition, risks associated with technology, general economic and business conditions, EPCOR's ability to make capital investments and the amounts of capital investments, risks associated with existing and potential future lawsuits and other regulations, assessments and audits (including income tax) against EPCOR and its subsidiaries, political and economic conditions in the geographic regions in which EPCOR and its subsidiaries operate, difficulty in obtaining necessary regulatory approvals, a significant decline in EPCOR's reputation and such other risks and uncertainties described from time to time in EPCOR's reports and filings with the Canadian Securities authorities.
The following table outlines our estimated sensitivity to specific risk factors as at December 31, 2016. Each sensitivity factor provides a range of outcomes assuming all other factors are held constant and current risk management strategies are in place. Under normal circumstances, such sensitivity factors will not be held constant but rather, will change at the same time as other factors are changing. In addition, the degree of sensitivity to each factor will change as the Company's mix of assets and operations subject to these factors changes.
| ($ millions, except as otherwise noted)Factor | Change | Annual cash flow | Annual net income |
| Increase in RRO customers | +2.0% | +0.9 | +0.9 |
| Decrease in RRO customers | -2.0% | -0.9 | -0.9 |
| Increase in water consumption | +5.0% | +12.8 | +12.8 |
| Decrease in water consumption | -5.0% | -12.8 | -12.8 |
Litigation Update
The Company is not involved in any material litigation at this time.
Controls and procedures
For purposes of certain Canadian securities regulations, EPCOR is a venture issuer. As such, it is exempt from certain of the requirements of National Instrument 52-109 Certification of Disclosure in Issuers' Annual and Interim Filings. The Chief Executive Officer and Chief Financial Officer have reviewed the annual information form, annual financial statements and annual MD&A, for the year ended December 31, 2016. Based on their knowledge and exercise of reasonable diligence, they have concluded that these materials fairly present in all material respects the financial condition, results of operations and cash flows of the Company for the periods presented.
Future Accounting Standard Changes
A number of new standards, amendments to standards and interpretations have been issued by the IASB and the International Financial Reporting Interpretations Committee the application of which is effective for periods beginning on or after January 1, 2017. Those which may be relevant to the Company and may impact the accounting policies of the Company are set out below. The Company does not plan to adopt these standards early. The extent of the impact of adoption of the standards has not yet been determined.
IFRS 9 - Financial Instruments (IFRS 9), which replaces IAS 39 - Financial Instruments: Recognition and Measurement, eliminates the existing classification of financial assets and requires financial assets to be measured based on the business model in which they are held and the characteristics of their contractual cash flows. Gains and losses on re-measurement of financial assets at fair value will be recognized in profit or loss, except for an investment in an equity instrument which is not held-for-trading. Changes in fair value attributable to changes in credit risk of financial liabilities measured under the fair value option will be recognized in other comprehensive income with the remainder of the change recognized in profit or loss unless an accounting mismatch in profit or loss occurs at which time the entire change in fair value will be recognized in profit or loss. Derivative liabilities that are linked to and must be settled by delivery of an unquoted equity instrument must be measured at fair value. The impairment model has also been amended by introducing a new 'expected credit loss' model for calculating impairment, and new general hedge accounting requirements. The effective date for implementation of IFRS 9 has been set for annual periods beginning on or after January 1, 2018.
IFRS 15 - Revenue from Contracts with Customers (IFRS 15), which replaces IAS 11 - Construction Contracts and IAS 18 - Revenue and related interpretations, is effective for annual periods commencing on or after January 1, 2018. IFRS 15 introduces a new single revenue recognition model for contracts with customers and two approaches to recognizing revenue: at a point in time or over time. The model features a contract-based five-step analysis of transactions to determine whether, how much and when revenue is recognized. New estimates and judgmental thresholds have been introduced, which may affect the amount and / or timing of revenue recognized. The requirements of the standard also apply to the recognition and measurement of gains and losses on sale of some non-financial assets that are not part of the entity's ordinary activities.
IFRS 16 - Leases (IFRS 16), which replaces IAS 17 - Leases (IAS 17), is effective for annual periods commencing on or after January 1, 2019. IFRS 16 combines the existing dual model of operating and finance leases in IAS 17 into a single lessee model. Under the new single lessee model, a lessee will recognize lease assets and lease liabilities on the statement of financial position initially measured at the present value of unavoidable lease payments. IFRS 16 will also cause expenses to be higher at the beginning and lower towards the end of a lease, even when payments are consistent throughout the term. Leases for duration of twelve months or less and leases of low value assets are exempted from recognition on the statement of financial position. Lessors will continue with a dual lease classification model and the classification will determine how and when a lessor will recognize lease revenue and what assets will be recorded.
Critical accounting estimates
In preparing the consolidated financial statements, management necessarily made estimates in determining transaction amounts and financial statement balances. The following are the items for which significant estimates were made in the financial statements.
Electricity Revenues, Costs and Unbilled Consumption
Due to the lag time between customer electricity consumption and receipt of final billing consumption information from the load settlement agents, the Company must use estimates for determining the amount of electricity consumed but not yet billed. These estimates affect accrued revenues and accrued electricity costs of the Energy Services segment. There are a number of variables and judgments required in the computation of these significant estimates, and the underlying electricity settlement processes within EPCOR and the Alberta electric systems are complex. Such variables and judgments include the number of unbilled sites, and the amount of and rate classification of the unbilled electricity consumed. Owing to the factors above and the statutory delays in final load settlement determinations and information, adjustments to previous estimates could be material. Estimates for unbilled consumption averaged approximately $51 million at the end of each month in 2016 (2015 - $53 million). These estimates varied from $35 million to $68 million (2015 - $42 million to $67 million). Adjustments of estimated revenues to actual billings were not higher than $5 million per month in 2016 (2015 - $6 million).
Fair Values
We are required to estimate the fair value of certain assets or obligations for determining the valuation of certain financial instruments, asset impairments, asset retirement obligations and purchase price allocations for business combinations, and for determining certain disclosures. Significant judgment is applied in the determination of fair values including the choice of discount rates, estimating future cash flows, and determining goodwill. Following are the descriptions of the key fair value methodologies relevant for 2016.
Fair values of financial instruments are based on quoted market prices when these instruments are traded in active markets. In illiquid or inactive markets, the Company uses appropriate price modeling to estimate fair value. Fair values determined using valuation models require the use of assumptions concerning the amounts and timing of future cash flows and discount rates.
The Company reviews the valuation of long-lived assets subject to amortization when events or changes in circumstances may indicate or cause a long-lived asset's carrying amount to exceed the total undiscounted future cash flows expected from its use and eventual disposition. An impairment loss, if any, will be recorded as the excess of the carrying amount of the asset over its fair value, measured by either market value, if available, or estimated by calculating the present value of expected future cash flows related to the asset.
Estimates of fair value for long-lived asset impairments are mainly based on depreciable replacement cost or discounted cash flow techniques employing estimated future cash flows based on a number of assumptions, including the selection of an appropriate discount rate. The cash flow estimates will vary with the circumstances of the particular assets or reporting unit and will primarily be based on the lives of the assets, revenues and expenses, including inflation, and required capital expenditures.
Income Taxes
EPCOR follows the asset and liability method of accounting for income taxes. Income taxes are determined based on estimates of our current taxes and estimates of deferred taxes resulting from temporary differences between the carrying values of assets and liabilities in the financial statements and their tax values. Deferred tax assets are assessed and significant judgment is applied to determine the probability that they will be recovered from future taxable income. For example, in estimating future taxable income, judgment is applied in determining the Company's most likely course of action and the associated revenues and expenses. To the extent recovery is not probable a deferred tax asset is not recognized. Estimates of the provision for income taxes and deferred tax assets and liabilities might vary from actual amounts incurred.
Estimated fair values and useful lives are used in determining potential impairments for each long-lived asset, which will vary with each asset and market conditions at the particular time. Similarly, income taxes will vary with taxable income and, under certain conditions, with fair values of assets and liabilities. Accordingly, it is not possible to provide a reasonable quantification of the range of these estimates that would be meaningful to readers.
Impact of Current Market Conditions on Estimates
Although the current condition of the economy has not impacted our methods of estimating accounting values, it has impacted the inputs in those determinations and the resulting values. Future cash flow estimates for assessing long-lived assets (cash generating units or CGUs) for impairment were updated to reflect any increased uncertainties of recoverability. The assessments did not result in any impairment losses because a large portion of the Company's long-lived assets are subject to rate-regulation. Similarly, the assessment of the useful lives of our long-lived assets did not change since many of our distribution and transmission assets and water assets are amortized based on rates approved by the applicable regulator. Our valuation models for estimating the fair value of long-lived asset impairments depend partly on discount rates which were updated to reflect changes in credit spreads and market volatility. Our methods for determining the allowance for doubtful accounts are based on historical rates of bad debts in relation to the aged accounts receivable balances by customer group for RRO and default customer bases. These analyses did not reveal any significant changes in our assessment of the recoverability of accounts receivable at December 31, 2016.
Other comprehensive income
For the three and twelve months ended December 31, 2016, the Company's transactions in other comprehensive income included the following:
| ($ millions) | Three months ended December 31, | Twelve months ended December 31, | ||
2016 | 2015 | 2016 | 2015 | |
| Re-measurement of net defined benefit plans | (1) | 2 | (1) | 2 |
| Equity share of other comprehensive income of Capital Power L.P. | - | (5) | - | 2 |
| Equity share of other comprehensive income of Capital Power L.P. realized in net income | - | 5 | - | (9) |
| Fair value gain (loss) on available-for-sale investment in Capital Power | 14 | (10) | 43 | (60) |
| Impairment of on available-for-sale investment in Capital Power reclassified to net income | - | 10 | - | 60 |
| Fair value gain on available-for-sale investment in Capital Power reclassified to net income on sale of portion of investment | (30) | - | (42) | - |
| Unrealized gain (loss) on foreign currency translation | 10 | 14 | (11) | 61 |
| Other comprehensive income (loss) | $ (7) | $ 16 | $ (11) | $ 56 |
Fourth quarter review and quarterly results
| (Unaudited, $ millions) Quarters ended | Revenues | Net income |
| December 31, 2016 | $ 474 | $ 88 |
| September 30, 2016 | 504 | 76 |
| June 30, 2016 | 479 | 67 |
| March 31, 2016 | 475 | 78 |
| December 31, 2015 | 523 | 65 |
| September 30, 2015 | 511 | (13) |
| June 30, 2015 | 489 | 139 |
| March 31, 2015 | 473 | 69 |
Events for the past eight quarters compared to the same quarter of the prior year that have significantly impacted net income included:
- December 31, 2016, fourth quarter results included the recognition of the fair value gain resulting from the sale of Capital Power shares, greater favorable fair value adjustments related to financial electricity purchase contracts and interest rate swaps and higher approved distribution and water customer rates, partially offset by lower transmission customer rates, lower billing charge rates, higher depreciation and lower income related to industrial services contracts.
- September 30, 2016 third quarter results included greater favorable fair value adjustments related to financial electricity purchase contracts, the recognition of the fair value gain resulting from the sale of the Capital Power shares, and higher approved electricity and water customer rates, partially offset by lower billing charge rates and higher depreciation. In addition, 2015 included an impairment of the Capital Power shares.
- June 30, 2016 second quarter results included lower favorable fair value adjustments related to financial electricity purchase contracts and interest rate swaps and excluded any gains related to Capital Power. These decreases were partially offset by higher approved electricity and water customer rates and higher income related to industrial service contracts.
- March 31, 2016 first quarter results included higher approved electricity and water customer rates, gains on sales of surplus lands, higher income related to industrial services contracts, and higher dividend income from Capital Power. This was partially offset by no equity share of income of Capital Power, and lower favorable fair value adjustments on financial electricity purchase contracts.
- December 31, 2015 fourth quarter results included an impairment of the available-for-sale investment in Capital Power, no equity share of income of Capital Power and lower deferred income tax recovery. This was partially offset by higher approved water and electricity customer rates, higher billing charge rates, higher customer water consumption, and higher favorable fair value adjustments on financial electricity purchase contracts.
- September 30, 2015 third quarter results included the impairment of the available-for-sale investment in Capital Power and unfavorable fair value adjustments related to the financial electricity purchase contracts, partially offset by higher approved water and electricity customer rates, higher billing charge rates, and higher EPSP margins.
- June 30, 2015 second quarter results included a gain on sale of a portion of investment in Capital Power and a gain on reclassification of investment in Capital Power to an available-for-sale asset. It also included higher approved water and electricity customer rates, higher fair value adjustments on financial electricity purchase contracts, lower income tax expense due to the re-organization of Energy Services, and favorable fair value adjustments related to the interest rate swap.
- March 31, 2015 first quarter results included higher approved water and electricity customer rates, higher fair value adjustments on financial electricity purchase contracts, higher equity share of income of Capital Power, and lower income tax expense due to the re-organization of Energy Services. This was partially offset by a loss on fair value adjustments related to the interest rate swap.
Fourth Quarter Lines of Business Information
The comparative information in the line of business information have been reclassified, where applicable, to conform to current year presentation.
| Three months ended December 31, 2016 | ||||||
| Water Services | Distribution & Transmission | Energy Services | Corporate | Intersegment Elimination | Consolidated | |
| External revenues and other income | $ 159 | $ 106 | $ 209 | $ 3 | $ - | $ 477 |
| Inter-segment revenue | - | 41 | 3 | - | (44) | - |
| Total revenues and other income | 159 | 147 | 212 | 3 | (44) | 477 |
| Energy purchases and system access fees | - | 26 | 184 | - | (39) | 171 |
| Other raw materials and operating charges | 44 | 14 | - | - | (2) | 56 |
| Staff costs and employee benefits expenses | 31 | 21 | 7 | 9 | (1) | 67 |
| Depreciation and amortization | 29 | 24 | 1 | 3 | - | 57 |
| Franchise fees and property taxes | 7 | 18 | - | - | - | 25 |
| Other administrative expenses | 9 | 4 | 8 | 7 | (2) | 26 |
| Operating expenses | 120 | 107 | 200 | 19 | (44) | 402 |
| Operating income (loss)before corporate charges | 39 | 40 | 12 | (16) | - | 75 |
| Corporate income (charges) | (9) | (7) | (3) | 19 | - | - |
| Operating income | 30 | 33 | 9 | 3 | - | 75 |
| Finance recoveries (expenses) | (24) | (13) | (1) | 16 | - | (22) |
| Fair value gain on available-for-sale investment in Capital Power reclassified to net income on sale of portion of investment | - | - | - | 30 | - | 30 |
| Income tax recovery | 1 | - | - | 4 | - | 5 |
| Net income | $ 7 | $ 20 | $ 8 | $ 53 | $ - | $ 88 |
| Capital additions | $ 70 | $ 84 | $ 2 | $ 5 | $ - | $ 161 |
| Three months ended December 31, 2015 | ||||||
| Water Services | Distribution & Transmission | Energy Services | Corporate | Intersegment Elimination | Consolidated | |
| External revenues and other income | $ 170 | $ 123 | $ 230 | $ 5 | $ - | $ 528 |
| Inter-segment revenue | - | 44 | 3 | - | (47) | - |
| Total revenues and other income | 170 | 167 | 233 | 5 | (47) | 528 |
| Energy purchases and system access fees | - | 38 | 204 | - | (41) | 201 |
| Other raw materials and operating charges | 49 | 15 | - | - | (3) | 61 |
| Staff costs and employee benefits expenses | 36 | 21 | 7 | 10 | - | 74 |
| Depreciation and amortization | 27 | 20 | 1 | 4 | - | 52 |
| Franchise fees and property taxes | 8 | 17 | - | - | - | 25 |
| Other administrative expenses | 6 | 3 | 6 | 9 | (3) | 21 |
| Operating expenses | 126 | 114 | 218 | 23 | (47) | 434 |
| Operating income (loss)before corporate charges | 44 | 53 | 15 | (18) | - | 94 |
| Corporate income (charges) | (10) | (7) | (2) | 19 | - | - |
| Operating income | 34 | 46 | 13 | 1 | - | 94 |
| Finance recoveries (expenses) | (24) | (13) | (1) | 9 | - | (29) |
| Dividend income from available-for- sale investment in Capital Power | - | - | - | 4 | - | 4 |
| Equity share of income of Capital Power L.P. | - | - | - | (7) | - | (7) |
| Gains on investment in Capital Power L.P., net of impairment | - | - | - | (3) | - | (3) |
| Income tax recovery | - | - | - | 6 | - | 6 |
| Net income | $ 10 | $ 33 | $ 12 | $ 10 | $ - | $ 65 |
| Capital additions | $ 61 | $ 70 | $ - | $ 6 | $ - | $ 137 |
Forward - looking information
Certain information in this MD&A is forward-looking within the meaning of Canadian securities laws as it relates to anticipated financial performance, events or strategies. When used in this context, words such as "will", "anticipate", "believe", "plan", "intend", "target", and "expect" or similar words suggest future outcomes.
The purpose of forward-looking information is to provide investors with management's assessment of future plans and possible outcomes and may not be appropriate for other purposes.
Material forward-looking information within this MD&A, including related material factors or assumptions and risk factors, are noted in the table below:
| Forward-looking Information | Material Factors or Assumptions | Risk Factors | ||
| The Company expects to have sufficient liquidity to finance its plans and fund its obligations in 2017. | EPCOR is able to generate the expected cash flow from operations and various means of funding remain available to the Company. | EPCOR's operations do not generate the expected level of cash flow and / or circumstances arise limiting or restricting the Company's ability to access funds through the various means otherwise available. | ||
| EPCOR's projected cash requirements for 2017 includes $500 million to $650 million for investment in existing businesses and new business development. | EPCOR is able to complete its 2017 capital expenditure program on time and on budget and no material unplanned business or asset acquisitions are closed in the year. | EPCOR is successful in closing an unplanned acquisition or unforeseen circumstances result in construction delays. | ||
| If Drainage is transferred then: - EPCOR will assume assets and liabilities of approximately $3.3 billion and $0.7 billion, respectively. - EPCOR has proposed an increase in the dividend of $20 million. - For the first year of operations, capital spending is expected to be approximately $120 million to $200 million. | Transfer takes place under the currently proposed terms. | Transfer or terms are varied. Actuals vary from estimated amounts. | ||
| EPCOR's projected cash requirements for 2017 include $146 million for common share dividends. | EPCOR is able to generate the expected cash flow from operations and various means of funding remain available to the Company. The EPCOR Board of Directors does not revise the dividend to the City. | EPCOR is not able to generate the expected cash flow from operations and various means of funding are not available to the Company. The Board of Directors approves a revised dividend to the City. |
The following table provides a comparison between actual results and future-oriented-financial information previously disclosed:
| Material 2016 Objectives Previously Disclosed | Actual Result | Explanation of Material Differences from Objectives | ||||
| 2016 Capital expenditures and acquisitions | $400 million to $550 million | $553 million | $3 million variance not significant | |||
| Dividends | $141 million | $141 million | No difference | |||
| 2016 Interest payments | $115 million | $128 million | Higher interest payments of $13 million primarily due to the settlement of interest rate swap | |||
| Repayments of loan and borrowings net of sinking fund payments received | $239 million | Net repayment of short-term loans and borrowing $98 million Repayment of long-terms loans and borrowings $141 million | No difference | |||
Whether actual results, performance or achievements will conform to the Company's expectations and predictions is subject to a number of known and unknown risks and uncertainties, which could cause actual results to differ from expectations and are discussed in the Risk Factors and Risk Management section above.
Readers are cautioned not to place undue reliance on forward-looking statements as actual results could differ materially from the plans, expectations, estimates or intentions expressed in the forward-looking statements. Except as required by law, EPCOR disclaims any intention and assumes no obligation to update any forward-looking statement even if new information becomes available, as a result of future events or for any other reason.
Additional information
Additional information relating to EPCOR, including the Company's 2016 Annual Information Form, is available on SEDAR at www.sedar.com.
Contact Information:
Tim le Riche
(780) 969-8238
tleriche@epcor.com
Corporate Relations:
Claudio Pucci
(780) 969-8245 or toll free (877) 969-8280
cpucci@epcor.com