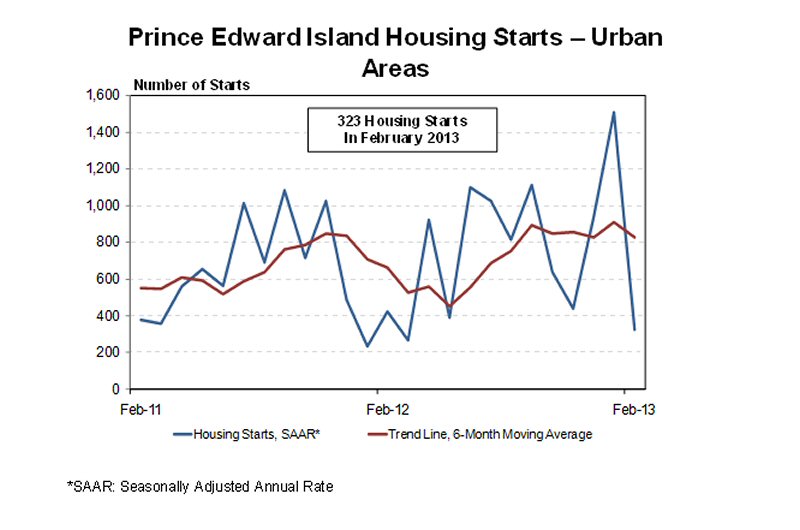
MONCTON, NEW BRUNSWICK--(Marketwire - March 8, 2013) - Housing starts in Prince Edward Island were trending at 827 units in February, according to Canada Mortgage and Housing Corporation (CMHC). The trend is a six month moving average of the monthly seasonally adjusted annual rates (SAAR)1 of housing starts.
"For the month of February, new home construction was above last year's level, due to an increase in multiple starts in Summerside. During the same period, single starts in both Charlottetown and Summerside did not reach the levels met in 2012," said Jason Beaton, CMHC's Market Analyst for Prince Edward Island.
CMHC uses the trend measure as a complement to the monthly SAAR of housing starts to account for considerable swings in monthly estimates and obtain a more complete picture of the state of the housing market. In some situations, analysing only SAAR data can be misleading in some markets, as they are largely driven by the multiples segment of the markets which can be quite variable from one month to the next.
The standalone monthly SAAR was 323 units in February, down from 1,507 in January.
Preliminary Housing Starts data is also available in English and French at the following link: Preliminary Housing Starts Tables
As Canada's national housing agency, CMHC draws on more than 65 years of experience to help Canadians access a variety of quality, environmentally sustainable and affordable housing solutions. CMHC also provides reliable, impartial and up-to-date housing market reports, analysis and knowledge to support and assist consumers and the housing industry in making informed decisions.
Follow CMHC on Twitter @CMHC_ca
[1] All starts figures in this release, other than actual starts and the trend estimate, are seasonally adjusted annual rates (SAAR) - that is, monthly figures adjusted to remove normal seasonal variation and multiplied by 12 to reflect annual levels. By removing seasonal ups and downs, seasonal adjustment allows for a comparison from one season to the next and from one month to the next. Reporting monthly figures at annual rates indicates the annual level of starts that would be obtained if the monthly pace was maintained for 12 months. This facilitates comparison of the current pace of activity to annual forecasts as well as to historical annual levels.
Additional data is available upon request
(Ce document existe également en français)
A graph is available at the following address: http://media3.marketwire.com/docs/pei_graph_eng_0308_800.jpg
| Preliminary Housing Start Data | |||
| February / 2012-2013 | |||
| Province, Centres 10,000+ | February 2012 |
February 2013 |
|
| Actual, urban centres1 | |||
| February - Single-Detached | 8 | 4 | |
| February - Multiples | - | 8 | |
| February - Total | 8 | 12 | |
| January to February - Single-Detached | 19 | 6 | |
| January to February - Multiples | - | 130 | |
| January to February - Total | 19 | 136 | |
| January 2013 |
February 2013 |
||
| SAAR2, urban centres1 | |||
| Total | 1,507 | 323 | |
| Source: CMHC | |||
| 1 Urban centres with a population of 10,000 and over. | |||
| 2 Seasonally Adjusted at Annual Rates | |||
| Detailed data available on request. | |||
| Prince Edward Island Preliminary Actual Housing Start Data | ||||||
| February / 2012-2013 | ||||||
| Urban Centres | Single-Detached | Multiples | Total | |||
| 2012 | 2013 | 2012 | 2013 | 2012 | 2013 | |
| Urban Centres 10,000+ | ||||||
| Charlottetown CA | 7 | 3 | 0 | 0 | 7 | 3 |
| Summerside CA | 1 | 1 | 0 | 8 | 1 | 9 |
| Total Urban Starts | 8 | 4 | 0 | 8 | 8 | 12 |
| Prince Edward Island Preliminary Actual Housing Start Data | ||||||
| January to February / 2012-2013 | ||||||
| Urban Centres | Single-Detached | Multiples | Total | |||
| 2012 | 2013 | 2012 | 2013 | 2012 | 2013 | |
| Urban Centres 10,000+ | ||||||
| Charlottetown CA | 17 | 5 | 0 | 122 | 17 | 127 |
| Summerside CA | 2 | 1 | 0 | 8 | 2 | 9 |
| Total Urban Starts | 19 | 6 | 0 | 130 | 19 | 136 |
Contact Information:
Jason Beaton
506-851-6047
Cell: 506-874-3989
jbeaton@cmhc.ca
Media Contact:
Patricia Montreuil
506-851-2229
Cell: 506-866-8047
pmontreu@cmhc.ca