ATHENS, GREECE--(Marketwired - Sep 10, 2014) - Globus Maritime Limited ("Globus," the "Company," "we," or "our"), (
| Financial Highlights | ||||||||||||
| Three months ended June 30, | Six months ended June 30, | |||||||||||
| (Expressed in thousands of U.S dollars except for daily rates and per share data) | 2014 | 2013 | 2014 | 2013 | ||||||||
| Net Revenue (1) | 6,100 | 5,827 | 12,328 | 12,758 | ||||||||
| Adjusted EBITDA (2) | 2,689 | 2,489 | 6,078 | 6,589 | ||||||||
| Total comprehensive (loss)/income | (1,241 | ) | (1,133 | ) | (159 | ) | 187 | |||||
| Basic & diluted loss per share | (0.14 | ) | (0.13 | ) | (0.04 | ) | 0.00 | |||||
| Impairment loss | (1,714 | ) | (1,031 | ) | (1,714 | ) | (1,031 | ) | ||||
| Total comprehensive income/(loss) adjusted for Impairment loss | 473 | (102 | ) | 1,555 | 1,218 | |||||||
| Basic & diluted earnings/(loss) per share adjusted for impairment loss | 0.02 | (0.03 | ) | 0.13 | 0.10 | |||||||
| Time charter equivalent rate (TCE) | 9,189 | 8,838 | 9,218 | 9,712 | ||||||||
| Average operating expenses per vessel per day | 5,002 | 4,791 | 4,561 | 4,333 | ||||||||
| Average number of vessels | 7.0 | 7.0 | 7.0 | 7.0 | ||||||||
| (1) | Net Revenue is computed by subtracting voyage expenses from revenue. Net Revenue is not a recognized measurement under international financial reporting standards ("IFRS") and should not be considered as an alternative or comparable to net income. |
| (2) | Adjusted EBITDA is a measure not in accordance with generally accepted accounting principles ("GAAP"). See a later section of this press release for a reconciliation of non-GAAP financial measures. |
Current Fleet Profile
As of the date of this press release, Globus' subsidiaries own and operate seven dry bulk carriers, consisting of four Supramax, two Panamax and one Kamsarmax.
| Vessel | Year Built | Yard |
Type |
Month/Year Delivered | DWT | FLAG | ||||||
| Tiara Globe | 1998 | Hudong Zhonghua | Panamax | Dec 2007 | 72,928 | Marshall Is. | ||||||
| Moon Globe | 2005 | Hudong-Zhonghua | Panamax | June 2011 | 74,432 | Marshall Is. | ||||||
| Sun Globe | 2007 | Tsuneishi Cebu | Supramax | Sept 2011 | 58,790 | Malta | ||||||
| River Globe | 2007 | Yangzhou Dayang | Supramax | Dec 2007 | 53,627 | Marshall Is. | ||||||
| Sky Globe | 2009 | Taizhou Kouan | Supramax | May 2010 | 56,855 | Marshall Is. | ||||||
| Star Globe | 2010 | Taizhou Kouan | Supramax | May 2010 | 56,867 | Marshall Is. | ||||||
| Jin Star | 2010 | Jiangsu Eastern | Kamsarmax | June 2010 | 79,387 | Panama | ||||||
| Weighted Average Age: 7.6 Years as of June 30, 2014 | 452,886 | |||||||||||
Current Fleet Deployment
The vessels Tiara Globe, Star Globe, Sky Globe, Moon Globe and River Globe are currently operating on short term time charters ("on spot").
The "Sun Globe" is currently on a T/C with Cosco Qingdao until January 2015 at $16,000 per day gross.
The "Jin Star" is on a bareboat charter with Eastern Media International and Far Eastern Silo & Shipping, which began during June 2010, for a period of five years at $14,250 per day gross.
Assuming all charter counterparties fully perform under the terms of the respective charters, and based on the earliest redelivery dates, as of the day of this press release, the Company has secured employment for approximately 29% of our fleet days for the rest of 2014.
| Employment Profile | ||||||||
| Vessel | Charterer | Expiration Date (Earliest) | Type | Gross Daily Rate | ||||
| Tiara Globe | Spot | Spot | Spot | Spot | ||||
| Moon Globe | Spot | Spot | Spot | Spot | ||||
| Sun Globe | Cosco Qingdao Shipping Co | Jan. 2015 | Time charter | $16,000 | ||||
| River Globe | Spot | Spot | Spot | Spot | ||||
| Sky Globe | Spot | Spot | Spot | Spot | ||||
| Star Globe | Spot | Spot | Spot | Spot | ||||
| Jin Star | Eastern Media International - Far Eastern Silo & Shipping | Jan. 2015 | Bareboat | $14,250 | ||||
Management Commentary
George Karageorgiou, President, Chief Executive Officer and Chief Financial Officer of Globus Maritime Limited, stated: "Despite the continued weakness in the dry bulk market during the second quarter 2014, we remain optimistic about the prospects for the industry for the remainder of this year and expect a stronger spot market in the 4th quarter. If this happens, with approximately 70% of our fleet days exposed to the spot market for the remainder of 2014, we can realize an increase in our time charter equivalent rate, versus the $9,218 achieved for the first half 2014 and at the same time, take advantage of the stronger rate environment by reducing our almost 100% exposure to the spot market in 2015, by securing part of our fleet on period charters. With net fleet growth in 2014 and 2015 expected to be at its lowest levels in quite some time and combined with strong dry bulk demand, the recovery in charter rates is in sight. Going forward, we remain confident in our ability to deliver profitable results and our intention is to grow the size of our fleet through sound acquisitions."
Management Discussion and Analysis of the Results of Operations
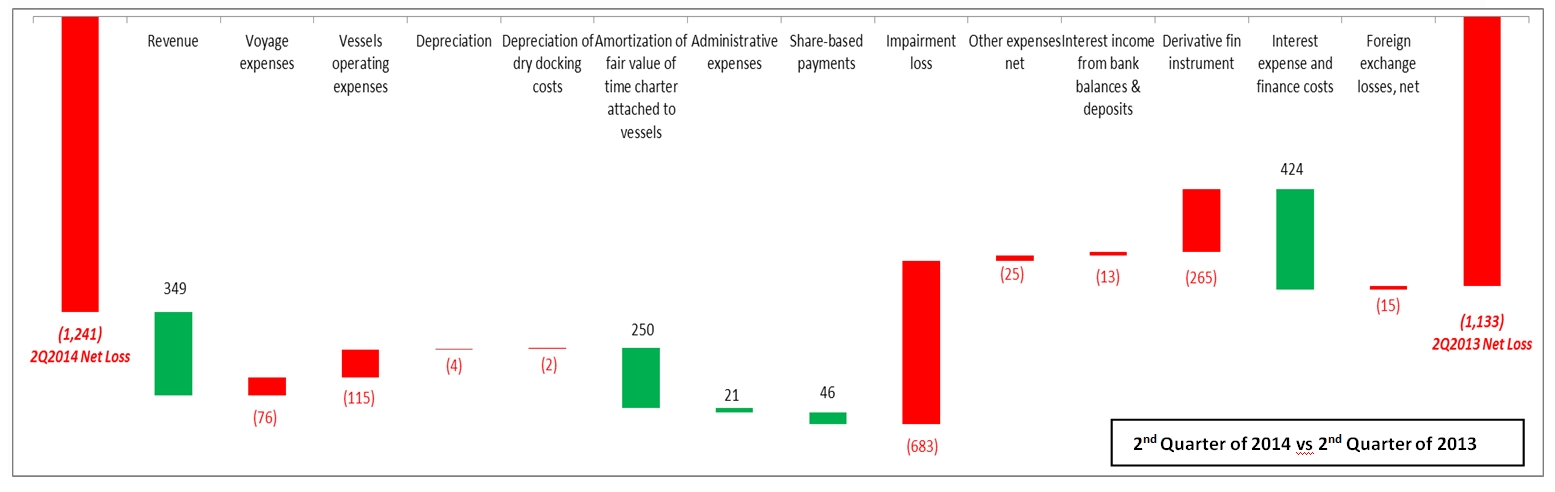
Second quarter of the year 2014 compared to the second quarter of the year 2013
Total comprehensive loss for the second quarter of the year 2014 amounted to $1.2 million or $0.14 basic loss per share based on 10,232,076 weighted average number of shares. If adjusted for the $1.7 million impairment loss, total adjusted comprehensive income for the period becomes $0.5 million or $0.02 basic earnings per share.
Total comprehensive loss for the second quarter of the year 2013 amounted to $1.1 million or $0.13 basic loss per share based on 10,213,475 weighted average number of shares. If adjusted for the $1.0 million impairment loss, total adjusted comprehensive loss for the period becomes $0.1 million or $0.03 basic loss per share.
During the second quarters of 2014 and 2013 we declared a preferred dividend of $86.54 per share and $63.46 per share respectively to the holders of our Series A Preferred Shares, paid during May 2014 and July 2013 respectively. There are 2,567 Series A Preferred Shares issued and outstanding as of today.
Revenue
During the three month periods ended June 30, 2014 and 2013 our Revenue reached $7.2 million and $6.8 million respectively. The 6% increase in Revenue was mainly attributed to the 4% increase in operating days from 593 during the second quarter of 2013 to 619 days during the quarter under discussion.
Voyage expenses
Voyage expenses increased by $0.1 million to $1.1 million during the three month period ended June 30, 2014 from $1.0 million during the respective period in 2013. Voyage expenses during both quarters included approximately $0.7 million, attributed to the cost of bunkers consumed during periods that our vessels were travelling seeking employment. As a consequence our time charter equivalent rates during the second quarter of 2014 and 2013 were $9,189 per vessel per day and $8,838 per vessel per day respectively corresponding to an increase of 4%, in line with the increase in our revenue as discussed above.
Vessel operating expenses
Vessel operating expenses, which include crew costs, provisions, deck and engine stores, lubricating oils, insurance, maintenance, and repairs, increased by $0.1 million or 4% to $2.7 million during the three month period ended June 30, 2014 compared to $2.6 million during the three month period ended June 30, 2013. It is important to note that longer periods of time are more accurate in basing conclusions on, rather than on a quarter over quarter basis. The breakdown of our operating expenses for the quarters ended June 30, 2014 and 2013 was as follows:
| 2014 | 2013 | |||||||
| Crew expenses | 51 | % | 49 | % | ||||
| Repairs and spares | 18 | % | 22 | % | ||||
| Insurance | 12 | % | 9 | % | ||||
| Stores | 11 | % | 11 | % | ||||
| Lubricants | 6 | % | 7 | % | ||||
| Other | 2 | % | 2 | % |
Average daily operating expenses during the three month periods ended June 30, 2014 and 2013 were $5,002 per vessel per day and $4,791 per vessel per day respectively.
Amortization of fair value of time charter attached to vessels
Amortization of fair value of time charter attached to vessels during the three month periods ended June 30, 2014 and 2013 were $0.2 and $0.4 million respectively. Amortization refers to the fair value of above market time charters attached to the vessels m/v Moon Globe and m/v Sun Globe acquired during the second half of 2011, which is amortized on a straight line basis over the remaining period of the time charters. The time charter attached to m/v Moon Globe expired during June 2013.
Impairment loss
During the second quarter of 2014 we recognized an impairment loss of $1.7 million corresponding to the change in the fair value less cost to sell of the vessel Tiara Globe, which is classified as vessel held for sale since December 2012. During the second quarter of 2013 we recognized and impairment loss of $1.0 million with respect to the aforementioned vessel which had its Special Survey during that period, amounting to $0.8 million while its fair value less cost to sell as of June 30, 2013 decreased by $0.2 million.
Gain on derivative financial instruments
Gain or loss on derivative financial instruments referred to the changes on the fair market value of our interest swap agreements the valuation of which was affected by the prevailing interest rates at that time. Both our interest rate swap agreements entered back in 2008 of a total notional amount of $25.0 million, reached their maturity during November 2013. During the last three years of the swap period we were swapping six month Libor for a fixed rate of 3.60% on a notional amount of $10.0 million and three month Libor for a fixed rate of 3.64% on a notional amount of $15.0 million.
Interest expense and finance costs
Interest expense and finance costs decreased by $0.4 million to $0.5 million during the second quarter of 2014 from $0.9 million during the respective period last year, mainly due to the termination of both our five year swap agreements during November 2013 and the sharp decrease in our average debt outstanding during the second quarter of 2014 of $87.2 million compared to the average debt outstanding during the second quarter of 2013 of $100.0 million. The weighted average interest rate during the second quarter of 2014 reached 2.02% compared to 3.33% during the same period last year including the effect from our interest rate swap agreements in effect at that time.
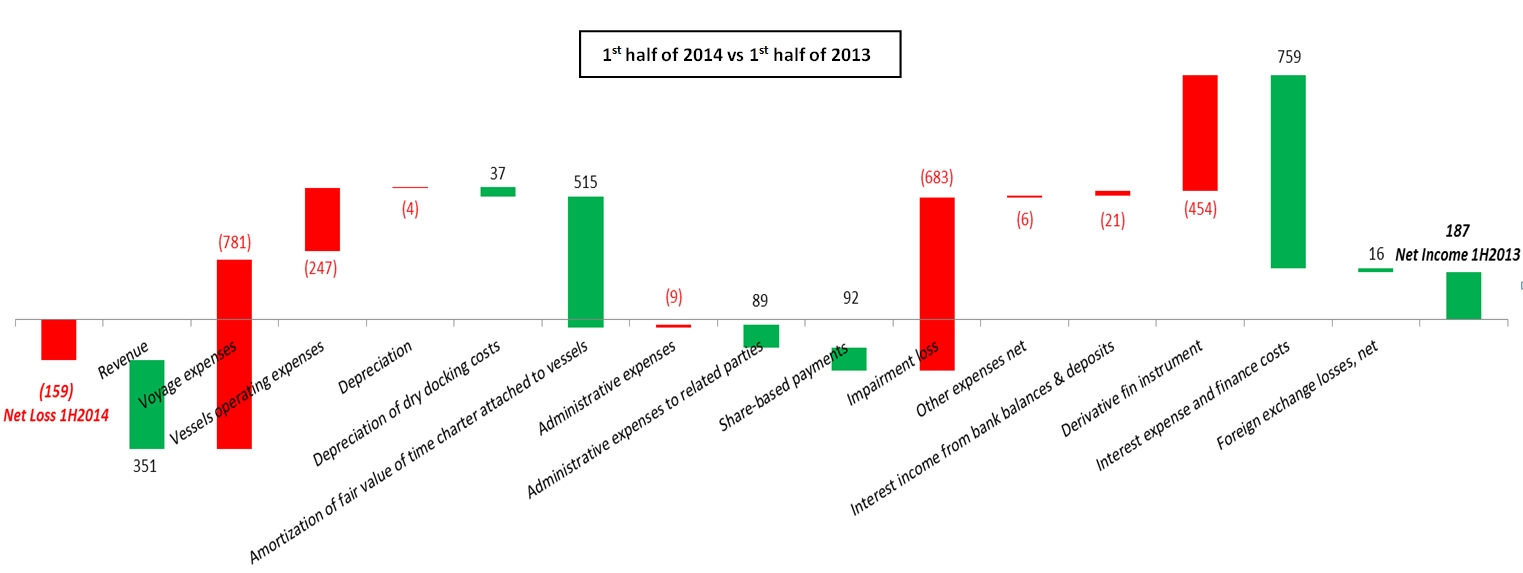
First half of the year 2014 compared to the first half of the year 2013
Total comprehensive loss for the first half of the year 2014 amounted to $0.2 million or $0.04 basic loss per share based on 10,230,117 weighted average number of shares. If adjusted for the $1.7 million impairment loss, total adjusted comprehensive income for the period becomes $1.6 million or $0.13 basic earnings per share.
Total comprehensive income for the first half of the year 2013 amounted to $0.2 million or approximately $nil basic earnings per share based on 10,210,994 weighted average number of shares. If adjusted for the $1.0 million impairment loss recognized during June 2013, total adjusted comprehensive income for the period becomes $1.2 million or $0.10 basic earnings per share.
Revenue
For the six month periods ended June 30, 2014 and 2013 our Revenue reached $14.6 million and $14.3 million respectively. The 2% increase in Revenue was mainly attributed to the 2% increase in operating days from 1,220 during the first half of 2013 to 1,248 days during the first half of 2014.
Voyage expenses
Voyage expenses increased by $0.8 million to $2.3 million during the six month period ended June 30, 2014 from $1.5 million during the respective period in 2013. Voyage expenses during the first half of 2014 included $1.4 million, attributed to the cost of bunkers consumed during periods that our vessels were travelling seeking employment compared to $0.8 million during the respective period last year. As a consequence our time charter equivalent rates during the first half of 2014 and 2013 were $9,218 per vessel per day and $9,712 per vessel per day respectively, corresponding to a decrease of 5%.
Vessel operating expenses
Vessel operating expenses, which include crew costs, provisions, deck and engine stores, lubricating oils, insurance, maintenance, and repairs, increased by $0.3 million or 6% to $5.0 million during the six month period ended June 30, 2014 compared to $4.7 million during the six month period ended June 30, 2013. The breakdown of our operating expenses for the six month periods ended June 30, 2014 and 2013 was as follows:
| 2014 | 2013 | |||||
| Crew expenses | 54% | 53% | ||||
| Repairs and spares | 16% | 18% | ||||
| Insurance | 12% | 10% | ||||
| Stores | 10% | 8% | ||||
| Lubricants | 6% | 8% | ||||
| Other | 2% | 2% |
Average daily operating expenses during the six month periods ended June 30, 2014 and 2013 were $4,561 per vessel per day and $4,333 per vessel per day respectively. Average daily operating expenses for the years (twelve month periods) ended June 30, 2014 and 2013 were $4,693 per vessel per day and $4,652 per vessel per day respectively.
Amortization of fair value of time charter attached to vessels
Amortization of fair value of time charter attached to vessels during the six month periods ended June 30, 2014 and 2013 were $0.4 and $0.9 million respectively. Amortization refers to the fair value of above market time charters attached to the vessels m/v Moon Globe and m/v Sun Globe acquired during the second half of 2011, which is amortized on a straight line basis over the remaining period of the time charters. The time charter attached to m/v Moon Globe expired during June 2013.
Impairment loss
During the first half of 2014 we recognized an impairment loss of $1.7 million corresponding to the change in the fair market value less cost to sell of the vessel Tiara Globe which is classified as vessel held for sale since December 2012. During the first half of 2013 we recognized and impairment loss of $1.0 million with respect to the aforementioned vessel which had its Special Survey during that period amounting to $0.8 million, while its fair value less cost to sell as of June 30, 2013 decreased by $0.2 million.
Gain on derivative financial instruments
Gain or loss on derivative financial instruments referred to the changes on the fair market value of our interest swap agreements the valuation of which was affected by the prevailing interest rates at that time. Both our interest rate swap agreements entered back in 2008 of a total notional amount of $25.0 million, reached their maturity during November 2013. During the last three years of the swap period we were swapping six month Libor for a fixed rate of 3.60% on a notional amount of $10.0 million and three month Libor for a fixed rate of 3.64% on a notional amount of $15.0 million.
Interest expense and finance costs
Interest expense and finance costs decreased by $0.8 million to $1.1 million during the first half of 2014 from $1.9 million during the respective period last year mainly due to the termination of both our five year swap agreements during November 2013 and the sharp decrease in our average debt outstanding during the first half of 2014 of $88.4 million compared to the average debt outstanding during the first half of 2013 of $100.8 million. The weighted average interest rate during the first half of 2014 reached 2.29% compared to 3.35% during the same period last year including the effect from our interest rate swap agreements in effect at that time.
Liquidity and capital resources
Net cash generated from operating activities for the three month periods ended June 30, 2014 and 2013 was $4.5 million and $3.2 million, respectively.
Net cash used in financing activities during the three month period ended June 30, 2014 amounted to $5.9 million and consisted of $5.4 million of scheduled loan installments, $0.5 million of interest and other finance costs paid, $0.2 million of preferred dividend paid less $0.2 million net proceeds drawn from our Firment credit facility. Net cash used in financing activities during the three month period ended June 30, 2013 amounted to $9.8 million and consisted of $8.8 million of debt repayment and $1.0 million of interest and other finance costs paid.
Net cash generated from operating activities for the six month periods ended June 30, 2014 and 2013 was $7.3 million and $6.5 million, respectively.
Net cash used in financing activities during the six month period ended June 30, 2014 amounted to $7.5 million and consisted of $6.2 million of scheduled loan installments, $1.1 million of interest and other finance costs paid, $0.4 million of preferred dividend paid less $0.2 million net proceeds drawn from our Firment credit facility. Net cash used in financing activities during the six month period ended June 30, 2013 amounted to $12.0 million and consisted of $10.2 million of debt repayment, and $1.8 million of interest and other finance costs paid.
Amendment to the Credit Suisse revolving credit facility
During April 2014, the company reached an agreement with Credit Suisse on permanently revising certain terms of our credit facility as listed below:
- The company to maintain cash and cash equivalents of not less than $5.0 million (instead of at least $10.0 million "minimum liquidity requirement") conditional to the company not declaring and paying dividends to common shareholders. In the event of dividend payment, the minimum liquidity requirement will increase to $7.0 million and will have to be met prior to the subject payment and during a continuous period of at least three months following such payment. Past this minimum period, we are entitled to switch to the $5.0 million minimum liquidity requirement.
- From March 31, 2014 onwards the facility to bear interest at LIBOR plus a margin of 1.20%.
- The company is prohibited from paying dividends to the holders of Series A preferred shares in an amount that will exceed $0.5 million per fiscal year when the liquidity is below the $7.0 million threshold.
Reduction in the minimum liquidity requirement from DVB Bank
During the second quarter of 2014, DVB Bank agreed to temporarily reduce its minimum liquidity requirement to $5.0 million (instead of the lesser of $10.0 million and $1.0 million per vessel owned by Globus) valid until December 31, 2014 subject to the company not declaring and paying dividends to common shareholders.
As of June 30, 2014, our cash and bank balances and bank deposits were $5.7 million and we had available $1.8 million of undrawn committed borrowing facility with respect to the Firment Credit Facility agreement. Our outstanding debt was $85.5 million gross of unamortized debt discount.
As of June 30, 2014 we were in compliance with all covenants arising from our loan and credit facilities.
Major vessel repairs
We anticipate one vessel namely m/v Sky Globe to be dry-docked during the second half of the year 2014. We budget 20 days per dry-docking per vessel. Actual length varies based on the condition of each vessel, shipyard schedules and other factors.
Conference Call and Webcast: The Company's management team will host a conference call and simultaneous internet webcast to discuss these results tomorrow, Thursday, September 11, 2014 at 9:30 a.m., Eastern Time.
Conference Call Details: Investors may access the webcast by visiting the Company's website at www.globusmaritime.gr and clicking on the webcast link. Participants may also dial into the call 10 minutes prior to the scheduled time using the following numbers: 1-866-819-7111 (from the US), 0800-953-0329 (from the UK), 00800-4413-1378 (from Greece), or +44 (0) 1452-542-301 (all other callers). Please quote "Globus Maritime."
A replay of the conference call will also be available until September 18, 2014 by dialing 1-866-247-4222 (from the US), 0800-953-1533 (from the UK), or +44(0)1452 550-000 (all other callers). Access Code: 36407079# In addition, a replay of the webcast will be available on the Company's website at www.globusmaritime.gr.
| SELECTED CONSOLIDATED FINANCIAL & OPERATING DATA | ||||||||||||
| Three months ended June 30, | Six months ended June 30, | |||||||||||
| 2014 | 2013 | 2014 | 2013 | |||||||||
| (in thousands of U.S. dollars, except per share data) | (Unaudited) | (Unaudited) | ||||||||||
| Statement of comprehensive (loss)/income data: | ||||||||||||
| Revenue | 7,198 | 6,849 | 14,607 | 14,256 | ||||||||
| Voyage expenses | (1,098 | ) | (1,022 | ) | (2,279 | ) | (1,498 | ) | ||||
| Net Revenue (1) | 6,100 | 5,827 | 12,328 | 12,758 | ||||||||
| Vessel operating expenses | (2,731 | ) | (2,616 | ) | (4,953 | ) | (4,706 | ) | ||||
| Depreciation | (1,408 | ) | (1,404 | ) | (2,813 | ) | (2,809 | ) | ||||
| Depreciation of dry docking costs | (117 | ) | (115 | ) | (209 | ) | (246 | ) | ||||
| Amortization of fair value of time charter attached to vessels | (186 | ) | (436 | ) | (370 | ) | (885 | ) | ||||
| Administrative expenses | (493 | ) | (514 | ) | (961 | ) | (952 | ) | ||||
| Administrative expenses payable to related parties | (134 | ) | (134 | ) | (263 | ) | (352 | ) | ||||
| Share-based payments | (15 | ) | (61 | ) | (30 | ) | (122 | ) | ||||
| Impairment loss | (1,714 | ) | (1,031 | ) | (1,714 | ) | (1,031 | ) | ||||
| Other expenses | (38 | ) | (13 | ) | (43 | ) | (37 | ) | ||||
| Operating (loss)/profit before financing activities | (736 | ) | (497 | ) | 972 | 1,618 | ||||||
| Interest income from bank balances & deposits | 2 | 15 | 7 | 28 | ||||||||
| Interest expense and finance costs | (511 | ) | (935 | ) | (1,134 | ) | (1,893 | ) | ||||
| Gain on derivative financial instruments | - | 265 | - | 454 | ||||||||
| Foreign exchange gains/( losses), net | 4 | 19 | (4 | ) | (20 | ) | ||||||
| Total finance costs, net | (505 | ) | (636 | ) | (1,131 | ) | (1,431 | ) | ||||
| Total comprehensive (loss)/ income for the period | (1,241 | ) | (1,133 | ) | (159 | ) | 187 | |||||
| Basic & diluted (loss)/earnings per share for the period | (0.14 | ) | (0.13 | ) | (0.04 | ) | 0.00 | |||||
| Adjusted EBITDA (2) | 2,689 | 2,489 | 6,078 | 6,589 | ||||||||
(1) Net Revenue is computed by subtracting voyage expenses from revenue. Net Revenue is not a recognized measurement under international financial reporting standards ("IFRS") and should not be considered as an alternative or comparable to net income.
(2) Adjusted EBITDA represents net earnings before interest and finance costs net, gains or losses from the change in fair value of derivative financial instruments, foreign exchange gains or losses, income taxes, depreciation, depreciation of dry-docking costs, amortization of fair value of time charter acquired, impairment and gains or losses on sale of vessels. Adjusted EBITDA does not represent and should not be considered as an alternative to total comprehensive income/(loss) or cash generated from operations, as determined by IFRS, and our calculation of Adjusted EBITDA may not be comparable to that reported by other companies. Adjusted EBITDA is not a recognized measurement under IFRS.
Adjusted EBITDA is included herein because it is a basis upon which we assess our financial performance and because we believe that it presents useful information to investors regarding a company's ability to service and/or incur indebtedness and it is frequently used by securities analysts, investors and other interested parties in the evaluation of companies in our industry.
Adjusted EBITDA has limitations as an analytical tool, and you should not consider it in isolation, or as a substitute for analysis of our results as reported under IFRS. Some of these limitations are:
- Adjusted EBITDA does not reflect our cash expenditures or future requirements for capital expenditures or contractual commitments;
- Adjusted EBITDA does not reflect the interest expense or the cash requirements necessary to service interest or principal payments on our debt;
- Adjusted EBITDA does not reflect changes in or cash requirements for our working capital needs; and
- Other companies in our industry may calculate Adjusted EBITDA differently than we do, limiting its usefulness as a comparative measure.
Because of these limitations, Adjusted EBITDA should not be considered a measure of discretionary cash available to us to invest in the growth of our business.
The following table sets forth a reconciliation of Adjusted EBITDA to total comprehensive (loss)/income and net cash generated from operating activities for the periods presented:
| Three months ended June 30, | Six months ended June 30, | ||||||||||||
| 2014 | 2013 | 2014 | 2013 | ||||||||||
| (Expressed in thousands of U.S. dollars) | (Unaudited) | (Unaudited) | |||||||||||
| Total comprehensive (loss)/ income for the period | (1,241 | ) | (1,133 | ) | (159 | ) | 187 | ||||||
| Interest and finance costs, net | 509 | 920 | 1,127 | 1,865 | |||||||||
| Gain on derivative financial instruments | - | (265 | ) | - | (454 | ) | |||||||
| Foreign exchange (gains)/losses net, | (4 | ) | (19 | ) | 4 | 20 | |||||||
| Depreciation | 1,408 | 1,404 | 2,813 | 2,809 | |||||||||
| Depreciation of drydocking costs | 117 | 115 | 209 | 246 | |||||||||
| Amortization of fair value of time charter attached to vessels | 186 | 436 | 370 | 885 | |||||||||
| Impairment loss | 1,714 | 1,031 | 1,714 | 1,031 | |||||||||
| Adjusted EBITDA | 2,689 | 2,489 | 6,078 | 6,589 | |||||||||
| Share-based payments | 15 | 61 | 30 | 122 | |||||||||
| Payment of drydocking costs | (790 | ) | (837 | ) | (790 | ) | (841 | ) | |||||
| Net decrease/(increase) in operating assets | 1,296 | (93 | ) | 805 | 152 | ||||||||
| Net increase in operating liabilities | 1,271 | 1,555 | 1,172 | 537 | |||||||||
| Foreign exchange gains/(losses) net, not attributed to cash and cash equivalents | 4 | 2 | (2 | ) | (33 | ) | |||||||
| Net cash generated from operating activities | 4,485 | 3,177 | 7,293 | 6,526 | |||||||||
| Three months ended June 30, | Six months ended June 30, | ||||||||||||
| (Expressed in thousands of U.S. dollars) | 2014 | 2013 | 2014 | 2013 | |||||||||
| (Unaudited) | (Unaudited) | ||||||||||||
| Statement of cash flow data: | |||||||||||||
| Net cash generated from operating activities | 4,485 | 3,177 | 7,293 | 6,526 | |||||||||
| Net cash generated from/(used in) investing activities | 1 | (18 | ) | 1 | (6 | ) | |||||||
| Net cash used in financing activities | (5,903 | ) | (9,849 | ) | (7,495 | ) | (12,044 | ) | |||||
| (Expressed in thousands of U.S. Dollars) | As of June 30, | As of December 31, | ||
| 2014 | 2013 | |||
| (Unaudited) | ||||
| Consolidated condensed statement of financial position: | ||||
| Vessels, net | 130,993 | 133,577 | ||
| Other non-current assets | 117 | 130 | ||
| Total non-current assets | 131,110 | 133,707 | ||
| Cash and bank balances and bank deposits | 5,686 | 5,889 | ||
| Other current assets | 3,896 | 4,700 | ||
| Total current assets | 9,582 | 10,589 | ||
| Vessel classified as held for sale | 9,652 | 11,366 | ||
| 19,234 | 21,955 | |||
| Total assets | 150,344 | 155,662 | ||
| Total equity | 59,988 | 60,340 | ||
| Total debt net of unamortized debt discount | 85,249 | 91,210 | ||
| Other liabilities | 5,107 | 4,112 | ||
| Total liabilities | 90,356 | 95,322 | ||
| Total equity and liabilities | 150,344 | 155,662 | ||
| Three months ended June 30, | Six months ended June 30, | |||||||||||
| 2014 | 2013 | 2014 | 2013 | |||||||||
| Ownership days (1) | 637 | 637 | 1,267 | 1,267 | ||||||||
| Available days (2) | 619 | 609 | 1,249 | 1,239 | ||||||||
| Operating days (3) | 619 | 593 | 1,248 | 1,220 | ||||||||
| Bareboat charter days (4) | 91 | 91 | 181 | 181 | ||||||||
| Fleet utilization (5) | 100.0 | % | 97.4 | % | 99.9 | % | 98.5 | % | ||||
| Average number of vessels (6) | 7.0 | 7.0 | 7.0 | 7.0 | ||||||||
| Daily time charter equivalent (TCE) rate (7) | 9,189 | 8,838 | 9,218 | 9,712 | ||||||||
| Daily operating expenses (8) | 5,002 | 4,791 | 4,561 | 4,333 | ||||||||
| (1) | Ownership days are the aggregate number of days in a period during which each vessel in our fleet has been owned by us. |
| (2) | Available days are the number of ownership days less the aggregate number of days that our vessels are off-hire due to scheduled repairs or repairs under guarantee, vessel upgrades or special surveys. |
| (3) | Operating days are the number of available days less the aggregate number of days that the vessels are off-hire due to any reason, including unforeseen circumstances but excluding days during which vessels are seeking employment. |
| (4) | Bareboat charter days are the aggregate number of days during which the vessels in our fleet are subject to a bareboat charter. |
| (5) | We calculate fleet utilization by dividing the number of operating days during a period by the number of available days during the period. |
| (6) | Average number of vessels is measured by the sum of the number of days each vessel was part of our fleet during a relevant period divided by the number of calendar days in such period. |
| (7) | TCE rates are our revenue less net revenue from our bareboat charters less voyage expenses during a period divided by the number of our available days during the period excluding bareboat charter days, which is consistent with industry standards. TCE is a measure not in accordance with GAAP. |
| (8) | We calculate daily vessel operating expenses by dividing vessel operating expenses by ownership days for the relevant time period excluding bareboat charter days. |
The following table reflects the calculation of our daily TCE rates for the periods presented.
| (Expressed in thousands of U.S. dollars, except number of days and TCE rates) | Three months ended June 30, | Six months ended June 30, | ||||||
| 2014 | 2013 | 2014 | 2013 | |||||
| Revenue | 7,198 | 6,849 | 14,607 | 14,256 | ||||
| Less: Voyage expenses | 1,098 | 1,022 | 2,279 | 1,498 | ||||
| Less: bareboat charter revenue net of commissions | 1,248 | 1,249 | 2,483 | 2,483 | ||||
| Net revenue excluding bareboat charter revenue | 4,852 | 4,578 | 9,845 | 10,275 | ||||
| Available days net of bareboat charter days | 528 | 518 | 1,068 | 1,058 | ||||
| Daily TCE rate | 9,189 | 8,838 | 9,218 | 9,712 | ||||
About Globus Maritime Limited
Globus is an integrated dry bulk shipping company that provides marine transportation services worldwide and presently owns, operates and manages a fleet of dry bulk vessels that transport iron ore, coal, grain, steel products, cement, alumina and other dry bulk cargoes internationally. Globus' subsidiaries own and operate seven vessels with a total carrying capacity of 452,886 Dwt and a weighted average age of 7.6 years as of June 30, 2014.
Safe Harbor Statement
This communication contains "forward-looking statements" as defined under U.S. federal securities laws. Forward-looking statements provide the Company's current expectations or forecasts of future events. Forward-looking statements include statements about the Company's expectations, beliefs, plans, objectives, intentions, assumptions and other statements that are not historical facts or that are not present facts or conditions. Words or phrases such as "anticipate," "believe," "continue," "estimate," "expect," "intend," "may," "ongoing," "plan," "potential," "predict," "project," "will" or similar words or phrases, or the negatives of those words or phrases, may identify forward-looking statements, but the absence of these words does not necessarily mean that a statement is not forward-looking. Forward-looking statements are subject to known and unknown risks and uncertainties and are based on potentially inaccurate assumptions that could cause actual results to differ materially from those expected or implied by the forward-looking statements. The Company's actual results could differ materially from those anticipated in forward-looking statements for many reasons specifically as described in the Company's filings with the Securities and Exchange Commission. Accordingly, you should not unduly rely on these forward-looking statements, which speak only as of the date of this communication. Globus undertakes no obligation to publicly revise any forward-looking statement to reflect circumstances or events after the date of this communication or to reflect the occurrence of unanticipated events. You should, however, review the factors and risks Globus describes in the reports it will file from time to time with the Securities and Exchange Commission after the date of this communication.
Contact Information:
For further information please contact:
Globus Maritime Limited
George Karageorgiou
CEO
+30 210 960 8300
karageorgiou@globusmaritime.gr
Capital Link - New York
Nicolas Bornozis
Paul Lampoutis
+1 212 661 7566
globus@capitallink.com