TRUCKEE, CA--(Marketwire - November 9, 2010) - Clear Capital (www.clearcapital.com) today released its monthly Home Data Index™ (HDI) Market Report, taking the most current (through October 2010) and granular (sub-ZIP code) look at how local markets performed compared to the national downward trend in home prices.
Insight into local market pricing dynamics is critical to understanding the local markets and quantifying home price risk. Quarter-over-quarter price changes at the national level (currently -5.0%) provide a broad alert that risks may or may not be increasing. Prices vary the more granular you get, with individual micro markets frequently performing much better/worse than their greater metro area, giving credence to the old adage that real estate is local.
Report highlights include:
- Micro Market Analysis: The Washington, D.C. MSA bucked negative national home price trends, posting positive quarterly and yearly price changes.
- Metropolitan Statistical Area (MSA) drilldown: Local markets exhibited wildly differing sensitivities to the current housing climate: some in the South and Midwest regions are in double-dip territory, while bright spots emerge on the East Coast.
- National/Four Region Overview: National home prices have changed -5.0% quarter-over-quarter. In fact, looking at national home prices since their mid-August peak, price declines are even more dramatic, changing -6.8%.
- Home prices as a nation remain 7.7% above their 2009 lows, but six of the largest local markets are presently experiencing a home pricing double dip (defined as prices dropping below their record lows experienced at the worst of the housing market crash).
"Although nationally, price trends are showing significant decreases, it is critical for policy makers, investors, and other users of home price data to understand that price dynamics at local levels differ significantly from the macro trends," said Dr. Alex Villacorta, Senior Statistician, Clear Capital. "Our Home Data Index is unique in its ability to provide timely insight across price tiers -- at both national and local levels."
"For example, all six major metropolitan areas in California are out-performing both national and West region numbers in terms of yearly gains," added Villacorta. "Conversely, four of the top markets in Florida are either in or very near double-dip territory, even though national prices remain nearly eight percent above 2009 lows. So, while national home price trends gauge overall home price movement, regional, metro and local housing markets will continue to respond differently to distressed inventories and national policy."
Micro Market Analysis (Oct. 2007 - Oct. 2010)
This section highlights a single market every month with a deeper dive into how the micro- and macro-markets relate to each other, providing additional sub-ZIP code, census-tract-level data.
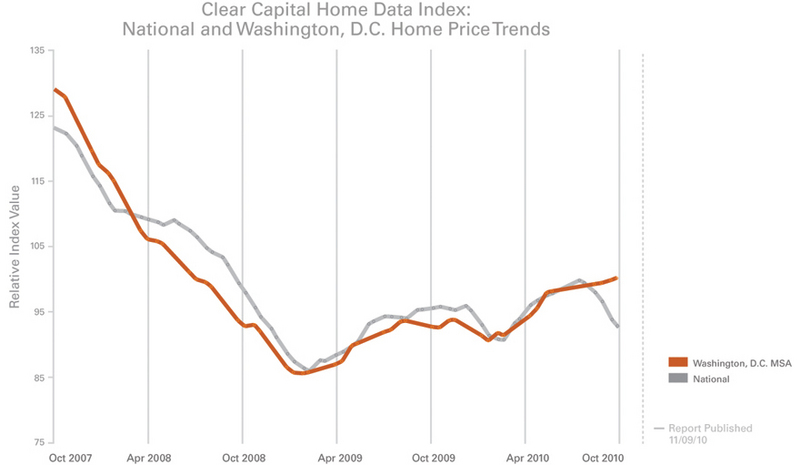
Looking Local: The District Ignores Recent National Home Price Declines
- The Washington, D.C. MSA posts 2.0% quarterly and 6.7% yearly price changes, respectively.
- Despite the District's yearly price gains, 26% of the census tracts (groups of around 1,500 homes) experienced yearly price declines.
- The variability of Washington, D.C. home prices is a great example of why it's critical to gain insight into local pricing.
Regional, metro and even local housing markets respond differently to various economic conditions --and should be scrutinized carefully. Over the past three years, Washington, D.C. has tracked closely with the national home pricing trend, matching the price troughs in early 2008 and 2009. However, historical agreement doesn't necessarily assure similar direction or timing going forward. The District's 2.0 percent quarterly price change has extended by more than two months beyond the national trend where prices have fallen.
For additional local perspective of the Washington, D.C. market, Clear Capital turned to experienced members of the company's well-trained, on-the-ground national network of more than 40,000 real estate professionals. Clear Capital partners with this network daily to perform thousands of residential property valuations including appraisals, appraisal reviews and broker price opinions.
"The greater Washington, D.C. market might be doing better than the rest of the country because of its proximity of the federal government, and the solid job base for companies doing business for the government," said Ben Puchalski, real estate sales agent from Washington, D.C. "The tax credit definitely eliminated some of the inventory problems in D.C., but we've seen a slow down since it ended."
REO saturation rates in the District have revealed an inverted trend to home prices, with peaks in REO saturation found at each of the District's price troughs. More recently, as REO saturation in the District continues to fall, prices in the District have risen.
Within the Washington, D.C. MSA, which overall has seen prices rise 6.7 percent for the year, we find 26 percent of the census tracts (groups of around 1,500 homes) experiencing yearly price declines. On the positive end of the scale, 41 percent of the census tracts have experienced quarterly prices increases greater than the MSA's 2.0 percent change.
This variability within each market is a great example of why it's critical to understand prices at the local level. In Washington, D.C. more areas have indeed been affected by the current slowdown, but a majority of the micro markets are still showing strong yearly gains. It's very unlikely the District will continue to post positive gains going forward; however, it continues to demonstrate a resilience to price declines.
Metro Markets (Oct. 2009 - Oct. 2010)
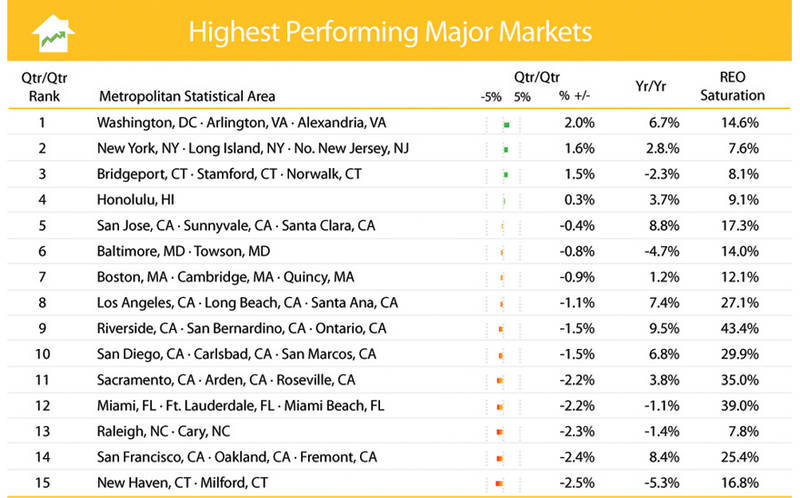
Select Local Markets Say "No" to Price Declines, For Now
- Washington, D.C. and New York stand out with both quarterly and yearly price gains.
- Western markets of Honolulu, Hawaii, and the California markets of San Jose, Los Angeles, Riverside, San Diego, Sacramento, and San Francisco maintain their yearly price gains by solid margins.
Contrary to the national downward trend for home prices, two-thirds of this month's highest performing markets remained in positive year-over-year territory. This trend is an example of how important it is to receive and inspect local market information, and not just rely on national and regional level information.
In addition to the employment centers of Washington, D.C. and New York City, local markets out West show the benefit of last year's steady demand in the distressed segment, maintaining average positive yearly gains of 6.9 percent. The South region was also represented by the coastal markets of Baltimore, Md., Miami, Fla. and Raleigh N.C. No Midwestern markets made this month's highest performing markets list.
While the effect of deteriorating conditions was evident with both quarterly and yearly measures slowing across all markets, the performance of these markets remain well above the national average. The top four markets on the list avoided quarterly price declines altogether, and even New Haven, Conn. (no. 15 on the list), experienced only a price change of -2.5 percent (half the national rate of decline) for the quarter.
Lowest Performing Localities Doubling Down
- The markets in New Orleans, La., Columbus and Dayton Ohio, and Atlanta, Ga. are experiencing quarterly declines more than double the national rate.
- REO saturation rates spiked sharply in a handful of local markets, a contrast to the more muted national uptick.
Similar to the highest performing major markets, local prices in the lowest performing markets differ greatly from the national numbers and sometimes their own region -- telling an even grimmer tale of home price declines. These markets have proven more sensitive to the current market forces; with several markets experiencing quarterly declines more than double the national rate. Many consist of lower-priced markets that reacted positively to the tax credits of the last eighteen months, and are now giving back the short term gains, and then some.
While regional trends do provide a broad measure of the market, exceptions are the norm. Phoenix, Ariz., for example, saw a return to price declines in excess of the national and regional quarterly benchmarks. Prices in Phoenix dropped 6.1 percent for the quarter, and 1.3 percent for the year. Milwaukee, Wis., Tucson, Ariz., Birmingham, Ala., and Minneapolis, Minn. also saw REO saturation rates increase by more than three percentage points. Of these four markets, all but Minneapolis saw price declines in both quarterly and yearly measures.
National/Four Region Market Overview (Oct. 2009 - Oct. 2010)
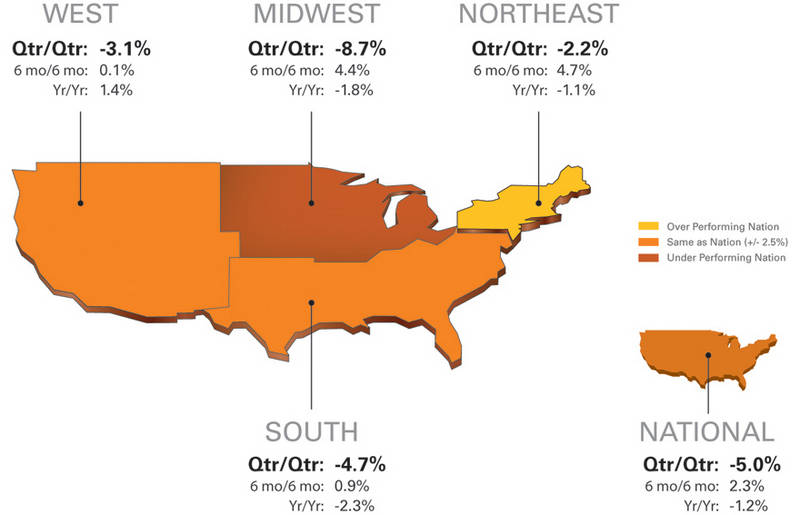
U.S. Home Prices Continue to Fall Aggressively
- National home prices have changed -5.0% quarter-over-quarter. In fact, looking at national home prices since their mid-August peak, declines are even more dramatic, changing -6.8%.
- The West (-3.1%) and South (-4.7%) regions showed similar quarterly price changes as the national trend; though the western MSA of Honolulu, Hawaii (0.3%) over performed and southern MSAs in New Orleans (-15.8%) and Atlanta (-13.4%) turned in big declines.
- The Midwest region (-8.7%) underperformed the national quarterly trend, with Columbus (-13.7%) and Dayton, Ohio (-10.9%) leading the way with double-digit quarterly declines.
- The Northeast region (-2.2%) outperformed the national quarterly trend, with New York, N.Y. and Bridgeport, Conn. posting gains; though Providence, R.I. posted a nearly double-digit negative price change of -9.1%.
Looking closer at national quarterly pricing trends, 18 states have declines higher than five percent, while 29 states experienced quarterly price changes that outperformed the national mark. This is significant because even though a majority of the states outperform the nation, declines in those 18 states are so severe that it brings the overall market average down.
In contrast to the national price changes, local markets often tell a different story. When studied at a much more granular, local level, the view was not always bad; yet in select cases, much worse. Several of the larger markets in the West region continue to maintain positive yearly price gains well above the national average. Similarly, Northeastern economic centers have outperformed the national quarterly trend, managing to delay a return to quarterly declines. The lower cost areas of the Midwest have largely underperformed the national trend while the South is mixed, with both over-performing and under-performing markets. Given the local nature of real estate, these differences were not surprising.
Another example of how national numbers can differ from local markets is by looking at where we are as a nation related to facing a double dip in home prices (home prices that drop below their record lows at the worst of the housing market crash are considered to have "double dipped"). Although nationally, we remain 7.7 percent above double dip territory, six local markets are presently experiencing a double dip. Atlanta, Ga., Birmingham, Ala., Portland, Ore., Seattle, Wash., Tucson, Ariz., and Virginia Beach, Va. have all recently broken through for new home price lows. But those markets aren't the only ones suffering. Fourteen additional markets are within five percent of double dip lows; and another seven are within 10 percent of fresh lows.
About the Clear Capital Home Data Index (HDI) Market Report
The Clear Capital HDI Market Report has displayed consistent market trends as other leading indices (peak, trough, secondary trough and tax credit run-ups). Despite these consistencies, a critical difference is that HDI's methodology enables more timely and granular reporting. Clear Capital's ability to report today the significant drop in home prices, as well as the growing list of double dip markets, paints an ominous picture that will likely show up in other home data indices in the months to come.
The Clear Capital HDI Market Report:
- Offers the real estate industry (investors, lenders and servicers), government agencies and the public insight into the most recent pricing conditions, not only at the national and metropolitan level, but within local markets as well.
- Patent pending rolling quarter technology significantly reduces the multi-month lag time associated with other indices to help investors, loan servicers and individual buyers and sellers make more informed, timely and profitable decisions.
- Data is built on the most recent data available from recorder/assessor offices, and then further enhanced by adding the Company's proprietary market data for the most comprehensive geographic coverage and local insights available.
Clear Capital Home Data Index™ Methodology
- Generates the most timely indices in patent pending rolling quarter intervals that compare the most recent four months to the previous three months. The rolling quarters have no fixed start date and can be used to generate indices as data flows in, significantly reducing the multi-month lag time experienced with other indices.
- Includes both fair market and institutional (real estate owned) transactions, giving equal weight to all market transactions and identifying price tiers at a market specific level. By giving equal weight to all transactions, the HDI is truly representative of each unique market.
- An address-level cascade results in an index with the most granular, statistically significant market area available.
- Provides weighted repeat sales, and price-per-square-foot index models that use multiple sale types, including single-family homes, multi-family homes and condominiums.
About Clear Capital
Clear Capital (www.clearcapital.com) is a premium provider of data and solutions for real estate asset valuation and risk assessment for large financial services companies. Our products include appraisals, broker-price opinions, property condition inspections, value reconciliations, and home data indices. Clear Capital's combination of progressive technology, high caliber in-house staff and a well-trained network of more than 40,000 field experts sets a new standard for accurate, up-to-date and well documented valuation data and assessments. The Company's customers include 75 percent of the largest U.S. banks, investment firms and other financial organizations.
Legend
Address Level Cascade -- Provides the most granular market data available. From the subject property, progressively steps out from the smallest market to larger markets until data density and statistical confidence are sufficient to return a market trend.
Home Data Index (HDI) -- Powerful analytics tool that provides contextual data augmenting other, human-based valuation tools. Clear Capital's multi-model approach combines address-level accuracy with the most current proprietary home pricing data available.
Metropolitan Statistical Area (MSA) -- Geographic entities defined by the U.S. Office of Management and Budget (OMB) for use by Federal statistical agencies in collecting, tabulating, and publishing Federal statistics.
Repeat Sales Model -- Weighted linear model based on repeat sales of same property over time.
Price Per Square Foot (PPSF) Model -- Median price movement of sale prices divided by square footage over a period of time--most commonly a quarter.
Real Estate Owned (REO) Saturation -- Calculates the percentage of REOs sold as compared to all properties sold in the last rolling quarter.
Rolling Quarters -- Patent pending rolling quarters compare the most recent four months to the previous three months.
The information contained in this report is based on sources that are deemed to be reliable; however no representation or warranty is made as to the accuracy, completeness, or fitness for any particular purpose of any information contained herein. This report is not intended as investment advice, and should not be viewed as any guarantee of value, condition, or other attribute.
Contact Information:
Media Contact:
Michelle Sabolich
Atomic PR for Clear Capital
415.593.1400