VANCOUVER, BRITISH COLUMBIA--(Marketwire - April 2, 2012) - Oceanic Iron Ore Corp. (TSX VENTURE:FEO)(OTCQX:FEOVF) (the "Company", "Oceanic") has received the results of an updated resource estimate prepared by Micon International Limited ("Micon") under the direction of Eddy Canova, the Company's Director of Exploration and a Qualified Person, in respect of the Hopes Advance Project Area ("Hopes Advance").
In-Pit Mineral Resources:
- 1.268 billion tonnes of measured and indicated in-pit resource at 32.3 % total iron with a 38.7 % crude to concentrate weight recovery at a total iron cut-off of 25% increasing the resource by 250% above the November 2011 published resource
- 720.7 million tonnes of measured in-pit resource at 32.4 % total iron with a 38.8 % crude to concentrate weight recovery at a total iron cut-off of 25%
- 547.5 million tonnes of indicated in-pit resource at 32.3 % total iron with a 38.6 % crude to concentrate weight recovery at a total iron cut-off of 25%
- 193.4 million tonnes of inferred in-pit resource at 32.9 % total iron with a 38.8 % crude to concentrate weight recovery at a total iron cut-off of 25%
- Updated resource is based on 67 twinned and 43 exploration step - out holes drilled between March and October 2011
- Results from step-out holes suggest that mineralization extends in a number of deposit areas, in particular Castle Mountain, Iron Valley, and Bay Zone.
- Represents a substantial increase in volume and confidence in quality of Hopes Advance resource when compared to initial resource estimate published in November 2011
Steven Dean, Chairman and CEO added: "The updated in - pit resource estimate increases both the size and quality of the resource base at Hopes Advance and supports the case that the Company could produce the "optimal" case production of 20 million tonnes per annum over a mine life of almost 25 years as described in the Company's Preliminary Economic Assessment from November 2011*. With an updated measured and indicated in pit resource that has increased over 250% since the date of our original resource estimate, Hopes Advance would be ranked as one of the largest producers globally, not including both the potential to further extend the resource base in key deposits at Hopes Advance and further additional tonnage suggested through the historic resource work done in the Roberts Lake and Morgan Lake project areas."
* "Technical Report on the Mineral Resource Estimate and Results of the Preliminary Economic Assessment - Hopes Advance Bay Iron Deposits Ungava Bay Region, Quebec, Canada" dated November 4, 2011, available on SEDAR and on the Company's website, www.oceanicironore.com.
| Table 1 - Updated In-Pit Mineral Resource Estimate for Hopes Advance (at a 25% Fe cut-off) | |||
| Classification | Tonnes | Fe (%) |
Concentrate Tonnes |
| Measured | 720,765,000 | 32.4 | 279,806,000 |
| Indicated | 547,518,000 | 32.3 | 211,516,000 |
| M+I | 1,268,283,000 | 32.3 | 491,322,000 |
| Inferred | 193,403,000 | 32.9 | 75,112,000 |
| (1) | Mineral resources which are not mineral reserves do not have demonstrated economic viability. The estimate of mineral resources may be materially affected by environmental, permitting, legal, title, socio-political, marketing, or other relevant issues. | |
| (2) | The mineral resources presented here were estimated using a block model with parent blocks of 50 m by 50 m by 15 m sub-blocked to a minimum size of 25 m by 25 m by 1 m and using ID3 methods for grade estimation. A total of 10 individual mineralized areas were identified and each estimated into a separate block model. Given the continuity of the iron assay values, no top cuts were applied. All resources are reported using an iron cut-off of 25% within Whittle optimization pit shells and a mining recovery of 100%. | |
| (3) | The quantity and grade of reported inferred resources in this estimation are uncertain in nature and there has been insufficient exploration to define these inferred resources as an indicated or measured mineral resource and it is uncertain if further exploration will result in upgrading them to an indicated or measured mineral resource category. | |
| (4) | The mineral resources in this press release were estimated using the Canadian Institute of Mining, Metallurgy and Petroleum (CIM), CIM Standards on Mineral Resources and Reserves, Definitions and Guidelines prepared by the CIM Standing Committee on Reserve Definitions and adopted by CIM Council November 27, 2010. |
Resource Verification Fieldwork
The 2011 resource verification and drilling program at Hopes Advance consisted of 115 drill holes with 11,581 metres of NQ calibre drilling. 67 holes were twins of historic drill holes and 43 holes were exploration holes, which extended mineralization on Castle Mountain, West Zone, Iron Valley, and the Bay Zone. Based on the results from the exploration drilling, the Company believes there is potential to increase the resource base at Hopes Advance with additional exploration drilling at Castle Mountain, West Zone, and the Bay Zone. Airborne magnetics suggest additional drilling at Castle Mountain could extend mineralization 600 m to 1200 m to the northeast The Northwest Zone and Iron Plateau are currently untested.
Ore Characterization
Ore characterization tests were conducted by the Company in order to identify that part of the mineral resource that could provide sufficient weight recovery and iron recovery and produce concentrate with marketable characteristics. The results of the ore characterization testing were considered in the classification of material in the resource estimate.
Approximately 630 composite samples from all drill holes at Hopes Advance were analyzed by SGS Mineral Services, Lakefield, Ontario. The composites were analyzed using Mozley tables to simulate recovery by a gravity circuit followed by Davis tube tests to simulate recovery by low intensity magnet separators (LIMS) in a concentrating plant when sufficient magnetite was present in the Mozley table tails. The thoroughness of the metallurgical ore characterization has increased the Company's confidence in the classification of material in the resource estimate.
The Company expects to provide a detailed analysis of the results from the 630 composite samples in the coming weeks.
Updated Resource Estimate
Ten different mineralized areas were identified at Hopes Advance for inclusion into the updated resource estimate. These areas included Castle Mountain, the West Zone, Iron Valley, and the Bay Zone.
To view Figure 1 – Geological Map of Hopes Advance, visit the following link: http://media3.marketwire.com/docs/HAmap402.jpg
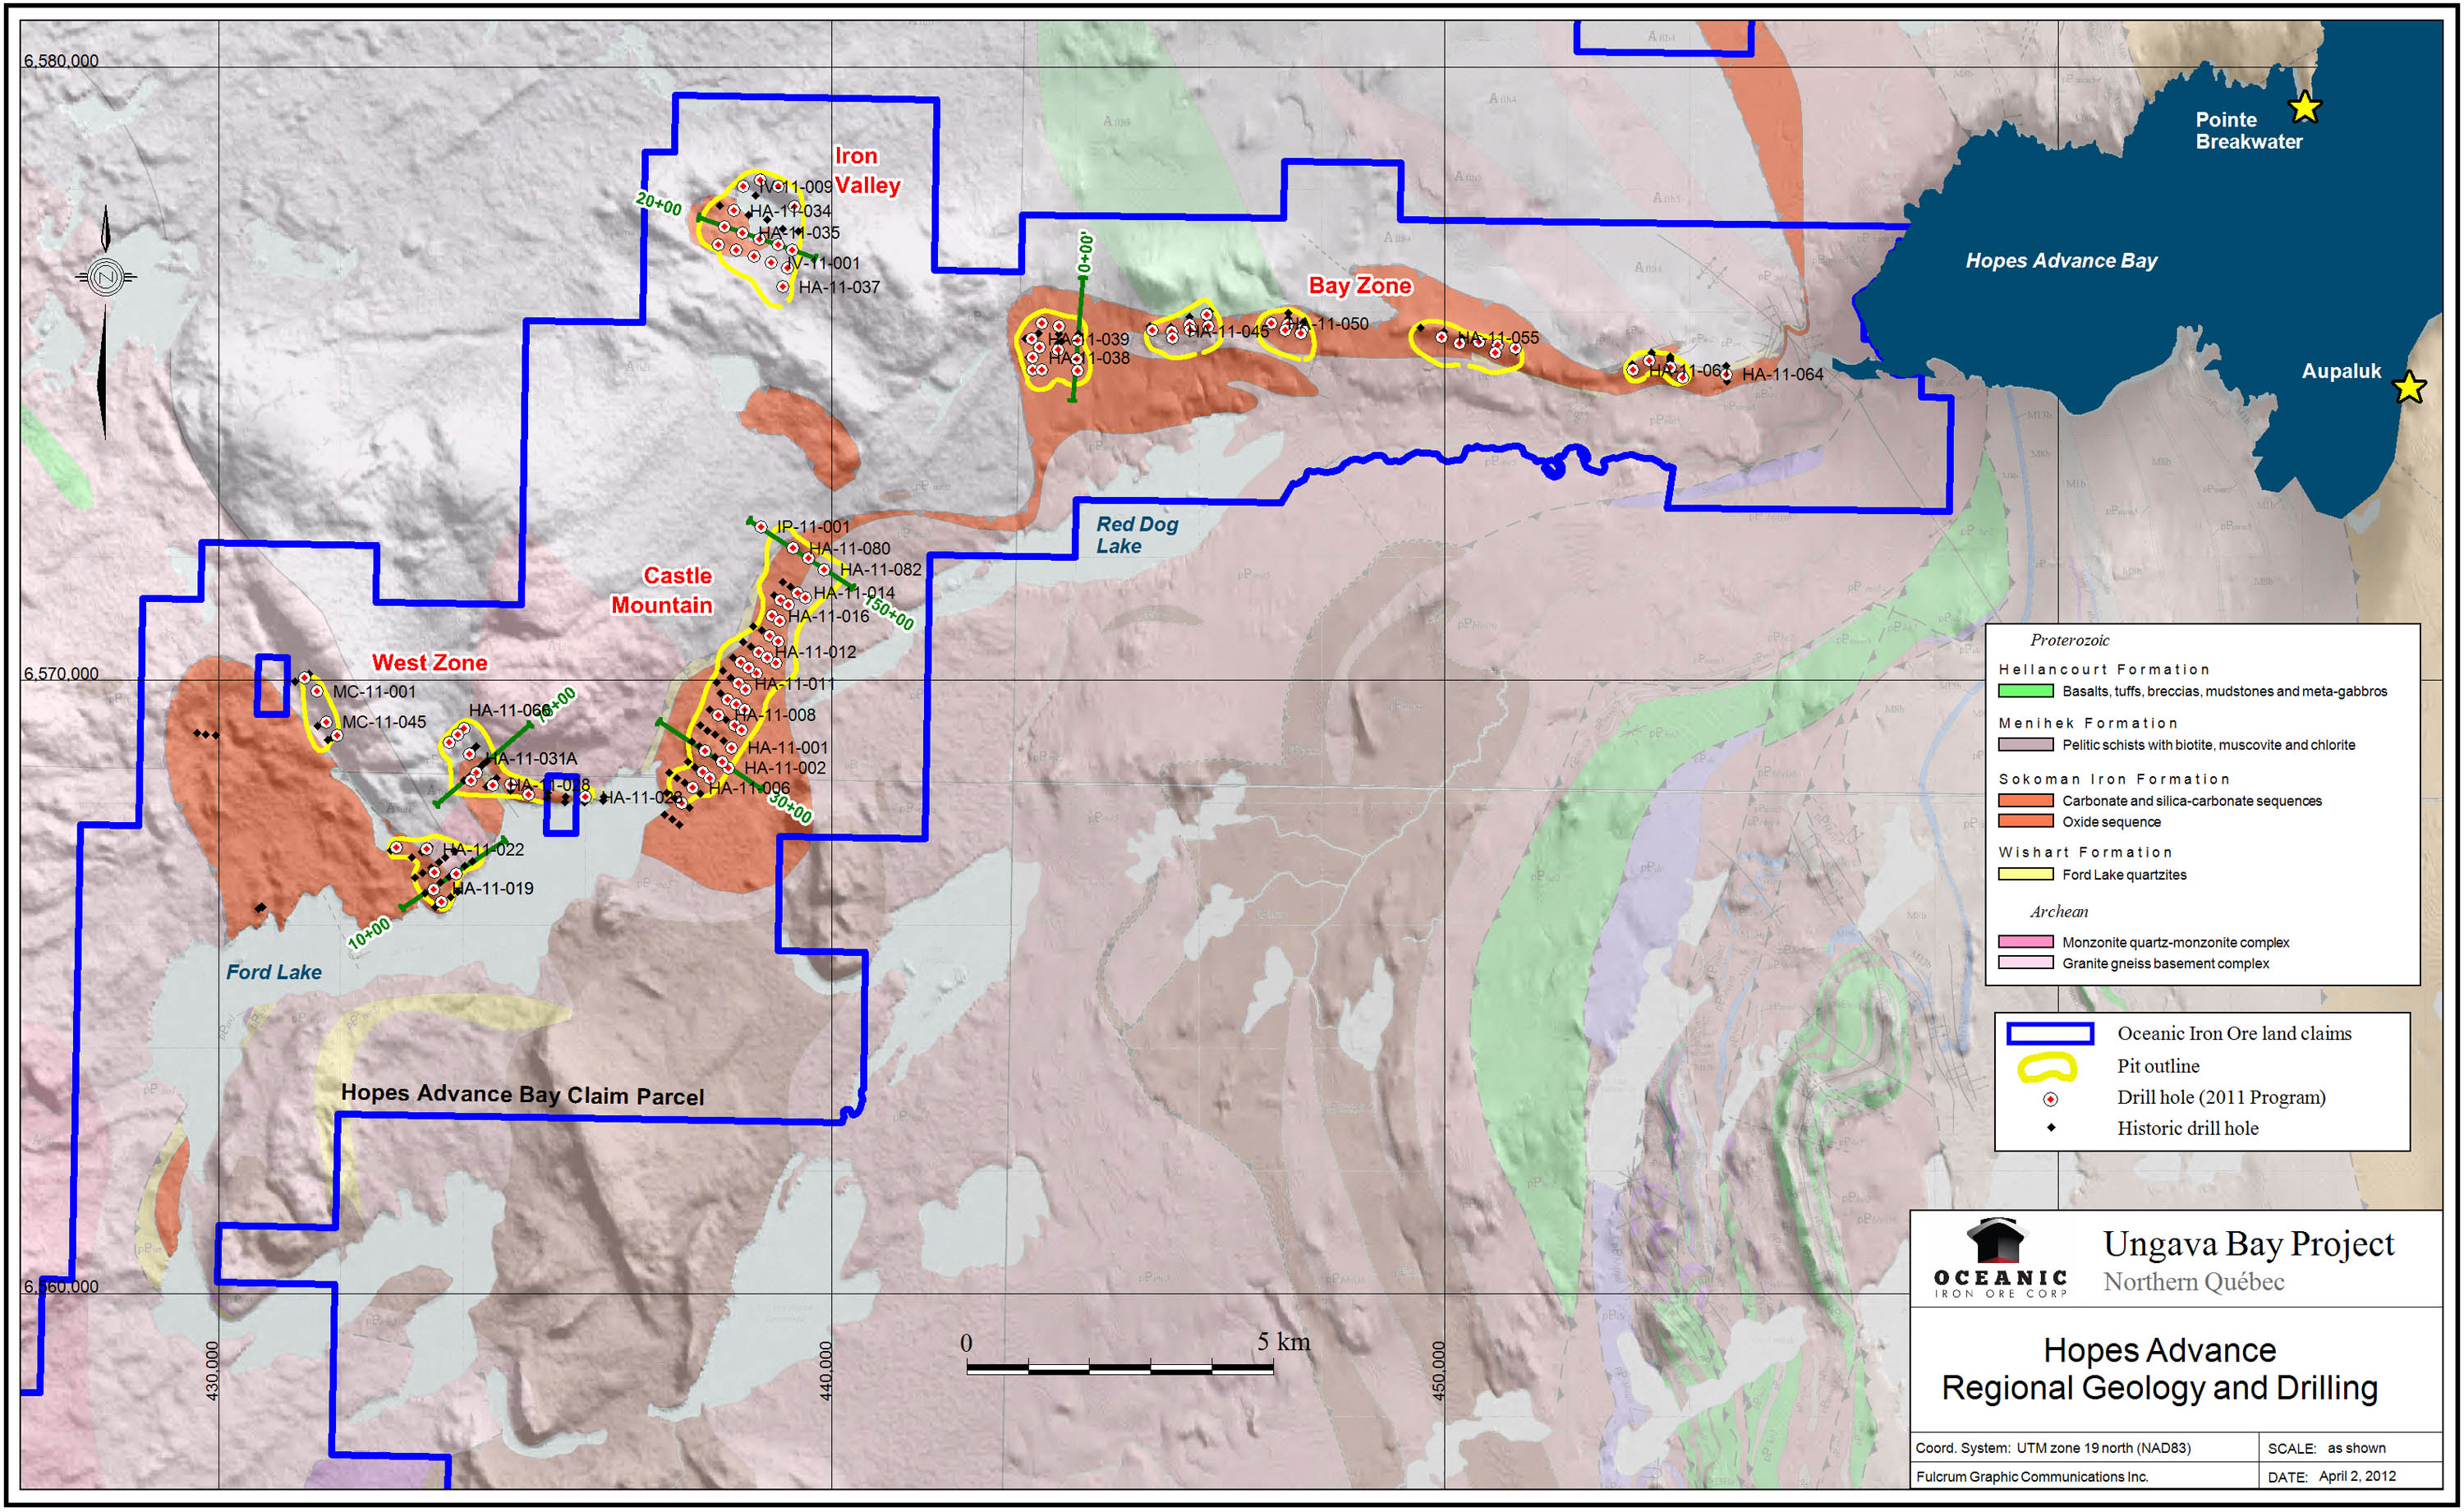
Table 2 below sets out the overall global mineral inventory comprising all material within the block model of each deposit above a cut-off grade of 25% iron, compared to the initial global mineral inventory disclosed in November 2011.
| Table 2 - Hopes Advance Global Mineral Inventory Comparison (at a 25% Fe cut-off) | ||||||
| Classification | April, 2012 | November, 2011 | ||||
| Tonnes | Fe (%) | Concentrate Tonnes | Tonnes | Fe (%) | Concentrate Tonnes | |
| Measured | 857,258,000 | 32.3 | 331,754,000 | - | - | - |
| Indicated | 724,707,000 | 32.1 | 278,473,000 | 461,533,000 | 32.0 | 177,541,000 |
| M+I | 1,581,965,000 | 32.2 | 610,227,000 | 461,533,000 | 32.0 | 177,541,000 |
| Inferred | 269,399,000 | 32.6 | 103,390,000 | 1,030,455,000 | 32.3 | 401,004,000 |
| (1) | The tonnes and grade presented above are global in nature and do not reflect conceptual open pit shells or detailed designs. |
A separate block model was developed for each mineralized area. Grades were estimated using inverse distance cubed interpolation. The resource model is stratigraphic in nature and during resource estimation an unfolding technique was used to ensure that iron grades tracked along the stratigraphy. Mozley table and Davis tube test results were used to predict weight recovery based on head iron for each deposit. Whittle pit shells were developed for each zone using the economic assumptions summarized below. The resulting pit shells for each zone were used to constrain the mineral resource estimate reported in Table 1. The overall strip ratio for this In-Pit resource is 0.86 to 1 and is based on the conceptual pit shells. Conceptual pit shells do not include designed ramps and berms. The iron formation out-crops in most areas and would allow mining to begin with very little stripping. Furthermore, the iron formation is shallowly dipping in most zones which would allow mining to continue with a relatively low stripping ratio. At Castle Mountain the shallowly dipping iron formation could be mined along strike over 4.5 km.
| Table 3 - Hopes Advance Whittle Economic Pit Optimization Assumptions | ||
| Item | Units | $ |
| Mining Cost | $/t all material | 2.71 |
| Process Cost | $/t resource | 14.87 |
| Pipeline | $/t product | 1.08 |
| Port | $/t product | 3.00 |
| Camp | $/t product | 1.50 |
| G&A | $/t product | 1.50 |
| Royalty | % | 2.0 |
| Concentrate Value | $/t product | 100 |
Table 4 provides a comparison of the updated resource estimate with the previous resource estimate, and shows an increase in measured and indicated resources. Higher confidence reflected in the resource is based on consistency of total Fe assay results and newly completed composite test work results for head iron and weight recovery. The overall measured and indicated in-pit resource reported in April 2012 has increased by 250% compared to what was previously reported in November 2011.
| Table 4 - Hopes Advance In-Pit Resource Comparison (at a 25% Fe cut-off) | ||||||
| Classification | April, 2012 | November, 2011 | ||||
| Tonnes | Fe (%) | Concentrate Tonnes | Tonnes | Fe (%) | Concentrate Tonnes | |
| Measured | 720,765,000 | 32.4 | 279,806,000 | - | - | - |
| Indicated | 547,518,000 | 32.3 | 211,516,000 | 358,362,000 | 31.8 | 136,894,000 |
| M+I | 1,268,283,000 | 32.3 | 491,322,000 | 358,362,000 | 31.8 | 136,894,000 |
| Inferred | 193,403,000 | 32.9 | 75,112,000 | 872,423,000 | 32.4 | 340,136,000 |
| (1) | Mineral resources which are not mineral reserves do not have demonstrated economic viability. The estimate of mineral resources may be materially affected by environmental, permitting, legal, title, socio-political, marketing, or other relevant issues. | |
| (2) | The mineral resources presented here were estimated using a block model with parent blocks of 50 m by 50 m by 15 m sub-blocked to a minimum size of 25 m by 25 m by 1 m and using ID3 methods for grade estimation. A total of 10 individual mineralized areas were identified and each estimated into a separate block model. Given the continuity of the iron assay values, no top cuts were applied. All resources are reported using an iron cut-off of 25% within Whittle optimization pit shells and a mining recovery of 100%. | |
| (3) | The quantity and grade of reported inferred resources in this estimation are uncertain in nature and there has been insufficient exploration to define these inferred resources as an indicated or measured mineral resource and it is uncertain if further exploration will result in upgrading them to an indicated or measured mineral resource category. | |
| (4) | The mineral resources in this press release were estimated using the Canadian Institute of Mining, Metallurgy and Petroleum (CIM), CIM Standards on Mineral Resources and Reserves, Definitions and Guidelines prepared by the CIM Standing Committee on Reserve Definitions and adopted by CIM Council November 27, 2010. |
Results from the updated resource estimate show that the current work has continued to expand the previously reported resource for each deposit, and the Company believes that further expansion is likely. This is primarily due to the fact that the Company has identified a number of instances where mineralization continues along the trough trend or down dip that were not considered economic in the historic resource estimates.
Resource Statement
The mineral resource estimates in this press release use the Canadian Institute of Mining, Metallurgy and Petroleum (CIM), Standards on Mineral Resources and Reserves, Definitions and Guidelines prepared by CIM Standing Committee on Reserve Definitions and adopted by CIM Council on November 27, 2010. The mineral resource estimates provided in this report are classified as "measured", "indicated", or "inferred" as defined by CIM.
According to the CIM definitions, a Mineral Resource must be potentially economic in that it must be "in such form and quantity and of such grade or quality that it has reasonable prospects for economic extraction". For the Hopes Advance iron deposit, an iron cut-off grade was assigned based on economic assumptions and metallurgical parameters and was used in the resource estimations. Resources reported in this press release use an estimated potential open pit iron cut-off of 25% total iron content.
Eddy Canova, P.Geo. (Q403), the Exploration Manager for the Company and a Qualified Person as defined by NI 43-101, has reviewed and is responsible for the technical information contained in this news release.
The complete report in respect of the updated resource estimate will be filed on SEDAR and on the Company's website within 45 days of this news release.
OCEANIC IRON ORE CORP. (www.oceanicironore.com)
On behalf of the Board of Directors
Steven Dean, Chairman and Chief Executive Officer
This news release includes certain "Forward-Looking Statements" as that term is used in applicable securities law. All statements included herein, other than statements of historical fact, including, without limitation, statements regarding potential mineralization and resources, exploration results, and future plans and objectives of Oceanic Iron Ore Corp. ("Oceanic", or the "Company"), are forward-looking statements that involve various risks and uncertainties. In certain cases, forward-looking statements can be identified by the use of words such as "plans", "expects" or "does not expect", "scheduled", "believes", or variations of such words and phrases or statements that certain actions, events or results "potentially", "may", "could", "would", "might" or "will" be taken, occur or be achieved. There can be no assurance that such statements will prove to be accurate, and actual results could differ materially from those expressed or implied by such statements. Forward-looking statements are based on certain assumptions that management believes are reasonable at the time they are made.
In making the forward-looking statements in this presentation, the Company has applied several material assumptions, including, but not limited to, the assumption that: (1) there being no significant disruptions affecting operations, whether due to labour/supply disruptions, damage to equipment or otherwise; (2) permitting, development, expansion and power supply proceeding on a basis consistent with the Company's current expectations; (3) certain price assumptions for iron ore; (4) prices for availability of natural gas, fuel oil, electricity, parts and equipment and other key supplies remaining consistent with current levels; (5) the accuracy of current mineral resource estimates on the Company's property; and (6) labour and material costs increasing on a basis consistent with the Company's current expectations. Important factors that could cause actual results to differ materially from the Company's expectations are disclosed under the heading "Risk Factors" in the Company's Filing Statement dated November 22, 2010 (a copy of which is publicly available on SEDAR at www.sedar.com under the Company's profile) and elsewhere in documents filed from time to time, including MD&A, with the Toronto Stock Exchange and other regulatory authorities. Such factors include, among others, risks related to the ability of the Company to obtain necessary financing and adequate insurance; the economy generally; fluctuations in the currency markets; fluctuations in the spot and forward price of iron ore or certain other commodities (e.g., diesel fuel and electricity); changes in interest rates; disruption to the credit markets and delays in obtaining financing; the possibility of cost overruns or unanticipated expenses; employee relations. Accordingly, readers are advised not to place undue reliance on Forward-Looking Statements. Except as required under applicable securities legislation, the Company undertakes no obligation to publicly update or revise Forward-Looking Statements, whether as a result of new information, future events or otherwise.
Neither the TSX Venture Exchange nor its Regulation Services Provider (as that term is defined in the policies of the TSX Venture Exchange) accepts responsibility for the adequacy or accuracy of this release.
Contact Information:
Steven Dean
Chairman and Chief Executive Officer
+1 604 566 9080
+1 604 566 9081 (FAX)
www.oceanicironore.com