BOSTON, MA--(Marketwired - Oct 25, 2017) - Venture capital (VC) managers in the US rebounded in the first quarter of the year from the previous quarter, returning 3.3% in Q1 2017, compared to -0.1% in Q4 2016. US-based private equity (PE) managers did better than VC managers, returning 3.9% in Q1 2017, according to the benchmark index of the alternative asset class from global investment firm Cambridge Associates.
The Cambridge Associates LLC US Private Equity Index and the Cambridge Associates LLC US Venture Capital Index both outperformed the Russell 2000 Index, which tracks performance of small cap companies, in Q1 2017. But the alternative indexes underperformed against the large cap S&P 500 and the tech-heavy Nasdaq indexes for the quarter. (See table below.)
While venture capital performance bounced back in the first quarter of 2017, 2016 performance was mixed and dragged down returns. "Venture funds in the US underperformed large cap and tech companies in recent time periods amid particularly strong public equity market performance whereas over longer periods, VC managers have outperformed public market indexes by a wide margin," says Theresa Hajer, Managing Director and co-head of US Venture Capital Research at Cambridge Associates.
"From a returns perspective in private equity, we've had a strong last quarter and strong last year. Additionally, the pace of company acquisitions and sales remains high, supported by increased capital calls and distributions which were up 8% and 4% respectively in the last twelve months versus the prior period," says Keirsten Lawton, Managing Director and co-head of US Private Equity Research at Cambridge Associates.
Cambridge Associates derives its US Private Equity and Venture Capital Indexes from the financial information contained in its proprietary database of 1,376 US private equity funds and 1,718 US venture capital funds, with a combined value of roughly $864 billion.
Table 1. US Private Equity and Venture Capital Index Returns (IRR)
Periods Ended March 31, 2017 • USD Terms • Percent (%)
| Qtr | 1 Yr | 3 Yr | 5 Yr | 10 Yr | 15 Yr | 20 Yr | 25 Yr | ||||||||||
| CA US Private Equity | 3.9 | 17.4 | 10.2 | 12.7 | 9.8 | 12.7 | 12.5 | 13.4 | |||||||||
| Russell 2000® mPME | 2.5 | 26.3 | 7.0 | 12.8 | 8.4 | 9.2 | 9.0 | 9.3 | |||||||||
| S&P 500 mPME | 6.1 | 17.1 | 10.3 | 13.5 | 8.6 | 8.3 | 8.0 | 8.6 | |||||||||
| CA US Venture Capital | 3.3 | 7.1 | 11.1 | 13.7 | 9.5 | 7.4 | 28.9 | 25.7 | |||||||||
| Nasdaq Constructed Index* mPME | 10.1 | 22.7 | 13.4 | 15.3 | 11.0 | 10.1 | 9.8 | 10.7 | |||||||||
| Russell 2000® mPME | 2.5 | 26.3 | 7.0 | 12.7 | 7.7 | 9.1 | 9.0 | 9.6 | |||||||||
| S&P 500 mPME | 6.1 | 17.1 | 10.3 | 13.5 | 8.1 | 8.0 | 8.0 | 9.2 | |||||||||
| Nasdaq Composite Index** AACR | 9.8 | 21.4 | 12.1 | 13.8 | 9.3 | 8.1 | 8.2 | 9.6 | |||||||||
| Russell 2000® AACR | 2.5 | 26.2 | 7.2 | 12.4 | 7.1 | 8.4 | 8.7 | 9.5 | |||||||||
| S&P 500 AACR | 6.1 | 17.2 | 10.4 | 13.3 | 7.5 | 7.1 | 7.9 | 9.5 | |||||||||
Sources: Cambridge Associates LLC, Frank Russell Company, Standard & Poor's and Thomson Reuters Datastream.
Notes: Private indexes are pooled horizon internal rates of return, net of fees, expenses and carried interest. Because the US Private Equity and Venture Capital indexes are capitalization weighted, the largest vintage years mainly drive the indexes' performance. Public index returns are shown as both time-weighted returns (average annual compound returns) and dollar-weighted returns (mPME). The CA Modified Public Market Equivalent replicates private investment performance under public market conditions. The public index's shares are purchased and sold according to the private fund cash flow schedule, with distributions calculated in the same proportion as the private fund, and mPME net asset value is a function mPME cash flows and public index returns.
* Constructed Index: Data from 1/1/1986 to 10/31/2003 represented by NASDAQ Price Index. Data from 11/1/2003 to present represented by NASDAQ Composite.
**Capital change only.
Takeaways from the US Venture Capital Index in Q1 2017:
- Distributions to US VC Investors Continue to Outpace Their Fund Contributions for 21st Straight Quarter in Q1 2017. Venture capital fund managers in the US called $3 billion from investors in Q1 2017 and distributed $5 billion to them. The first quarter of 2017 was the 21st straight quarter that distributions outpaced contributions.
- Information Technology Companies Continue to Dominate US VC Index; Strongest Sector Performance in Q1 2017 Was From Health Care Companies. Companies in IT, health care and consumer discretionary continue to make up the bulk of the US venture capital index, accounting for about 88% of the index in Q1 2017. Health care companies generated a 6.5% return for the quarter, higher than the other two major sectors in the index.
- US VC Funds Raised in 2005 and 2010 Performed Best in Q1 2017. US venture capital funds raised in 2005 returned 7.1% during Q1 2017, the strongest vintage year for the quarter, followed by funds raised in 2010 with a quarterly return of 6.4%.
Some highlights from the US Private Equity Index in Q1 2017:
- Distributions to and Contributions from US PE Investors Both Fell in Q1 2017. During Q1 2017, managers in the US private equity index called $22 billion from investors and distributed about $32 billion -- both decreases of 15% or more. Distributions have outpaced contributions in 22 of the last 25 quarters.
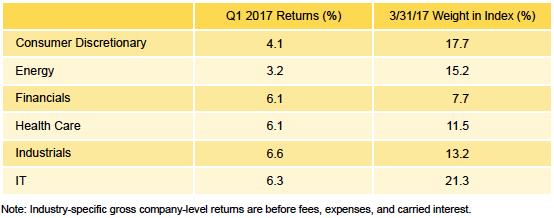
- All Sectors in the US PE Index Performed Well in Q1 2017; Industrial Companies Performed Best. Each of the six sectors that was "meaningfully sized," representing at least 5% of the US private equity index, generated a positive return during Q1 2017. Industrials companies rose the most in value, returning 6.6% for the quarter. Energy companies rose in value by 3.2%, the lowest of the six key sectors.
- US PE Funds Raised in 2012 Generated Strong Return in Q1 2017. Out of the vintage years that represented at least 5% of the US private equity index, funds raised in 2012 were the strongest performers in Q1 2017, returning 6.2%. Funds raised in 2006 and 2008 tied for the lowest return, at 2.7%.
For additional information on the performance of the Cambridge Associates US Private Equity and Venture Capital benchmarks in the first quarter of 2017, please visit https://www.cambridgeassociates.com/benchmark/us-pevc-benchmark-commentary-first-quarter-2017
About the Indexes
Cambridge Associates derives its US private equity benchmark from the financial information contained in its proprietary database of private equity funds. As of March 31, 2017, the database comprised 1,376 US buyouts, private equity energy, growth equity, and mezzanine funds formed from 1986 to 2017, with a value of $671 billion. Ten years ago, as of March 31, 2007, the index included 774 funds whose value was $294 billion.
Cambridge Associates derives its US venture capital benchmark from the financial information contained in its proprietary database of venture capital funds. As of March 31, 20167 the database comprised 1,718 US venture capital funds formed from 1981 to 2017, with a value of roughly $193 billion. Ten years ago, as of March 31, 2007, the index included 1,205 funds whose value was $80 billion.
The pooled returns represent the net end-to-end rates of return calculated on the aggregate of all cash flows and market values as reported to Cambridge Associates by the funds' general partners in their quarterly and annual audited financial reports. These returns are net of management fees, expenses and performance fees that take the form of a carried interest.
About Cambridge Associates
Cambridge Associates is a global investment firm founded in 1973. The firm helps more than 1,000 endowments, foundations, pension plans, and private clients maximize their impact on the world by building custom investment portfolios aimed at generating outperformance across all asset classes. Working alongside its early clients, among them leading university endowments, the firm pioneered the strategy of high-equity orientation and broad diversification, which since the 1980s has been a primary driver of performance for institutional investors. Cambridge Associates delivers a range of services, including outsourced CIO; investment consulting; and access to investment research and tools across the continuum of global asset classes.
Cambridge Associates has more than 1,200 employees and maintains offices in Boston; Arlington, VA; Beijing; Dallas; London; Menlo Park, CA; New York; San Francisco; Singapore; Sydney; and Toronto. Cambridge Associates consists of five global investment consulting affiliates that are all under common ownership and control. For more information, please visit www.cambridgeassociates.com.
Copyright © 2017 by Cambridge Associates LLC. All rights reserved.
This report may not be displayed, reproduced, distributed, transmitted, or used to create derivative works in any form, in whole or in portion, by any means, without written permission from Cambridge Associates LLC ("CA"). Copying of this publication is a violation of US and global copyright laws (e.g., 17 U.S.C. 101 et seq.). Violators of this copyright may be subject to liability for substantial monetary damages.
This report is provided for informational purposes only. The information does not represent investment advice or recommendations, nor does it constitute an offer to sell or a solicitation of an offer to buy any securities. Any references to specific investments are for illustrative purposes only. The information herein does not constitute a personal recommendation or take into account the particular investment objectives, financial situations, or needs of individual clients. Information in this report or on which the information is based may be based on publicly available data. CA considers such data reliable but does not represent it as accurate, complete, or independently verified, and it should not be relied on as such. Nothing contained in this report should be construed as the provision of tax, accounting, or legal advice. Past performance is not indicative of future performance. Broad-based securities indexes are unmanaged and are not subject to fees and expenses typically associated with managed accounts or investment funds. Investments cannot be made directly in an index. Any information or opinions provided in this report are as of the date of the report, and CA is under no obligation to update the information or communicate that any updates have been made. Information contained herein may have been provided by third parties, including investment firms providing information on returns and assets under management, and may not have been independently verified.
The terms "CA" or "Cambridge Associates" may refer to any one or more CA entity including: Cambridge Associates, LLC (a registered investment adviser with the US Securities and Exchange Commission, a Commodity Trading Adviser registered with the US Commodity Futures Trading Commission and National Futures Association, and a Massachusetts limited liability company with offices in Arlington, VA; Boston, MA; Dallas, TX; Menlo Park, CA, New York, NY; and San Francisco, CA), Cambridge Associates Limited (a registered limited company in England and Wales, No. 06135829, that is authorised and regulated by the UK Financial Conduct Authority in the conduct of Investment Business, reference number: 474331); Cambridge Associates Limited, LLC (a registered investment adviser with the US Securities and Exchange Commission, an Exempt Market Dealer and Portfolio Manager in the Canadian provinces of Alberta, British Columbia, Manitoba, Newfoundland and Labrador, Nova Scotia, Ontario, Québec, and Saskatchewan, and a Massachusetts limited liability company with a branch office in Sydney, Australia, ARBN 109 366 654), Cambridge Associates Investment Consultancy (Beijing) Ltd (a wholly owned subsidiary of Cambridge Associates, LLC which is registered with the Beijing Administration for Industry and Commerce, registration No. 110000450174972), and Cambridge Associates Asia Pte Ltd (a Singapore corporation, registration No. 200101063G, which holds a Capital Market Services License to conduct Fund Management for Accredited and/or Institutional Investors only by the Monetary Authority of Singapore).
Contact Information:
Media Contact:
Eric Mosher
Sommerfield Communications, Inc.
eric@sommerfield.com
(212) 255-8386