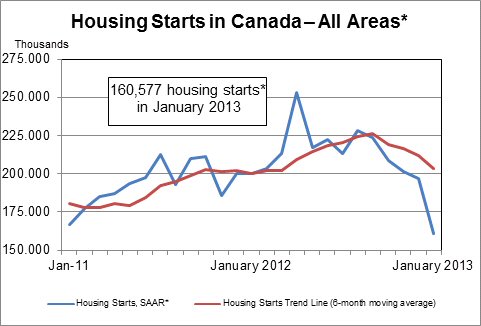
OTTAWA, ONTARIO--(Marketwire - Feb. 8, 2013) - Housing starts in Canada were trending at 203,208 units in January, according to Canada Mortgage and Housing Corporation (CMHC). The trend is a six-month moving average of the monthly seasonally adjusted annual rates (SAAR)1 of housing starts.
"The trend in total housing starts has been moderating since September 2012 and in existing home sales since May 2012. Trends in the two market segments typically follow a similar pattern with the new home market lagging behind the existing home market by a few months," said Mathieu Laberge, Deputy Chief Economist at CMHC. "The current trend is also in line with CMHC's housing market outlook, which calls for moderation in housing starts activity in 2013."
CMHC uses the trend measure as a complement to the monthly SAAR of housing starts to account for considerable swings in monthly estimates and obtain a more complete picture of the state of the housing market. In some situations, analyzing only SAAR data can be misleading in some markets, as they are largely driven by the multiples segment of the markets, which can be quite volatile from one month to the next.
The standalone monthly SAAR was 160,577 units in January, down from 197,118 in December. The SAAR of urban starts decreased by 22.3 per cent in January to 138,134 units. Single urban starts decreased by 11.2 per cent to 59,318 units and multiple urban starts decreased by 28.9 per cent to 78,816 units.
January's seasonally adjusted annual rates of urban starts decreased in Ontario (-43.9 per cent), Quebec (-29.6 per cent) and in the Prairies (-5.9 per cent). Urban starts increased in Atlantic Canada (+59.4 per cent) and in British Columbia (+7.7 per cent).
Rural starts2 were estimated at a seasonally adjusted annual rate of 22,443 units in January.
Preliminary housing starts data is also available in English and French at the following link: Preliminary Housing Starts Tables.
1 All starts figures in this release, other than actual starts and the trend estimate, are seasonally adjusted annual rates (SAAR)-that is, monthly figures adjusted to remove normal seasonal variation and multiplied by 12 to reflect annual levels. By removing seasonal ups and downs, seasonal adjustment allows for a comparison from one season to the next and from one month to the next. Reporting monthly figures at annual rates indicates the annual level of starts that would be obtained if the monthly pace were maintained for 12 months. This facilitates comparison of the current pace of activity to annual forecasts as well as to historical annual levels.
2 CMHC estimates the level of starts in centres with a population of less than 10,000 for each of the three months of the quarter, at the beginning of each quarter. During the last month of the quarter, CMHC conducts the survey in these centres and revises the estimate.
As Canada's national housing agency, CMHC draws on more than 65 years of experience to help Canadians access a variety of high quality, environmentally sustainable and affordable housing solutions. CMHC also provides reliable, impartial and up-to-date housing market reports, analysis and knowledge to support and assist consumers and the housing industry in making informed decisions.
Follow CMHC on Twitter @CMHC_ca.
Additional data is available upon request.
This release is also available at www.cmhc.ca.
(Ce document existe également en français.)
A graph is available at http://media3.marketwire.com/docs/Housing_Canada_02082013.jpg.
| Preliminary Housing Start Data | ||||
| January / 2012-2013 | ||||
| Canada | January 2012 | January 2013 | ||
| Actual, all areas | 13,038 | 9,904 | ||
| Actual, rural areas | 730 | 745 | ||
| Actual, urban centres1 | ||||
| January - Single-Detached | 3,707 | 3,279 | ||
| January - Multiples | 8,601 | 5,880 | ||
| January - Total | 12,308 | 9,159 | ||
| January to Jan. - Single-Detached | 3,707 | 3,279 | ||
| January to January - Multiples | 8,601 | 5,880 | ||
| January to January - Total | 12,308 | 9,159 | ||
| December 2012 | January 2013 | |||
| SAAR2, all areas | 197,118 | 160,577 | ||
| SAAR, rural areas | 19,411 | 22,443 | ||
| SAAR, urban centres1 | ||||
| Single-Detached | 66,780 | 59,318 | ||
| Multiples | 110,927 | 78,816 | ||
| Total | 177,707 | 138,134 | ||
| Atlantic region, urban centres | 7,713 | 12,295 | ||
| Quebec, urban centres | 35,599 | 25,062 | ||
| Ontario, urban centres | 74,767 | 41,912 | ||
| Prairie region, urban centres | 39,329 | 37,009 | ||
| British Columbia, urban centres | 20,299 | 21,856 | ||
| Source: | CMHC |
| 1 | Urban centres with a population of 10,000 and over. |
| 2 | Seasonally Adjusted at Annual Rates |
| Detailed data available upon request. |
Contact Information:
Media Relations, CMHC
613-748-2799
csauriol@cmhc-schl.gc.ca