Mackinac Financial Corporation Announces 2010 Results of Operations/Asset Quality


MANISTIQUE, MI--(Marketwire - February 11, 2011) - Mackinac Financial Corporation (NASDAQ: MFNC), the holding company for mBank, reported a loss of $1.160 million or $.34 per share, for the year ended December 31, 2010, compared to a net income of $1.907 million, or $.56 per share, for 2009. Weighted average shares outstanding for both years amounted to 3,419,736.

The loss to the Corporation this year was primarily the result of credit charges and write-downs on an isolated pocket of older loans and pieces of other real estate owned located primarily in Southeast Michigan. The company took an aggressive workout posture throughout 2010 to move these assets out of the bank to eliminate on-going carrying costs and administrative expenses.

                            Earnings Analysis
--------------------------------------------------------------------------

                                                2010      2009      2008
                                              --------  --------- --------
Income before tax and preferred  dividends,
 as reported:                                 $ (3,917) $   3,536 $  2,659

Credit related costs:
    Loan loss provision                          6,500      3,700    2,300
    OREO write-downs/gains and losses            2,753        208      (80)
Noncore income:
    Security gains                                 215      1,471       64
    Gain on sale of branch offices                   -      1,208        -

                                              --------  --------- --------
"Adjusted" income before taxes and preferred
 dividends                                    $  5,121  $   4,765 $  4,815
                                              ========  ========= ========
  (Excluding items, noted above)

As you will note from the chart above, the company's "core earnings" run rate outside of extraordinary credit related charges and other one-time items has improved as the result of lowered funding costs from the significant growth in our core deposit base, control of non-interest expenses, and increases in non-interest income from our SBA/USDA lending programs and secondary market 1-4 family loan sales. It should be noted that the subsidiary bank posted a small profit for the year of approximately $83,000.

Paul Tobias, Chairman of MFNC, commenting on the overall results for 2010, stated, "During 2010 we recognized the losses associated with a few large credits, booked prior to the recession, that were well secured at the time of loan origination but suffered from operating models that could not withstand the severe recession and the deterioration of collateral values in Southeastern Michigan. Despite the challenging times, we have made significant progress to increase our franchise value. Our remaining portfolio continues to perform satisfactorily and asset quality matrices continue to outperform peers. We are confident that credit related expenses will decrease in 2011 and return to normal levels in 2012."

Listed below are several key points relative to our 2010 results:

  • We grew core bank deposits by $80 million. This reduced our reliance on wholesale deposits by $115.4 million, reducing balance sheet risk. We experienced core deposit growth in all of our markets, with $40 million in Northern Lower Michigan, $11 million in Southeast Michigan and $29 million in the Upper Peninsula. Most of our 2010 deposit growth occurred in low cost transactional accounts which grew by $44 million.

  • We continued to experience good loan demand with approximately $114 million of new loan production. At 2010 year-end, the Corporation's loans stood at $383.086 million, a slight decrease from the 2009 year-end balances of $384.310 million. Our total outstanding loans declined by $1.2 million after reductions for loan sales, (both SBA/USDA and secondary market) amortization and payoffs, some associated with the elimination of problem assets. We continue to be highly successful in producing well priced high quality loans in the Upper Peninsula with 2010 loan production of $81 million. Loan production totaled $22 million in Northern Lower Michigan and $11 million in Southeast Michigan where the market have been hit the hardest by the recession.

  • In 2010 we had continued success in the origination and sales of SBA/USDA loans with total fee income of $.9 million in 2010 compared to $.5 million in fee income during 2009. We continue to be a state leader in these programs.

  • One of our initiatives for 2010 was the expansion of our consumer lending program by hiring several key mortgage loan producers and the centralization of our consumer lending processing. This was successful, with secondary market fee income of $.5 million in 2010 compared to $.3 million in 2009 and an increase in total consumer loan production from $39 million in 2009 to $60 million in 2010. We also have retained the servicing of approximately $27 million of mortgage loans which provides future refinancing opportunities and is a source of core deposits.

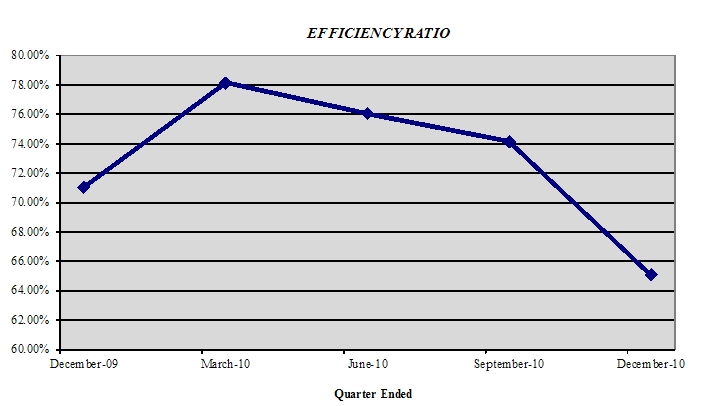
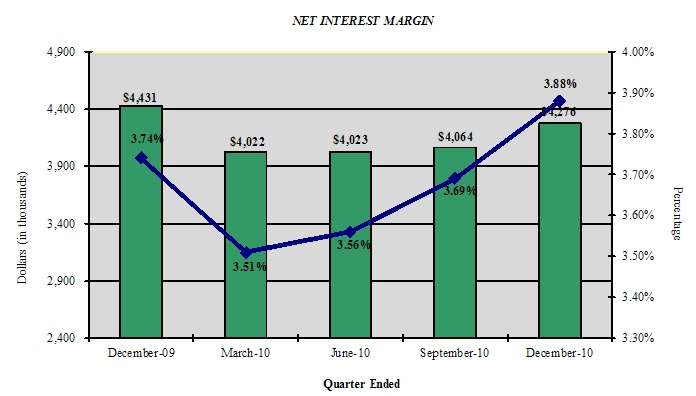
  • We improved our net interest margin from 3.74% in the fourth quarter of 2009 to 3.88% in 2010's fourth quarter. Given our current funding structure, we expect to see this improve throughout 2011 as well.

  • We had an overall reduction in nonperforming assets from $21.0 million at the end of 2009 to $16.1 million at the end of 2010. As noted above, the resolution of problem assets during 2010 impacted our earnings but we divested these problem loans and OREO properties so that we could eliminate holding costs and forego the opportunity cost that impacts longer-term shareholder value creation.

Total assets of the Corporation at December 31, 2010 were $478.696 million, a decrease of $36.681 million from 2009 year end assets of $515.377 million. The decline in assets was largely attributed to a reduction in excess liquidity which was used to pay off maturing wholesale deposits. Total deposits decreased from $421.389 million at the end of 2009 to $386.778 million at 2010 year end. Kelly W. George, President and Chief Executive Officer of mBank, commenting on the deposit growth, "We continue to focus our efforts on growing the Bank's core deposits because we believe this translates into real franchise value and improves our overall balance sheet risk. As noted above, in 2010, we were extremely successful in growing bank deposits in all of our markets, and this will continue to be a primary objective of the 2011 business plan as well."

Nonperforming assets decreased by $4.9 million, from $21.0 million at 2009 year end to $16.1 million at year end 2010. Nonperforming loans totaled $10.6 million, or 2.76% of total loans at December 31, 2010. Nonaccrual loans now reside at 1.55%, a reduction from 3.74% at year-end 2009. Nonperforming assets at December 31, 2010 represented 3.37% of total assets, compared to 4.08% of total assets at December 31, 2009. Kelly W. George commented, "Our current level of nonperforming assets, while still below peers and manageable with a Texas Ratio of 27%, continues to provide some challenges given the time needed in terms of real estate holding periods to work through these issues. Most of these assets are secured with some form of property and reside in areas of the state that were hit the hardest in terms of the recession. We have updated evaluations on all our remaining OREO pieces and larger problem assets and will continue to focus on early identification and resolution to minimize carrying costs, collateral deterioration and incremental loss."

Net interest income for the year ended December 31, 2010 was $16.385 million compared to $16.287 million for the year ended December 31, 2009. The margin percentage for 2010 was 3.66% compared to 3.59% in 2009.

We recognize the importance of cost control, especially in times of economic slowdown. In 2010 our total noninterest expense was $16.597 million compared to $13.802 million in 2009. The increase in 2010 was primarily attributable to costs associated with higher levels of nonperforming assets. As stated previously, OREO write-downs totaled $2.753 million in 2010 compared to $.208 million in 2009, an increase of $2.545 million.

Shareholders' equity totaled $53.882 million at December 31, 2010, compared to $55.299 million at the end of 2009, a decrease of $1.417 million. This decrease includes the consolidated net loss of $1.160 million, the capital contribution impact of stock options and amortization of preferred stock issue costs along with the decrease in equity due to the decline in the market value of held-for-sale investments, which amounted to $.5 million.

The capital position remains strong at the Corporation with a Tier 1 ratio of 9.25% and Total Risk Based Capital of 12.62%. The Bank is also well capitalized with a Tier 1 ratio of 8.09% and Total Risk Based Capital of 11.18%.

Mr. Tobias concluded, "As we enter 2011, we are focusing on organic growth. We will continue to be granular and selective in our lending activities, focusing on SBA/USDA loans. We will continue to grow core deposits and control expenses. We are confident that as 2011 evolves we will show continuous improvement and by 2012 show increased earnings potential of this franchise. We are proud that we have been able to build shareholders equity to $12.63 per share and are eager to build an earnings record that will allow our stock to reflect its intrinsic value."

Mackinac Financial Corporation is a registered bank holding company formed under the Bank Holding Company Act of 1956 with assets in excess of $450 million and whose common stock is traded on the NASDAQ stock market as "MFNC." The principal subsidiary of the Corporation is mBank. Headquartered in Manistique, Michigan, mBank has 11 branch locations; seven in the Upper Peninsula, three in the Northern Lower Peninsula and one in Oakland County, Michigan. The Company's banking services include commercial lending and treasury management products and services geared toward small to mid-sized businesses, as well as a full array of personal and business deposit products and consumer loans.

Forward-Looking Statements

This release contains certain forward-looking statements. Words such as "anticipates," "believes," "estimates," "expects," "intends," "should," "will," and variations of such words and similar expressions are intended to identify forward-looking statements: as defined by the Private Securities Litigation Reform Act of 1995. These statements reflect management's current beliefs as to expected outcomes of future events and are not guarantees of future performance. These statements involve certain risks, uncertainties and assumptions that are difficult to predict with regard to timing, extent, likelihood, and degree of occurrence. Therefore, actual results and outcomes may materially differ from what may be expressed or forecasted in such forward-looking statements. Factors that could cause a difference include among others: changes in the national and local economies or market conditions; changes in interest rates and banking regulations; the impact of competition from traditional or new sources; and the possibility that anticipated cost savings and revenue enhancements from mergers and acquisitions, bank consolidations, branch closings and other sources may not be fully realized at all or within specified time frames as well as other risks and uncertainties including but not limited to those detailed from time to time in filings of the Company with the Securities and Exchange Commission. These and other factors may cause decisions and actual results to differ materially from current expectations. Mackinac Financial Corporation undertakes no obligation to revise, update, or clarify forward-looking statements to reflect events or conditions after the date of this release.


                MACKINAC FINANCIAL CORPORATION AND SUBSIDIARIES
                          SELECTED FINANCIAL HIGHLIGHTS

                                                    For The Years Ended
                                                        December 31,
(Dollars in thousands, except per share data)         2010         2009
                                                  -----------  -----------
                                                  (Unaudited)  (Unaudited)
Selected Financial Condition Data (at end of
 period):
Assets                                            $   478,696  $   515,377
Loans                                                 383,086      384,310
Investment securities                                  33,860       46,513
Deposits                                              386,779      421,389
Borrowings                                             36,069       36,140
Shareholders' equity                                   53,882       55,299


Selected Statements of Income Data:
Net interest income                               $    16,385  $    16,287
Income before taxes and preferred dividend             (3,917)       3,536
Net income                                             (1,160)       1,907
Income per common share - Basic                          (.34)         .56
Income per common share - Diluted                        (.34)         .56
Weighted average shares outstanding                 3,419,736    3,419,736


Selected Financial Ratios and Other Data:
Performance Ratios:
Net interest margin                                      3.66%        3.59%
Efficiency ratio                                        72.57        72.24
Return on average assets                                 (.23)         .39
Return on average equity                                (2.06)        3.77

Average total assets                              $   502,993  $   493,652
Average total shareholders' equity                     56,171       50,531
Average loans to average deposits ratio                 94.36%       92.99%


Common Share Data at end of period:
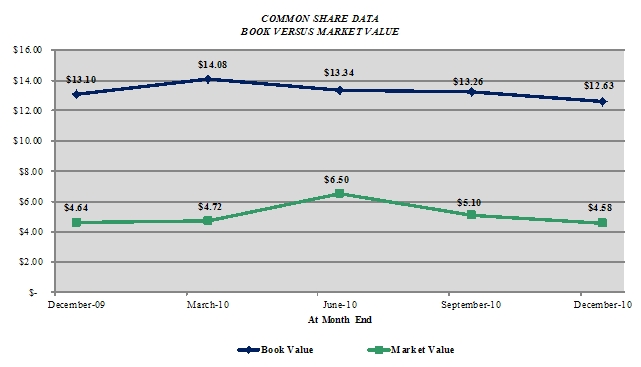
Market price per common share                     $      4.58  $      4.64
Book value per common share                       $     12.63  $     13.10
Common shares outstanding                           3,419,736    3,419,736

Other Data at end of period:
Allowance for loan losses                         $     6,613  $     5,225
Non-performing assets                             $    16,125  $    21,041
Allowance for loan losses to total loans                 1.73%        1.36%
Non-performing assets to total assets                    3.37%        4.08%
Texas ratio                                             26.66%       34.77%

Number of:
   Branch locations                                        11           10
   FTE Employees                                          110          100


                MACKINAC FINANCIAL CORPORATION AND SUBSIDIARIES
                         CONSOLIDATED BALANCE SHEETS

                                                December 31,  December 31,
(Dollars in thousands)                              2010          2009
                                                ------------  ------------
                                                 (Unaudited)   (Audited)
ASSETS

Cash and due from banks                         $     22,719  $     18,433
Federal funds sold                                    12,000        27,000
                                                ------------  ------------
   Cash and cash equivalents                          34,719        45,433

Interest-bearing deposits in other financial
 institutions                                            713           678
Securities available for sale                         33,860        46,513
Federal Home Loan Bank stock                           3,423         3,794

Loans:
   Commercial                                        308,677       305,670
   Mortgage                                           68,473        74,350
   Installment                                         5,936         4,290
                                                ------------  ------------
     Total Loans                                     383,086       384,310
       Allowance for loan losses                      (6,613)       (5,225)
                                                ------------  ------------
   Net loans                                         376,473       379,085

Premises and equipment                                 9,660        10,165
Other real estate held for sale                        5,562         5,804
Other assets                                          14,286        23,905
                                                ------------  ------------

TOTAL ASSETS                                    $    478,696  $    515,377
                                                ============  ============

LIABILITIES AND SHAREHOLDERS' EQUITY
Liabilities:
   Non-interest-bearing deposits                $     41,264  $     35,878
   Interest-bearing deposits:
     NOW, Money Market, Checking                     134,703        95,790
     Savings                                          17,670        18,207
     CDs < $100,000                                   96,976        59,953
     CDs > $100,000                                   22,698        36,385
     Brokered                                         73,467       175,176
                                                ------------  ------------
       Total deposits                                386,778       421,389

   Borrowings:
     Federal funds purchased                               -             -
     Short-term                                       20,000        15,000
     Long-term                                        16,069        21,140
                                                ------------  ------------
       Total borrowings                               36,069        36,140
   Other liabilities                                   1,967         2,549
                                                ------------  ------------
     Total liabilities                               424,814       460,078

Shareholders' equity:
   Preferred stock - No par value:
     Authorized 500,000 shares, no shares
      outstanding                                     10,706        10,514
   Common stock and additional paid in capital
    - No par value
     Authorized - 18,000,000 shares
     Issued and outstanding - 3,419,736 shares        43,525        43,493
     Accumulated deficit                                (961)          199
     Accumulated other comprehensive income
      (loss)                                             612         1,093
                                                ------------  ------------

       Total shareholders' equity                     53,882        55,299
                                                ------------  ------------

TOTAL LIABILITIES AND SHAREHOLDERS' EQUITY      $    478,696  $    515,377
                                                ============  ============


                MACKINAC FINANCIAL CORPORATION AND SUBSIDIARIES
                     CONSOLIDATED STATEMENTS OF OPERATIONS

(Dollars in thousands, except per share
 data)                                   For The Years Ended December 31,
                                           2010        2009        2008
                                        ----------  ----------- -----------
INTEREST INCOME:                        (Unaudited)  (Audited)   (Audited)
   Interest and fees on loans:
        Taxable                         $   21,091  $    20,521 $    22,555
        Tax-exempt                             188          292         404
   Interest on securities:
        Taxable                              1,406        2,783       1,293
        Tax-exempt                              28           19           5
   Other interest income                       127           93         305
                                        ----------  ----------- -----------
        Total interest income               22,840       23,708      24,562
                                        ----------  ----------- -----------

INTEREST EXPENSE:
   Deposits                                  5,607        6,431      10,115
   Borrowings                                  848          990       1,583
                                        ----------  ----------- -----------
        Total interest expense               6,455        7,421      11,698
                                        ----------  ----------- -----------

Net interest income                         16,385       16,287      12,864
Provision for loan losses                    6,500        3,700       2,300
                                        ----------  ----------- -----------
Net interest income after provision for
 loan losses                                 9,885       12,587      10,564
                                        ----------  ----------- -----------

OTHER INCOME:
 Service fees                                  990        1,023         838
 Net security gains                            215        1,471          64
 Net gains on sale of secondary market
  loans                                      1,407          830         120
 Proceeds from settlement of lawsuits            -            -       3,475
 Other                                         183        1,427         156
                                        ----------  ----------- -----------
        Total other income                   2,795        4,751       4,653
                                        ----------  ----------- -----------

OTHER EXPENSES:
 Salaries and employee benefits              6,918        6,583       6,886
 Occupancy                                   1,313        1,385       1,374
 Furniture and equipment                       806          805         771
 Data processing                               740          862         844
 Professional service fees                     627          603         508
 Loan and deposit                            4,620        1,793         489
 Telephone                                     193          187         170
 Advertising                                   297          322         305
 Other                                       1,084        1,262       1,211
                                        ----------  ----------- -----------
        Total other expenses                16,598       13,802      12,558
                                        ----------  ----------- -----------

Income before provision for income
 taxes                                      (3,918)       3,536       2,659
Provision for (benefit of) income taxes     (3,500)       1,120         787
                                        ----------  ----------- -----------

                                        ----------  ----------- -----------
NET INCOME                              $     (418) $     2,416 $     1,872
                                        ----------  ----------- -----------

Preferred dividend expense                     742          509           -

                                        ----------  ----------- -----------
NET INCOME AVAILABLE TO COMMON
 SHAREHOLDERS                           $   (1,160) $     1,907 $     1,872
                                        ==========  =========== ===========

INCOME PER COMMON SHARE
 Basic                                  $    (0.34) $       .56 $       .55
                                        ==========  =========== ===========
 Diluted                                $    (0.34) $       .56 $       .55
                                        ==========  =========== ===========


                MACKINAC FINANCIAL CORPORATION AND SUBSIDIARIES
                        LOAN PORTFOLIO AND CREDIT QUALITY

(Dollars in thousands)

Loan Portfolio Balances (at end of period):

                                                December 31,  December 31,
                                                    2010          2009
                                                ------------- -------------
                                                 (Unaudited)    (Audited)
Commercial Loans:
Real estate - operators of nonresidential
 buildings                                      $      58,114 $      48,689
Hospitality and tourism                                37,737        45,315
Operators of nonresidential buildings                  16,598        12,619
Real estate agents and managers                        15,857        24,242
Other                                                 135,411       150,214
                                                ------------- -------------
   Total Commercial Loans                             263,717       281,079

1-4 family residential real estate                     75,074        67,232
Consumer                                                5,283         4,290
Construction
   Commercial                                          33,330        24,591
   Consumer                                             5,682         7,118
                                                ------------- -------------

   Total Loans                                  $     383,086 $     384,310
                                                ============= =============


Credit Quality (at end of period):

                                                December 31,  December 31,
                                                    2010          2009
                                                ------------  ------------
                                                (Unaudited)     (Audited)
Nonperforming Assets:
Nonaccrual loans                                $      5,921  $     14,368
Loans past due 90 days or more                             -             -
Restructured loans                                     4,642           869
                                                ------------  ------------
   Total nonperforming loans                          10,563        15,237
Other real estate owned                                5,562         5,804
                                                ------------  ------------
   Total nonperforming assets                   $     16,125  $     21,041
                                                ============  ============
Nonperforming loans as a % of loans                     2.76%         3.96%
                                                ------------  ------------
Nonperforming assets as a % of assets                   3.37%         4.08%
                                                ------------  ------------
Reserve for Loan Losses:
At period end                                   $      6,613  $      5,225
                                                ------------  ------------
As a % of average loans                                 1.72%         1.39%
                                                ------------  ------------
As a % of nonperforming loans                          62.61%        34.29%
                                                ------------  ------------
As a % of nonaccrual loans                            111.69%        36.37%
                                                ------------  ------------
Texas Ratio                                            26.66%        34.77%
                                                ------------  ------------

Charge-off Information (year to date):
   Average loans                                $    384,347  $    374,796
                                                ------------  ------------
   Net charge-offs                              $      5,112  $      2,752
                                                ------------  ------------
   Charge-offs as a % of average loans                  1.33%          .73%
                                                ------------  ------------


                  MACKINAC FINANCIAL CORPORATION
                       FIVE YEAR OVERVIEW

                                        QUARTER ENDED
                  --------------------------------------------------------
                                        (Unaudited)
                  --------------------------------------------------------
                   December   September      June      March     December
                      31,         30,         30,        31,        31,
                     2010        2010        2010       2010       2009
                  ---------   ---------   ---------   ---------  ---------
BALANCE SHEET
 (Dollars in
 thousands)

Total loans       $ 383,086   $ 382,727   $ 384,839   $ 377,311  $ 384,310
Allowance for
 loan losses         (6,613)     (5,437)     (6,371)     (4,737)    (5,225)
                  ---------   ---------   ---------   ---------  ---------
   Total loans,
    net             376,473     377,290     378,468     372,574    379,085
Intangible assets         -           -           -           -          -
Total assets        478,696     499,006     500,774     502,427    515,377
Core deposits       290,614     287,055     271,026     236,227    209,828
Noncore deposits
 (1)                 96,165     117,469     134,758     168,985    211,561
                  ---------   ---------   ---------   ---------  ---------
   Total deposits   386,779     404,524     405,784     405,212    421,389
Total borrowings     36,069      36,069      36,140      36,140     36,140
Total
 shareholders'
 equity              53,882      55,987      56,231      58,722     55,299
Total shares
 outstanding      3,419,736   3,419,736   3,419,736   3,419,736  3,419,736

AVERAGE BALANCES
 (Dollars in
 thousands)

Assets            $ 488,320   $ 512,335   $ 502,942   $ 508,495  $ 514,102
Loans               385,296     385,268     382,169     384,640    386,203
Deposits            393,266     416,847     405,449     413,897    418,280
Equity               55,015      56,668      57,889      55,109     55,665

INCOME STATEMENT
 (Dollars in
 thousands)

Net interest
 income           $   4,276   $   4,064   $   4,023   $   4,022  $   4,431
Provision for
 loan losses          1,800       1,000       2,800         900      2,300
                  ---------   ---------   ---------   ---------  ---------
   Net interest
    income after
    provision         2,476       3,064       1,223       3,122      2,131
Total noninterest
 income                 747         648         593         807      1,503
Total noninterest
 expense              4,037       3,601       5,330       3,629      3,650
                  ---------   ---------   ---------   ---------  ---------
Income before
 taxes                 (814)        111      (3,514)        300        (16)
Provision for
 income taxes         1,093          30      (1,212)     (3,411)       (22)
                  ---------   ---------   ---------   ---------  ---------
   Net income        (1,907)         81      (2,302)      3,711          6
                  ---------   ---------   ---------   ---------  ---------
Preferred
 dividend expense       185         185         186         185        186
                  ---------   ---------   ---------   ---------  ---------
Net income
 available to
 common
 shareholders     $  (2,092)  $    (104)  $  (2,488)  $   3,526  $    (180)
                  =========   =========   =========   =========  =========

PER SHARE DATA

Earnings          $    (.61)  $    (.03)  $    (.73)  $    1.03  $    (.05)
Book value  per
 common share         12.63       13.26       13.34       14.08      13.10
Market value,
 closing price         4.58        5.10        6.50        4.72       4.64

ASSET QUALITY
 RATIOS

Nonperforming
 loans/total
 loans                 2.76 %      2.94 %      2.87 %      2.62%      3.96%
Nonperforming
 assets/total
 assets                3.37        3.41        3.34        3.51       4.08
Allowance for
 loan
 losses/total
 loans                 1.73        1.42        1.66        1.26       1.36
Allowance for
 loan
 losses/nonperfo-
 rming loans          62.61       48.34       57.69       47.87      34.29
Texas ratio (2)       26.66       27.68       26.71       27.76      34.77

PROFITABILITY
 RATIOS

Return on average
 assets               (1.70)%      (.08)%     (1.98)%      2.81%     (.14)%
Return on average
 equity              (15.09)      (0.73)     (17.24)      25.95      (1.28)
Net interest
 margin                3.88        3.69        3.56        3.51       3.74
Efficiency ratio      65.05       75.98       76.04       78.12      71.03
Average
 loans/average
 deposits             97.97       92.42       94.26       92.93      92.33

CAPITAL ADEQUACY
 RATIOS

Tier 1 leverage
 ratio                 9.25 %      9.22 %      9.38 %      9.85%      9.75%
Tier 1 capital to
 risk weighted
 assets               11.36       11.73       11.65       12.48      11.92
Total capital to
 risk weighted
 assets               12.62       12.98       12.91       13.69      13.17
Average
 equity/average
 assets               11.27       11.06       11.51       10.84      10.83
Tangible
 equity/tangible
 assets               11.27       11.06       11.51       10.84      10.83


(1) Noncore deposits includes Internet CDs, brokered deposits and CDs
    greater than $100,000

(2) Texas ratio equals nonperforming assets divided by shareholders' equity
    plus allowance for loan losses

Contact Information: Contact: Investor Relations (888) 343-8147 Website: www.bankmbank.com