MANISTIQUE, MI--(Marketwire - Feb 9, 2012) - Mackinac Financial Corporation (
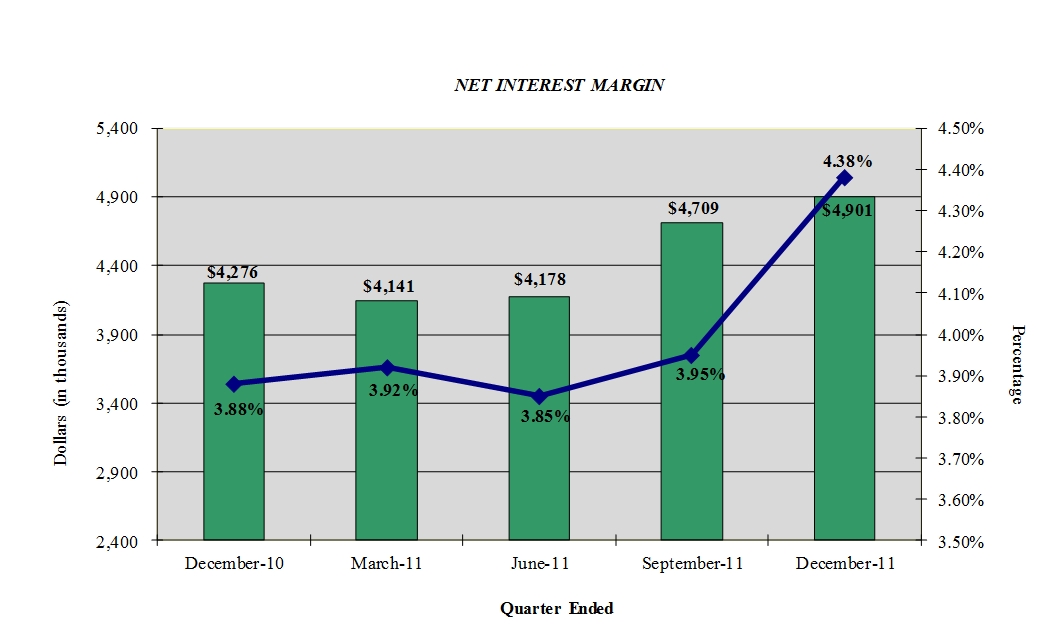
2011 operations of the Corporation benefited primarily from three key drivers. (1) The Corporation recorded significantly lower credit related expenses with the loan loss provision and ORE write-downs totaling $3.437 million in 2011 compared to $9.253 million in 2010. (2) Growth in the Corporation's average net interest margin improved substantially from 3.66% in 2010 to 4.06% in 2011, with a December 2011 margin of 4.54%. (3) Non-interest income recognition of $1.500 million in gains on the sale of SBA and USDA guaranteed loans compared to $.868 million in 2010.
Listed below are some key points relative to our 2011 results:
Improved Credit Quality
- We had an overall reduction in nonperforming assets from $16.125 million at the end of 2010 to $11.155 million at the end of 2011 as we continued with our timely and aggressive problem asset remediation plans to strengthen our balance sheet. Our Texas Ratio at 2011 year-end was reduced to 18.43% and is one of the lowest amongst the 15 largest public banks headquartered in Michigan. As noted above, the resolution of problem assets during 2011 positively impacted our earnings which should result in reduced credit related expenses for 2012.
Core Deposit Growth
- We grew core bank deposits by $58.111 million while decreasing wholesale deposits by $40.631 million, therefore reducing overall balance sheet risk. We experienced core deposit growth in all of our markets, with $27 million in Northern Lower Michigan, $8 million in Southeast Michigan and $23 million in the Upper Peninsula. A good portion of our 2011 deposit growth occurred in low cost transactional accounts which grew by $24.402 million and positively impacted our margin.
Margin Improvement
- The margin improvement was largely attributed to the growth in core deposits of $58 million which allowed for the repayment of higher priced wholesale deposits. The cost of funds declined in 2011 to 1.33% from 1.60% in 2010. Rates on earning assets increased from 5.10% in 2010 to 5.22% in 2011, due in large part to our disciplined loan pricing, which we expect to continue for 2012 to increase the overall margin.
Strong Loan Production
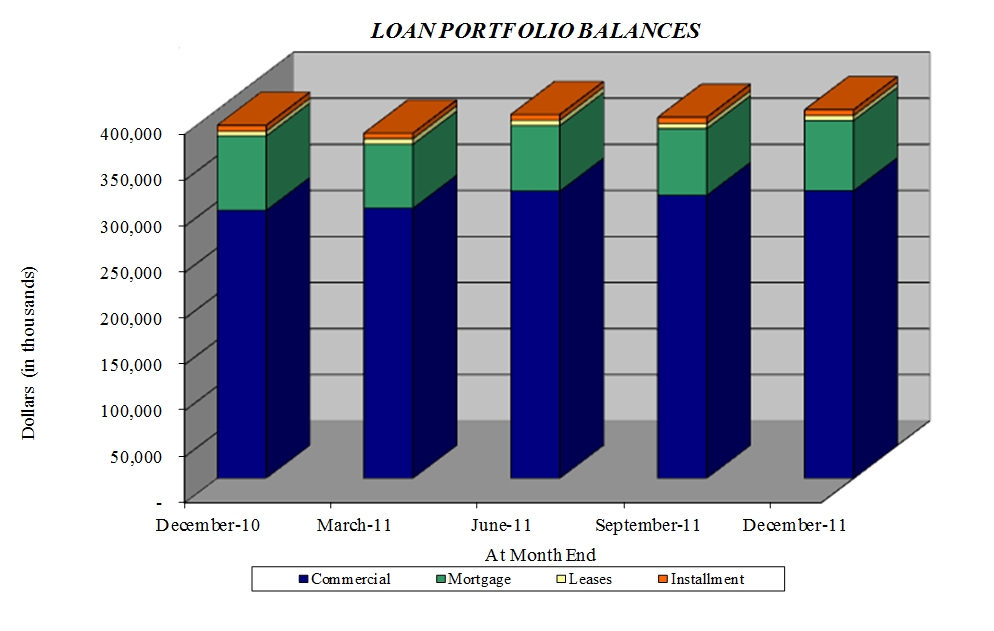
- We continued to experience good new loan demand with approximately $173 million of new loan production split between commercial related credits accounting for $104 million, and consumer/mortgage loans totaling $69 million. At 2011 year-end, the Corporation's loans stood at $401.246 million, an increase from the 2010 year-end balances of $383.086 million. Our total outstanding loans increased by $18.160 million after reductions for loan sales, (SBA/USDA and secondary market) amortization and payoffs which accounted for the difference in production and balance sheet growth. Some of the payoffs were associated with the elimination of problem assets and unexpected payoffs of several larger participation loans. As loan demand has been anemic for some banks, we have witnessed the trend of large banks buying back participations. Most importantly, we continue to be highly successful in producing well priced high quality loans in the Upper Peninsula with 2011 loan production of $95 million. In 2011, we began to see resurgence in loan opportunities in Northern Lower Michigan with production of $48 million and also Southeast Michigan with production of $30 million.
Growth in Noninterest Income
- In 2011 we continued to be a state leader in the origination of sound SBA and USDA guaranteed loans with total fee income of $1.500 million in 2011 compared to $.868 million in fee income during 2010. Sold guaranteed loans totaled $19 million in 2011 compared to $12.6 million in 2010. The Corporation is still seeing average premiums in the 107% range and higher.
- Increased consumer loan production from $59 million in 2010 to $69 million in 2011 which helped augment higher levels secondary market fee income of $700,000 in 2011 compared to $539,000 in 2010. At 2011 year-end, our mortgage loans servicing portfolio totaled $50 million which provides future refinancing/cross selling opportunities and also is a provider of a stable source of core deposits since many of these clients maintain various types of checking and savings accounts.
- Late in 2011, we established mBank Title Insurance Agency, LLC, in conjunction with the Michigan Bankers' Association. This agency will offer title services for both commercial and retail based mortgage transactions in all of our markets. This initiative provides another enhancement to noninterest income and is moving ahead well.
Manistique Papers Bankruptcy and Rehabilitation
- As mentioned in our third quarter press release, mBank has been the lead lender and facilitator in the hopeful rehabilitation and restoration of the local paper mill that has been in existence for over 90 years. The paper mill is the 2nd largest private employer with approximately 150 local well-paying jobs and has been working through a Chapter 11 bankruptcy proceeding since late last summer, with an eventual anticipated asset sale in the first quarter of 2012 to a new owner/operator. With the assistance of the Michigan Economic Development Corporation (MEDC), mBank was able to avert a full Chapter 7 liquidation of the mill after a shut down by the previous out of town lender. mBank, through the purchase of the senior secured term debt and by providing a new debtor in possession line of credit for needed working capital enabled the mill to reopen and begin making paper again last September. This reopening provided the time for mill management to seek a buyer which would provide fresh capital and operating leverage in order to return the mill to profitable operations and keep it a vital member of the local business community.
Loans and Nonperforming Assets
Nonperforming assets decreased by $4.970 million, from $16.125 million at 2010 year end to $11.155 million at year end 2011. Nonperforming loans totaled $7.993 million, or 1.99% of total loans at December 31, 2011, compared to 2.76% of loans at 2010 year end, with 2011 year-end nonaccrual loans at $5.490 million, 1.37% of total loans, a reduction from 1.55% at year-end 2010. Nonperforming assets at December 31, 2011 represented 2.24% of total assets, compared to 3.37% of total assets at December 31, 2010. Kelly W. George, President and CEO of mBank, commented, "We are pleased with our execution in reducing problem loans and ORE from the Corporation's balance sheet this year and believe that current carrying values of problem assets fairly represent exit valuations. We continue to reassess collateral valuations and estimates of the future value of the remaining cash flows to ensure timely resolution of problem assets in the most cost effective manner."
As noted above, new loan production was strong this year. Within the markets the Corporation serves, we are seeing and reviewing more bankable lending opportunities than in previous years. Overall loan production increased from $114 million in 2010 to $173 million in 2011 and our pipeline remains steady moving into 2012. Commenting on overall loan production, George stated, "The continued use of the various government lending programs such as the SBA, USDA, and also the MEDC, have enabled the Corporation to be a catalyst for the on-going rehabilitation of a state that was significantly damaged by the recession and real estate downturn in the late 2000's, by providing the needed capital and lending resources to help clients grow and purchase stable Michigan businesses. We have also allocated additional resources and lending focus on growing and providing increased funding for consumers to acquire, or refinance their primary residence, and other retail related assets."
Assets and Deposits
Total assets of the Corporation at December 31, 2011 were $498.311 million, an increase of $19.615 million from 2010 year end assets of $478.696 million. Total deposits increased from $386.779 million at the end of 2010 to $404.789 million at 2011 year end. Mr. George, commenting on the deposit growth, stated, "In 2011, our primary initiative was to continue with the growth in the Bank's core deposit base building on the momentum and 2010 growth of $80 million. We are pleased with our results this year with $58 million of new core deposits. This translates into real franchise value and reduces our overall balance sheet risk from a regulatory perspective by providing a more stable and low cost funding base."
Noninterest Income/Expense
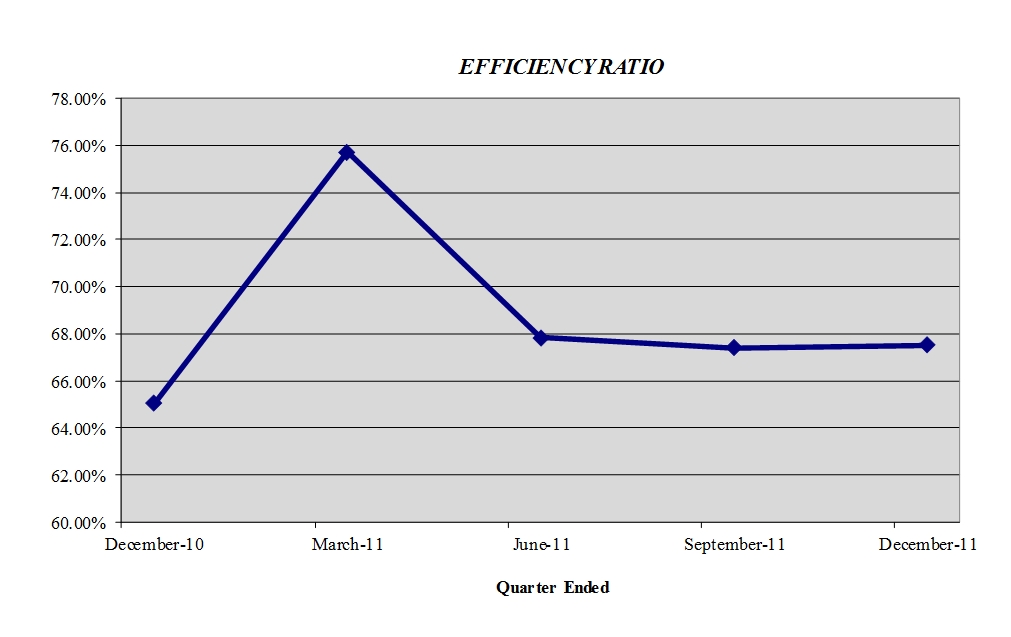
We have been successful in enhancing noninterest revenue beyond traditional deposit product fees over the past several years. This has been challenging given the changes in traditional overdraft charges and checking account fees. Noninterest income, excluding extraordinary items, increased in 2011 to $3.656 million from $2.580 million in 2010 and $2.072 million in 2009. We also understand the importance of cost control, especially in times of economic slowdown. In 2011, we reduced our efficiency ratio to 68.43% from 72.57%, which is a product of our cost control efforts and growth in noninterest income. The Bank's overall non-interest expense base remains slightly below peer at 2.89% of total average assets but should decline further with the improvements in asset quality noted above. Personnel expense for the Bank, at 1.45% of total average assets, compares favorably to peer levels of 1.50%.
Shareholders' Equity
Shareholders' equity totaled $55.263 million at December 31, 2011, compared to $53.882 million at the end of 2010, an increase of $1.381 million. This increase includes the consolidated net income of $1.452 million, the accretion on preferred stock of $.215 million and the $.287 million decrease in equity due to the decline in the market value of held-for-sale investments. Capital remains strong at the Corporation with a Tier 1 ratio of 10.08% and Total Risk Based Capital of 12.87%. The Bank is also well capitalized with a Tier 1 ratio of 9.24% and Total Risk Based Capital of 11.90%.
Chairman and CEO of Mackinac Financial Corporation Mr. Paul Tobias concluded, "We look forward to 2012 as a year of transition. We have weathered the financial storm and are well positioned to accelerate core earnings and explore growth opportunities. Our ongoing initiatives are to continue to grow core deposits and control expenses. We welcome the future challenges of franchise expansion in order to transform the growth in common shareholders' equity into market value realization."
Mackinac Financial Corporation is a registered bank holding Corporation formed under the Bank Holding Corporation Act of 1956 with assets in excess of $495 million and whose common stock is traded on the NASDAQ stock market as "MFNC." The principal subsidiary of the Corporation is mBank. Headquartered in Manistique, Michigan, mBank has 11 branch locations; seven in the Upper Peninsula, three in the Northern Lower Peninsula and one in Oakland County, Michigan. The Corporation's banking services include commercial lending and treasury management products and services geared toward small to mid-sized businesses, as well as a full array of personal and business deposit products and consumer loans.
Forward-Looking Statements
This release contains certain forward-looking statements. Words such as "anticipates," "believes," "estimates," "expects," "intends," "should," "will," and variations of such words and similar expressions are intended to identify forward-looking statements: as defined by the Private Securities Litigation Reform Act of 1995. These statements reflect management's current beliefs as to expected outcomes of future events and are not guarantees of future performance. These statements involve certain risks, uncertainties and assumptions that are difficult to predict with regard to timing, extent, likelihood, and degree of occurrence. Therefore, actual results and outcomes may materially differ from what may be expressed or forecasted in such forward-looking statements. Factors that could cause a difference include among others: changes in the national and local economies or market conditions; changes in interest rates and banking regulations; the impact of competition from traditional or new sources; and the possibility that anticipated cost savings and revenue enhancements from mergers and acquisitions, bank consolidations, branch closings and other sources may not be fully realized at all or within specified time frames as well as other risks and uncertainties including but not limited to those detailed from time to time in filings of the Corporation with the Securities and Exchange Commission. These and other factors may cause decisions and actual results to differ materially from current expectations. Mackinac Financial Corporation undertakes no obligation to revise, update, or clarify forward-looking statements to reflect events or conditions after the date of this release.
| MACKINAC FINANCIAL CORPORATION AND SUBSIDIARIES | |||||||||
| SELECTED FINANCIAL HIGHLIGHTS | |||||||||
| For The Years Ended December 31, | |||||||||
| (Dollars in thousands, except per share data) | 2011 | 2010 | |||||||
| (Unaudited) | (Unaudited) | ||||||||
| Selected Financial Condition Data (at end of period): | |||||||||
| Assets | $ | 498,311 | $ | 478,696 | |||||
| Loans | 401,246 | 383,086 | |||||||
| Investment securities | 38,727 | 33,860 | |||||||
| Deposits | 404,789 | 386,779 | |||||||
| Borrowings | 35,997 | 36,069 | |||||||
| Common Shareholders' Equity | 44,342 | 43,176 | |||||||
| Shareholders' equity | 55,263 | 53,882 | |||||||
| Selected Statements of Income Data: | |||||||||
| Net interest income | $ | 17,929 | $ | 16,385 | |||||
| Income(loss) before taxes and preferred dividend | 3,316 | (3,918 | ) | ||||||
| Net income (loss) | 1,452 | (1,160 | ) | ||||||
| Income(loss) per common share - Basic | .42 | (.34 | ) | ||||||
| Income(loss) per common share - Diluted | .41 | (.34 | ) | ||||||
| Weighted average shares outstanding | 3,419,736 | 3,419,736 | |||||||
| Weighted average shares outstanding- Diluted | 3,500,204 | 3,479,897 | |||||||
| Selected Financial Ratios and Other Data: | |||||||||
| Performance Ratios: | |||||||||
| Net interest margin | 4.06 | % | 3.66 | % | |||||
| Efficiency ratio | 68.43 | 72.57 | |||||||
| Return on average assets | .30 | (.23 | ) | ||||||
| Return on average common equity | 3.30 | (2.64 | ) | ||||||
| Return on average equity | 2.66 | (2.06 | ) | ||||||
| Average total assets | $ | 489,539 | $ | 502,993 | |||||
| Average common shareholders' equity | $ | 43,940 | $ | 43,981 | |||||
| Average total shareholders' equity | $ | 54,561 | $ | 56,171 | |||||
| Average loans to average deposits ratio | 98.05 | % | 94.36 | % | |||||
| Common Share Data at end of period: | |||||||||
| Market price per common share | $ | 5.42 | $ | 4.58 | |||||
| Book value per common share | $ | 12.97 | $ | 12.63 | |||||
| Common shares outstanding | 3,419,736 | 3,419,736 | |||||||
| Other Data at end of period: | |||||||||
| Allowance for loan losses | $ | 5,251 | $ | 6,613 | |||||
| Non-performing assets | $ | 11,155 | $ | 16,125 | |||||
| Allowance for loan losses to total loans | 1.31 | % | 1.73 | % | |||||
| Non-performing assets to total assets | 2.24 | % | 3.37 | % | |||||
| Texas ratio | 18.43 | % | 26.66 | % | |||||
| Number of: | |||||||||
| Branch locations | 11 | 11 | |||||||
| FTE Employees | 116 | 110 | |||||||
| MACKINAC FINANCIAL CORPORATION AND SUBSIDIARIES | |||||||||||
| CONSOLIDATED BALANCE SHEETS | |||||||||||
| December 31, | December 31, | ||||||||||
| (Dollars in thousands) | 2011 | 2010 | |||||||||
| (Unaudited) | (Audited) | ||||||||||
| ASSETS | |||||||||||
| Cash and due from banks | $ | 20,071 | $ | 22,719 | |||||||
| Federal funds sold | 13,999 | 12,000 | |||||||||
| Cash and cash equivalents | 34,070 | 34,719 | |||||||||
| Interest-bearing deposits in other financial institutions | 10 | 713 | |||||||||
| Securities available for sale | 38,727 | 33,860 | |||||||||
| Federal Home Loan Bank stock | 3,060 | 3,423 | |||||||||
| Loans: | |||||||||||
| Commercial | 311,215 | 297,047 | |||||||||
| Mortgage | 83,106 | 80,756 | |||||||||
| Installment | 6,925 | 5,283 | |||||||||
| Total Loans | 401,246 | 383,086 | |||||||||
| Allowance for loan losses | (5,251 | ) | (6,613 | ) | |||||||
| Net loans | 395,995 | 376,473 | |||||||||
| Premises and equipment | 9,627 | 9,660 | |||||||||
| Other real estate held for sale | 3,162 | 5,562 | |||||||||
| Deferred tax asset | 8,427 | 9,028 | |||||||||
| Other assets | 5,233 | 5,258 | |||||||||
| TOTAL ASSETS | $ | 498,311 | $ | 478,696 | |||||||
| LIABILITIES AND SHAREHOLDERS' EQUITY | |||||||||||
| Liabilities: | |||||||||||
| Non-interest-bearing deposits | $ | 51,273 | $ | 41,264 | |||||||
| Interest-bearing deposits: | |||||||||||
| NOW, Money Market, Checking | 152,563 | 134,703 | |||||||||
| Savings | 14,203 | 17,670 | |||||||||
| CDs < $100,000 | 130,685 | 96,977 | |||||||||
| CDs > $100,000 | 23,229 | 22,698 | |||||||||
| Brokered | 32,836 | 73,467 | |||||||||
| Total deposits | 404,789 | 386,779 | |||||||||
| Borrowings: | |||||||||||
| Federal funds purchased | - | - | |||||||||
| Short-term | - | 20,000 | |||||||||
| Long-term | 35,997 | 16,069 | |||||||||
| Total borrowings | 35,997 | 36,069 | |||||||||
| Other liabilities | 2,262 | 1,966 | |||||||||
| Total liabilities | 443,048 | 424,814 | |||||||||
| Shareholders' equity: | |||||||||||
| Preferred stock - No par value: | |||||||||||
| Authorized 500,000 shares, no shares outstanding | 10,921 | 10,706 | |||||||||
| Common stock and additional paid in capital - No par value | |||||||||||
| Authorized - 18,000,000 shares Issued and outstanding - 3,419,736 shares |
43,525 |
43,525 |
|||||||||
| Accumulated earnings (deficit) | 492 | (961 | ) | ||||||||
| Accumulated other comprehensive income (loss) | 325 | 612 | |||||||||
| Total shareholders' equity | 55,263 | 53,882 | |||||||||
| TOTAL LIABILITIES AND SHAREHOLDERS' EQUITY | $ | 498,311 | $ | 478,696 | |||||||
| MACKINAC FINANCIAL CORPORATION AND SUBSIDIARIES | |||||||||||||
| CONSOLIDATED STATEMENTS OF OPERATIONS | |||||||||||||
| (Dollars in thousands, except per share data) | For The Years Ended December 31, | ||||||||||||
| 2011 | 2010 | 2009 | |||||||||||
| INTEREST INCOME: | (Unaudited) | (Audited) | (Audited) | ||||||||||
| Interest and fees on loans: | |||||||||||||
| Taxable | $ | 21,627 | $ | 21,091 | $ | 20,521 | |||||||
| Tax-exempt | 147 | 188 | 292 | ||||||||||
| Interest on securities: | |||||||||||||
| Taxable | 1,162 | 1,406 | 2,783 | ||||||||||
| Tax-exempt | 28 | 28 | 19 | ||||||||||
| Other interest income | 108 | 127 | 93 | ||||||||||
| Total interest income | 23,072 | 22,840 | 23,708 | ||||||||||
| INTEREST EXPENSE: | |||||||||||||
| Deposits | 4,530 | 5,607 | 6,431 | ||||||||||
| Borrowings | 613 | 848 | 990 | ||||||||||
| Total interest expense | 5,143 | 6,455 | 7,421 | ||||||||||
| Net interest income | 17,929 | 16,385 | 16,287 | ||||||||||
| Provision for loan losses | 2,300 | 6,500 | 3,700 | ||||||||||
| Net interest income after provision for loan losses | 15,629 | 9,885 | 12,587 | ||||||||||
| OTHER INCOME: | |||||||||||||
| Service fees | 832 | 990 | 1,023 | ||||||||||
| Net security gains | (1 | ) | 215 | 1,471 | |||||||||
| Income from loans sold | 2,200 | 1,407 | 830 | ||||||||||
| Mortgage servicing rights | 400 | - | - | ||||||||||
| Other | 225 | 183 | 1,427 | ||||||||||
| Total other income | 3,656 | 2,795 | 4,751 | ||||||||||
| OTHER EXPENSES: | |||||||||||||
| Salaries and employee benefits | 7,275 | 6,918 | 6,583 | ||||||||||
| Occupancy | 1,376 | 1,313 | 1,385 | ||||||||||
| Furniture and equipment | 827 | 806 | 805 | ||||||||||
| Data processing | 761 | 740 | 862 | ||||||||||
| Professional service fees | 756 | 627 | 603 | ||||||||||
| Loan and deposit | 1,137 | 910 | 792 | ||||||||||
| ORE writedowns and losses on sale | 1,137 | 2,753 | 208 | ||||||||||
| FDIC Insurance Assessment | 849 | 957 | 839 | ||||||||||
| Telephone | 215 | 193 | 187 | ||||||||||
| Advertising | 351 | 297 | 322 | ||||||||||
| Other | 1,285 | 1,084 | 1,216 | ||||||||||
| Total other expenses | 15,969 | 16,598 | 13,802 | ||||||||||
| Income before provision for income taxes | 3,316 | (3,918 | ) | 3,536 | |||||||||
| Provision for (benefit of) income taxes | 1,098 | (3,500 | ) | 1,120 | |||||||||
| NET INCOME(LOSS) | $ | 2,218 | $ | (418 | ) | $ | 2,416 | ||||||
| Preferred dividend expense | 766 | 742 | 509 | ||||||||||
| NET INCOME(LOSS) AVAILABLE TO COMMON SHAREHOLDERS | $ | 1,452 | $ | (1,160 | ) | $ | 1,907 | ||||||
| INCOME(LOSS) PER COMMON SHARE | |||||||||||||
| Basic | $ | .42 | $ | (.34 | ) | $ | .56 | ||||||
| Diluted | $ | .41 | $ | (.34 | ) | $ | .56 | ||||||
| MACKINAC FINANCIAL CORPORATION AND SUBSIDIARIES | ||||||||
| LOAN PORTFOLIO AND CREDIT QUALITY | ||||||||
| (Dollars in thousands) | ||||||||
| Loan Portfolio Balances (at end of period): | ||||||||
| December 31, | December 31, | |||||||
| 2011 | 2010 | |||||||
| (Unaudited) | (Audited) | |||||||
| Commercial Loans: | ||||||||
| Real estate - operators of nonresidential buildings | $ | 75,391 | $ | 58,114 | ||||
| Hospitality and tourism | 33,306 | 37,737 | ||||||
| Operators of nonresidential buildings | 16,499 | 16,598 | ||||||
| Real estate agents and managers | 10,617 | 15,857 | ||||||
| Other | 155,657 | 135,411 | ||||||
| Total Commercial Loans | 291,470 | 263,717 | ||||||
| 1-4 family residential real estate | 77,332 | 75,074 | ||||||
| Consumer | 6,925 | 5,283 | ||||||
| Construction: | ||||||||
| Commercial | 19,745 | 33,330 | ||||||
| Consumer | 5,774 | 5,682 | ||||||
| Total Loans | $ | 401,246 | $ | 383,086 | ||||
| Credit Quality (at end of period): | ||||||||||
| December 31, | December 31, | |||||||||
| 2011 | 2010 | |||||||||
| (Unaudited) | (Audited) | |||||||||
| Nonperforming Assets : | ||||||||||
| Nonaccrual loans | $ | 5,490 | $ | 5,921 | ||||||
| Loans past due 90 days or more | - | - | ||||||||
| Restructured loans | 2,503 | 4,642 | ||||||||
| Total nonperforming loans | 7,993 | 10,563 | ||||||||
| Other real estate owned | 3,162 | 5,562 | ||||||||
| Total nonperforming assets | $ | 11,155 | $ | 16,125 | ||||||
| Nonperforming loans as a % of loans | 1.99 | % | 2.76 | % | ||||||
| Nonperforming assets as a % of assets | 2.24 | % | 3.37 | % | ||||||
| Reserve for Loan Losses: | ||||||||||
| At period end | $ | 5,251 | $ | 6,613 | ||||||
| As a % of average loans | 1.35 | % | 1.72 | % | ||||||
| As a % of nonperforming loans | 65.69 | % | 62.61 | % | ||||||
| As a % of nonaccrual loans | 95.65 | % | 111.69 | % | ||||||
| Texas Ratio | 18.43 | % | 26.66 | % | ||||||
| Charge-off Information (year to date): | ||||||||||
| Average loans | $ | 388,115 | $ | 384,347 | ||||||
| Net charge-offs | $ | 3,662 | $ | 5,112 | ||||||
| Charge-offs as a % of average loans | .94 | % | 1.33 | % | ||||||
| MACKINAC FINANCIAL CORPORATION | ||||||||||||||||
| QUARTERLY FINANCIAL HIGHLIGHTS | ||||||||||||||||
| QUARTER ENDED | ||||||||||||||||
| (Unaudited) | ||||||||||||||||
| December 31, | September 30, | June 30, | March 31, | December 31, | ||||||||||||
| 2011 | 2011 | 2011 | 2011 | 2010 | ||||||||||||
| BALANCE SHEET (Dollars in thousands) | ||||||||||||||||
| Total loans | $ | 401,246 | $ | 391,903 | $ | 394,812 | $ | 374,609 | $ | 383,086 | ||||||
| Allowance for loan losses | (5,251 | ) | (5,838 | ) | (6,155 | ) | (6,184 | ) | (6,613 | ) | ||||||
| Total loans, net | 395,995 | 386,065 | 388,657 | 368,425 | 376,473 | |||||||||||
| Intangible assets | - | - | - | - | - | |||||||||||
| Total assets | 498,311 | 498,598 | 492,373 | 492,790 | 478,696 | |||||||||||
| Core deposits | 348,724 | 346,843 | 329,958 | 315,638 | 290,614 | |||||||||||
| Noncore deposits (1) | 56,065 | 58,215 | 69,709 | 85,145 | 96,165 | |||||||||||
| Total deposits | 404,789 | 405,058 | 399,667 | 400,783 | 386,779 | |||||||||||
| Total borrowings | 35,997 | 35,997 | 36,069 | 36,069 | 36,069 | |||||||||||
| Common shareholders' equity | 44,342 | 44,613 | 43,973 | 43,340 | 43,176 | |||||||||||
| Total shareholders' equity | 55,263 | 55,479 | 54,784 | 54,097 | 53,882 | |||||||||||
| Total shares outstanding | 3,419,736 | 3,419,736 | 3,419,736 | 3,419,736 | 3,419,736 | |||||||||||
| AVERAGE BALANCES (Dollars in thousands) | ||||||||||||||||
| Assets | $ | 487,304 | $ | 497,333 | $ | 494,481 | $ | 478,861 | $ | 488,320 | ||||||
| Loans | 396,197 | 397,665 | 378,250 | 380,066 | 385,296 | |||||||||||
| Deposits | 390,940 | 403,957 | 401,549 | 386,743 | 393,266 | |||||||||||
| Common Equity | 44,325 | 44,176 | 43,363 | 43,147 | 44,333 | |||||||||||
| Equity | 55,219 | 54,998 | 54,138 | 53,870 | 55,015 | |||||||||||
| INCOME STATEMENT (Dollars in thousands) | ||||||||||||||||
| Net interest income |
$ | 4,901 | $ | 4,709 | $ | 4,178 | $ | 4,141 | $ | 4,276 | ||||||
| Provision for loan losses | 1,300 | 400 | 600 | - | 1,800 | |||||||||||
| Net interest income after provision | 3,601 | 4,309 | 3,578 | 4,141 | 2,476 | |||||||||||
| Total noninterest income | 725 | 1,006 | 1,348 | 577 | 747 | |||||||||||
| Total noninterest expense | 4,221 | 3,960 | 3,729 | 4,059 | 4,037 | |||||||||||
| Income before taxes | 105 | 1,355 | 1,197 | 659 | (814 | ) | ||||||||||
| Provision for income taxes | 27 | 455 | 402 | 214 | 1,093 | |||||||||||
| Net income | 78 | 900 | 795 | 445 | (1,907 | ) | ||||||||||
| Preferred dividend expense | 192 | 193 | 192 | 189 | 185 | |||||||||||
| Net income available to common shareholders | $ | (114 | ) | $ | 707 | $ | 603 | $ | 256 | $ | (2,092 | ) | ||||
| PER SHARE DATA | ||||||||||||||||
| Earnings | $ | (.03 | ) | $ | .21 | $ | .18 | $ | .07 | $ | (.61 | ) | ||||
| Book value per common share | 12.97 | 13.05 | 12.86 | 12.67 | 12.63 | |||||||||||
| Market value, closing price | 5.42 | 5.46 | 6.00 | 6.02 | 4.58 | |||||||||||
| ASSET QUALITY RATIOS | ||||||||||||||||
| Nonperforming loans/total loans | 1.99 | % | 2.47 | % | 2.39 | % | 2.66 | % | 2.76 | % | ||||||
| Nonperforming assets/total assets | 2.24 | 2.99 | 2.89 | 3.05 | 3.37 | |||||||||||
| Allowance for loan losses/total loans | 1.31 | 1.49 | 1.56 | 1.65 | 1.73 | |||||||||||
| Allowance for loan losses/ nonperforming loans |
65.69 | 60.35 | 65.19 | 62.06 | 62.61 | |||||||||||
| Texas ratio (2) | 18.43 | 24.28 | 23.38 | 24.96 | 26.66 | |||||||||||
| PROFITABILITY RATIOS | ||||||||||||||||
| Return on average assets | (.09 | )% | .56 | % | .49 | % | .22 | % | (1.70 | )% | ||||||
| Return on average common equity | (1.02 | ) | 6.35 | 5.58 | 2.40 | (18.72 | ) | |||||||||
| Return on average equity | (.82 | ) | 5.10 | 4.47 | 1.92 | (15.09 | ) | |||||||||
| Net interest margin | 4.38 | 4.14 | 3.79 | 3.92 | 3.88 | |||||||||||
| Efficiency ratio | 67.51 | 67.39 | 67.84 | 75.73 | 65.05 | |||||||||||
| Average loans/average deposits | 101.34 | 98.44 | 94.20 | 98.27 | 97.97 | |||||||||||
| CAPITAL ADEQUACY RATIOS | ||||||||||||||||
| Tier 1 leverage ratio | 10.08 | % | 9.73 | % | 9.50 | % | 9.70 | % | 9.25 | % | ||||||
| Tier 1 capital to risk weighted assets | 11.62 | 11.65 | 11.40 | 11.61 | 11.36 | |||||||||||
| Total capital to risk weighted assets | 12.87 | 12.97 | 12.66 | 12.86 | 12.62 | |||||||||||
| Average equity/average assets | 11.33 | 11.06 | 10.95 | 11.25 | 11.27 | |||||||||||
| Tangible equity/tangible assets | 11.33 | 11.06 | 10.95 | 11.25 | 11.27 | |||||||||||
| (1) Noncore deposits includes Internet CDs, brokered deposits and CDs greater than $100,000 | ||||||||||||||||
| (2) Texas ratio equals nonperforming assets divided by shareholders' equity plus allowance for loan losses | ||||||||||||||||
Contact Information:
Contact:
Investor Relations
(888) 343-8147
Website: www.bankmbank.com