Mackinac Financial Corporation Announces Annual Results for 2006


MANISTIQUE, MI -- (MARKET WIRE) -- January 30, 2007 -- Mackinac Financial Corporation (NASDAQ: MFNC), the holding company for mBank, has reported net income of $1.716 million, or $.50 per share, for the year ended December 31, 2006, compared to a net loss of $7.364 million, or $2.15 per share, for 2005. Weighted average shares outstanding amounted to 3,428,695 in both years.

The 2006 operations include a $600,000 negative provision recorded in the first quarter, in recognition of improved credit quality, a $261,000 negative provision recorded in the fourth quarter to recognize a specific reserve reduction on a loan payoff, and a $500,000 deferred tax benefit recorded in the third quarter. The deferred tax benefit was recorded in accordance with generally accepted accounting principles for recognition of a portion of the benefits to be derived from NOL carry-forwards. The 2006 results also include $310,000 of stock option expense required under the new accounting rules for stock compensation plans, as well as $550,000 of expenses incurred to pursue legal action against the Corporation's former accountants. The costs associated with the pursuit of this legal action have surpassed our earlier estimates but management and the Corporation's Board of Directors believe the case has merit and pursuing it is in the best interests of our shareholders.

The 2005 loss of $7.364 million includes a number of significant one-time charges. Included are $4.320 million of penalties incurred to prepay $48.555 million of FHLB borrowings, $.815 million of costs associated with conversion of the Corporation's data processing system, approximately $500,000 of marketing expense to launch the new "mBank" name along with a new line of products and services, and lastly a $200,000 write-down of other real estate property.

Paul Tobias, Chairman and Chief Executive Officer, commented, "In 2006, the Corporation was extremely successful in generating new loans and deposits which enabled us to attain core profitability. This balance sheet growth provides the foundation in which to increase profits in future periods; however, in order to bring profitability in line with our peers and meet shareholder expectations we will need to improve our funding mix and constrain noninterest expenses."

Total assets of the Corporation at December 31, 2006 were $382.791 million, an increase of 28.1% from total assets of $298.722 million reported at December 31, 2005.

During 2006 the Corporation's loans stood at $322.581 million, an increase of $82.810 million from 2005 year-end balances of $239.771 million, a 34.5% increase. Total loan originations in 2006 amounted to $135.2 million.

Tobias stated, "We are extremely pleased with our team's ability to originate high quality loan relationships. This loan growth in 2006 along with our 2005 growth of $35.939 million demonstrates the effectiveness of our strategy in staffing our organization with experienced, highly skilled commercial lenders. In 2007 and beyond our ability to fund continued loan growth with a higher portion of in-market lower cost transactional deposits is another key variable for increased profitability."

Asset quality remains strong. Nonperforming loans, as a percent of loans, was .91% at December 31, 2006. Nonperforming assets at December 31, 2006 were $2.965 million, .77% of total assets, compared to $1.059 million or .35% of total assets at December 31, 2005. Tobias added, "During our rapid loan portfolio expansion, we have been diligent in our credit administration and have continued to focus on credit quality. Our process, which is administrated under a committee system, and anchored by strong underwriting, has proved effective in maintaining our strong credit quality. The increase in nonperforming assets reflects the impact of two large credits moving into the nonaccrual category. These credits were originated before our team arrived and in both instances, we are well reserved and have a strategy for adequate recovery."

Total deposits grew from $232.632 million at December 31, 2005 to $312.421 million at December 31, 2006, an increase of 34.3%. The increase includes a growth in core deposits of the Bank in the amount of $25.079 million, a 14.37% increase from 2005 year-end balances of $174.530 million, and increases in non-core deposits of $54.710 million, which include bank CDs greater than $100,000 and brokered deposits.

Net interest income for the year ended December 31, 2006 was $11.593 million compared to $9.780 million for the year ended December 31, 2005, an increase of $1.813 million. The margin percentage for 2006 was 3.51% compared to 3.64% in 2005. This decrease in the net interest margin is attributable to a number of factors. During 2006 the prime rate increased from 7.25% to 8.25%, which was beneficial to the Corporation since a majority of the commercial loan portfolio repriced upwards with each prime rate change. A factor which negatively impacted the margin in 2006 was the increased reliance on brokered deposits to fund loan growth. The Corporation also experienced a migration of deposits from low cost transactional accounts to higher cost money market accounts. Tobias commented, "We realize the importance of obtaining lower cost transactional deposits to maintain our interest margin. We have directed our efforts towards this need by staffing our branches with sales oriented branch managers supported by the right systems and products. We will be implementing appropriate incentives in 2007 to help reward the individuals that grow low cost deposits."

Shareholders' equity totaled $28.790 million at December 31, 2006 compared to $26.588 million at the end of 2005, an increase of $2.202 million. This increase reflects consolidated net income of $1.716 million, the capital contribution impact of stock options and also the increase in equity due to the increase in the market value of held-for-sale investments, which amounted to $.176 million. The book value per share at December 31, 2006 amounted to $8.40 compared to $7.75 at the end of 2005. Tobias concluded, "The increase in equity during 2006 reflects the return to profitability which is an important step towards our goal to generate top tier returns for our shareholders."

Mackinac Financial Corporation is a registered bank holding company which owns mBank. The Bank has 13 branch offices; nine in the Upper Peninsula of Michigan and four in Lower Michigan. The Company's banking services include commercial lending and treasury management products and services geared toward small to mid-sized businesses; as well as checking and savings accounts, time deposits, interest bearing transaction accounts, safe deposit facilities, real estate mortgage lending, and direct and indirect consumer financing.

This release contains certain forward-looking statements. Words such as "anticipates," "believes," "estimates," "expects," "intends," "should," "will," and variations of such words and similar expressions are intended to identify forward-looking statements: as defined by the Private Securities Litigation Reform Act of 1995. These statements reflect management's current beliefs as to expected outcomes of future events and are not guarantees of future performance. These statements involve certain risks, uncertainties and assumptions that are difficult to predict with regard to timing, extent, likelihood and degree of occurrence. Therefore, actual results and outcomes may materially differ from what may be expressed or forecasted in such forward-looking statements. Factors that could cause a difference include among others: changes in the national and local economies or market conditions; changes in interest rates and banking regulations; the impact of competition from traditional or new sources; and the possibility that anticipated cost savings and revenue enhancements from mergers and acquisitions, bank consolidations, branch closings and other sources may not be fully realized at all or within specified time frames as well as other risks and uncertainties including but not limited to those detailed from time to time in filings of the Company with the Securities and Exchange Commission. These and other factors may cause decisions and actual results to differ materially from current expectations. Mackinac Financial Corporation undertakes no obligation to revise, update, or clarify forward-looking statements to reflect events or conditions after the date of this release.


                 MACKINAC FINANCIAL CORPORATION AND SUBSIDIARIES
                         SELECTED FINANCIAL HIGHLIGHTS


                                                    For The Years Ended
                                                         December 31,
(Dollars in thousands,except per share data)          2006         2005
                                                  -----------  -----------
                                                  (Unaudited)   (Audited)
Selected Financial Condition Data (at end of
 period):
Total assets                                      $   382,791  $   298,722
Total loans                                           322,581      239,771
Total deposits                                        312,421      232,632
Borrowings and subordinated debentures                 38,307       36,417
Total shareholders' equity                             28,790       26,588


Selected Statements of Income Data:
Net interest income                               $    11,593  $     9,780
Income (loss) before taxes                              1,216       (7,364)
Net income (loss)                                       1,716       (7,364)
Income (loss) per common share - Basic                    .50        (2.15)
Income (loss) per common share - Diluted                  .50        (2.15)


Selected Financial Ratios and Other Data:
Performance Ratios:
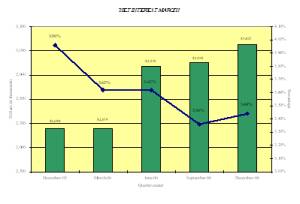
Net interest margin                                      3.51%        3.64%
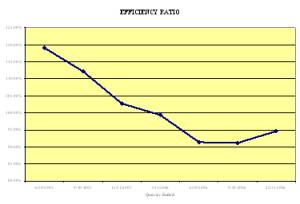
Efficiency ratio                                        93.95       160.43
Return on average assets                                  .49        (2.58)
Return on average equity                                 6.19       (25.63)

Average total assets                              $   347,927  $   285,896
Average total shareholders' equity                     27,744       28,732
Average loans to average deposits ratio                 99.77%       98.17%


Common Share Data at end of period:
Market price per common share                     $     11.50  $      9.10
Book value per common share                       $      8.40  $      7.75
Common shares outstanding                           3,428,695    3,428,695
Weighted average shares outstanding                 3,428,695    3,428,695

Other Data at end of period:
Allowance for loan losses                         $     5,006  $     6,108
Non-performing assets                             $     2,965  $     1,059
Allowance for loan losses to total loans                 1.55%        2.55%
Non-performing assets to total assets                     .77%         .35%
Number of:
     Branch locations                                      13           12


                 MACKINAC FINANCIAL CORPORATION AND SUBSIDIARIES
                     CONSOLIDATED STATEMENTS OF OPERATIONS


(Dollars in thousands, except per share data)            December 31,
                                                      2006         2005
                                                  -----------  -----------
ASSETS                                            (Unaudited)   (Audited)

Cash and due from banks                           $     4,865  $     4,833
Federal funds sold                                      5,841        3,110
                                                  -----------  -----------
    Cash and cash equivalents                          10,706        7,943

Interest-bearing deposits in other financial
 institutions                                             856        1,025
Securities available for sale                          32,769       34,210
Federal Home Loan Bank stock                            3,794        4,855

Loans:
  Commercial                                          261,726      192,826
  Mortgage                                             58,014       44,660
  Installment                                           2,841        2,285
                                                  -----------  -----------
    Total loans                                       322,581      239,771
      Allowance for loan losses                        (5,006)      (6,108)
                                                  -----------  -----------
  Net loans                                           317,575      233,663

Premises and equipment                                 12,453       11,987
Other real estate held for sale                            26          945
Other assets                                            4,612        4,094
                                                  -----------  -----------

TOTAL ASSETS                                      $   382,791  $   298,722
                                                  ===========  ===========


LIABILITIES AND SHAREHOLDERS' EQUITY

Liabilities:
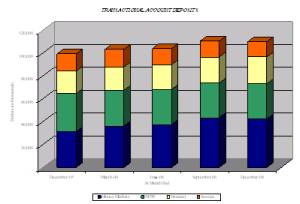
  Non-interest-bearing deposits                   $    23,471  $    19,684
  Interest-bearing deposits
    Money market                                       42,340       31,198
    NOW, Savings, and IRA                              53,079       55,923
    CDs < $100,000                                     80,719       67,725
    CDs > $100,000                                     23,645       12,335
    Brokered                                           89,167       45,767
                                                  -----------  -----------
      Total deposits                                  312,421      232,632

    Borrowings                                         38,307       36,417
    Other liabilities                                   3,273        3,085
                                                  -----------  -----------
      Total liabilities                               354,001      272,134

Shareholders' equity:
  Preferred stock - No par value:
      Authorized 500,000 shares, no shares
       outstanding                                          -            -
  Common stock and additional paid-in capital -
   No par value
      Authorized - 18,000,000 shares
      Issued and outstanding - 3,428,695 shares        42,720       42,412
  Retained earnings                                   (13,743)     (15,461)
  Accumulated other comprehensive income (loss)          (187)        (363)
                                                  -----------  -----------

      Total shareholders' equity                       28,790       26,588
                                                  -----------  -----------

TOTAL LIABILITIES AND SHAREHOLDERS' EQUITY        $   382,791  $   298,722
                                                  ===========  ===========


             MACKINAC FINANCIAL CORPORATION AND SUBSIDIARIES
                  CONSOLIDATED STATEMENTS OF OPERATIONS


(Dollars in thousands,                     For The Years Ended December 31,
 except per share data)                         2006      2005      2004
                                              --------  --------  --------
                                            (Unaudited) (Audited) (Audited)
Interest income:
   Interest and fees on loans:
      Taxable                                 $ 21,239  $ 13,862  $ 14,517
      Tax-exempt                                   753       928     1,180
   Interest on securities:
      Taxable                                    1,186     1,455     2,401
      Tax-exempt                                    87       167       171
   Other interest income                           787       564       584
                                              --------  --------  --------

      Total interest income                     24,052    16,976    18,853
                                              --------  --------  --------

Interest expnese:
   Deposits                                     10,575     5,259     5,443
   Borrowings                                    1,884     1,937     4,730
   Subordinated debentures                           -         -       442

      Total interest expense                    12,459     7,196    10,615
                                              --------  --------  --------

Net interest income                             11,593     9,780     8,238
                                              --------  --------  --------
Provision for loan losses                         (861)        -         -

                                              --------  --------  --------
Net interest income after provision for loan
 losses                                         12,454     9,780     8,238
                                              --------  --------  --------
Other income:
   Service fees                                    547       586       982
   Net gains on sale of loans                      197        49        39
   Loan and lease fees                              79        21        17
   Net security gains (losses)                      (1)       95         -
   Gain on sale of branches                          -         -       205
   Gain on settlement of subordinated
    debentures                                       -         -     6,617
   Other                                           161       360       682
                                              --------  --------  --------

      Total other income                           983     1,111     8,542
                                              --------  --------  --------

Other expenses:
   Salaries and employee benefits                6,132     6,090     8,032
   Occupancy                                     1,264     1,053       994
   Furniture and equipment                         631       560       887
   Data processing                                 691     1,720     1,220
   Accounting, legal and consulting fees         1,425       886     1,836
   Loan and deposit                                392       852     1,718
   Telephone                                       210       271       382
   Advertising                                     346       814       115
   Penalty on prepayment of FHLB borrowings          -     4,320         -
   Other                                         1,130     1,689     3,044
                                              --------  --------  --------

      Total other expenses                      12,221    18,255    18,228
                                              --------  --------  --------

Income (loss) before provision for income
 taxes                                           1,216    (7,364)   (1,448)
Provision for (benefit of) income taxes           (500)        -       147
                                              --------  --------  --------
Net income (loss)                             $  1,716  $ (7,364) $ (1,595)
                                              --------  --------  --------
Income (loss) per common share:
   Basic                                      $    .50  $  (2.15) $  (3.23)
                                              ========  ========  ========
   Diluted                                    $    .50  $  (2.15) $  (3.23)
                                              ========  ========  ========


             MACKINAC FINANCIAL CORPORATION AND SUBSIDIARIES
                    LOAN PORTFOLIO AND CREDIT QUALITY

(Dollars in thousands)

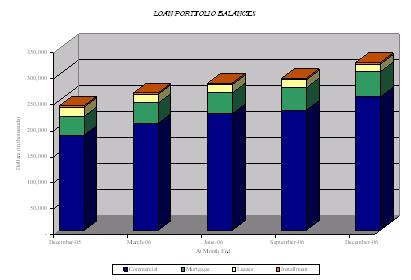
Loan Portfolio Balances (at end of period):

                                                          December 31,
                                                        2006       2005
                                                     ---------- ----------
Commercial Loans
Real estate - operators of nonresidential buildings  $   44,308 $   28,217
Hospitality and tourism                                  30,826     37,681
Real estate agents and managers                          25,071     10,588
New car dealers                                          10,086      9,995
Other                                                   115,426     88,842
                                                     ---------- ----------
   Total Commercial Loans                               225,717    175,323

1-4 family residential real estate                       58,014     44,660
Consumer                                                  2,841      2,285
Construction                                             36,009     17,503
                                                     ---------- ----------

   Total Loans                                       $  322,581 $  239,771
                                                     ========== ==========


Credit Quality (at end of period):


                                                         December 31,
                                                       2006        2005
                                                    ----------  ----------
Nonperforming Assets
Nonaccrual loans                                    $    2,899  $       15
Loans past due 90 days or more                              40          99
Restructured loans                                           -           -
                                                    ----------  ----------
   Total nonperforming loans                             2,939         114
Other real estate owned                                     26         945
                                                    ----------  ----------
   Total nonperforming assets                       $    2,965  $    1,059
                                                    ==========  ==========
Nonperforming loans as a % of loans                        .91%        .05%
                                                    ----------  ----------
Nonperforming assets as a % of assets                      .77%        .35%
                                                    ----------  ----------
Reserve for Loan Losses:
At period end                                       $    5,006  $    6,108
                                                    ----------  ----------
As a % of loans                                           1.55%       2.55%
                                                    ----------  ----------
As a % of nonperforming loans                           170.33%   5,357.89%
                                                    ----------  ----------
As a % of nonaccrual loans                              172.68%        N/M%
                                                    ==========  ==========

Charge-off Information:
   Average loans                                    $  278,953  $  207,928
                                                    ----------  ----------
   Net charge-offs                                  $      241  $      858
                                                    ----------  ----------
   Charge-offs as a % of average loans                     .09%        .41%
                                                    ----------  ----------


            MACKINAC FINANCIAL CORPORATION AND SUBSIDIARIES
                   QUARTERLY FINANCIAL HIGHLIGHTS


                                           QUARTER ENDED
                        ------------------------------------------------
                         Dec 31,   Sept 30,  June 30,  March 31,  Dec 31,
                          2006      2006      2006      2006       2005
                        --------- --------- --------- --------- ---------
BALANCE SHEET (Dollars
in thousands)

Total loans             $ 322,581 $ 292,614 $ 283,110 $ 264,471 $ 239,771
Allowance for loan
 losses                    (5,006)   (5,316)   (5,415)   (5,415)   (6,108)
                        --------- --------- --------- --------- ---------
   Total loans, net       317,575   287,298   277,695   259,056   233,663
Intangible assets             205       237       268       299       330
Total assets              382,791   363,191   352,497   334,591   298,722
Core deposits             199,609   195,774   185,784   183,438   174,530
Noncore deposits (1)      112,812    97,720    98,380    84,516    58,102
                        --------- --------- --------- --------- ---------
   Total deposits         312,421   293,494   284,164   267,954   232,632
Total borrowings           38,307    38,307    37,617    36,417    36,417
Total shareholders'
 equity                    28,790    28,226    27,179    27,173    26,588
Total shares
 outstanding            3,428,695 3,428,695 3,428,695 3,428,695 3,428,695

INCOME STATEMENT (Dollars
 in thousands)

Net interest income     $   3,027 $   2,952 $   2,935 $   2,679 $   2,680
Provision for loan
 losses                      (261)        -         -      (600)        -
                        --------- --------- --------- --------- ---------
   Net interest income
    after provision         3,288     2,952     2,935     3,279     2,680
Total noninterest income      276       240       251       216       303
Total noninterest
 expense                    3,226     3,002     2,996     2,997     4,011
                        --------- --------- --------- --------- ---------
Income before taxes           338       190       190       498    (1,028)
Provision for income
 taxes                          -      (500)        -         -         -
                        --------- --------- --------- --------- ---------
Net income              $     338 $     690 $     190 $     498 $  (1,028)
                        ========= ========= ========= ========= =========

PER SHARE DATA

Earnings per share -
 basic                  $     .10 $     .20 $     .05 $     .15 $    (.30)
Earnings per share -
 diluted                      .10       .20       .05       .15      (.30)
Book value per share         8.40      8.23      7.93      7.93      7.75

ASSET QUALITY RATIOS

Nonperforming loans/total
 loans                        .91%      .71%      .16%      N/M%      .05%
Nonperforming
 assets/total assets          .77       .58       .14       .28       .35
Allowance for loan
 losses/total loans          1.55      1.82      1.91      2.05      2.55
Allowance for loan
 losses/nonperforming
 loans                     170.33    257.43  1,214.13       N/M  5,357.89

PROFITABILITY RATIOS

Return on average assets      .37%      .75%      .22%      .63%    (1.41)%
Return on average equity     4.68      9.76      2.82      7.47    (14.95)
Net interest margin          3.44      3.36      3.62      3.62      3.96
Efficiency ratio            94.60     91.17     91.41     99.37    128.37
Average loans/average
 deposits                  102.29     97.51     99.67     98.44    102.01

CAPITAL ADEQUACY RATIOS

Leverage ratio               7.85      7.81      8.04      8.54      9.23
Tier 1 capital ratio         8.77      9.36      9.28      9.74     10.57
Total capital ratio         10.02     10.62     10.54     11.00     11.84
Average equity/average
 assets                      7.81      7.73      7.94      8.48      9.45
Tangible equity/tangible
 assets                      7.47      7.71      7.64      8.04      8.80


(1)  Noncore deposits includes brokered deposits and CDs greater than
     $100,000

Contact Information: Contact: Investor Relations (888) 343-8147 Website: www.bankmbank.com