Mackinac Financial Corporation Reports First Quarter 2007 Results


MANISTIQUE, MI -- (MARKET WIRE) -- April 26, 2007 -- Mackinac Financial Corporation (NASDAQ: MFNC), the bank holding company for mBank (the "Bank") today announced first quarter 2007 income of $1.035 million or $.30 per share compared to net income of $.498 million, or $.15 per share for the first quarter of 2006. Weighted average shares outstanding amounted to 3,428,695 in both periods.

The results of operations for the first quarter of 2007 include the proceeds received, $470,000, in the settlement of a lawsuit against the Corporation's former accountants. The first quarter 2006 results include a $600,000 negative loan loss provision. Excluding the lawsuit settlement and the provision adjustment, the net income in the first quarter of 2007 amounted to $.568 million, compared to a loss of .102 million for the same period in 2006.

Paul Tobias, Chairman and Chief Executive Officer, commented, "We are pleased that our earnings are beginning to reflect the progress we have made in growing our loan portfolio and capturing deposit market share. Our 2007 operating plan calls for additional growth in loans and deposits and an improved deposit mix. If we accomplish our goals we expect our profitability to continue to improve."

Total assets of the Corporation at March 31, 2007 were $375.644 million, up 12.27 percent from the $334.591 million in total assets reported at March 31, 2006. First quarter-end total assets were down 1.87 percent from the $382.791 million of total assets at year-end 2006.

Total loans at March 31, 2007 were $318.421 million, a 20.4% increase from the $264.471 million at March 31, 2006. Total loans at the end of the first quarter of 2007 decreased $4.160 million, or 1.29 percent from year-end 2006 total loans of $322.581 million. Tobias stated, "Loan growth in the first quarter was retarded by large paydowns amounting to $22.8 million; however, our first quarter new loan production was strong at $26.6 million, which should translate into solid growth in the near term as these loans fund. We are also seeing good loan demand in all of our markets and expect to see solid loan production for the remainder of 2007 in spite of the troubles in our Michigan economy."

Total deposits of $304.412 million at March 31, 2007 were up 13.61 percent from deposits of $267.954 million on March 31, 2006. Deposits were down 2.56 percent from year-end 2006 deposits of $312.421 million. Deposit growth declined in the 2007 first quarter largely due to decreases in wholesale brokered deposits totaling $10.8 million. Our core deposit account balances actually increased by $1.920 million in the first quarter. Mr. Tobias added, "As we grow our loan portfolio, we are working hard to develop core deposit funding in order to maintain adequate interest margins and support our increased profitability objectives. We continue to supplement our northern branch system by offering highly competitive rates, lower fees and account costs, efficient internet banking, remote deposit capture, and courier services. We have recently added three treasury management specialists to further enhance our ability to generate business related deposits."

Nonperforming assets at the end of the first quarter of 2007 totaled $4.989 million which was up $2.024 million from 2006 year end balances. This first quarter increase is not indicative of any overall deterioration in portfolio credit quality and is still relatively low by comparative peer standards, at 1.33%. Tobias, commenting on credit quality, stated, "The nonperforming assets are credits that we have been following since the recapitalization and we believe that we are adequately reserved. The strength of credit in our portfolio allows our lending staff to concentrate on new loan production. Our credit process also includes an aggressive early resolution process for nonperforming assets, which limits our losses."

Shareholders' equity at March 31, 2007 totaled $29.932 million, or $8.73 per share, compared to $27.173 million, or $7.93 per share on March 31, 2006.

Tobias concluded, "We are pleased with our first quarter net income results. Loan balances, as mentioned were significantly impacted by large loan paydowns and we do expect that we will resume our recent growth trends in the second quarter and for the remainder of 2007. We also expect increased core deposit growth aided by our recent staffing additions, to help us continue to move towards and then beyond peer profitability levels."

Mackinac Financial Corporation is a registered bank holding company which owns mBank. The Bank has 13 offices; nine in the Upper Peninsula, three in the Northern Lower Peninsula and one in Oakland County, Michigan. The Company's banking services include commercial lending and treasury management products and services geared toward small to mid-sized businesses; as well as checking and savings accounts, time deposits, interest bearing transaction accounts, safe deposit facilities, real estate mortgage lending, and direct and indirect consumer financing.

Forward-Looking Statements

This release contains certain forward-looking statements. Words such as "anticipates," "believes," "estimates," "expects," "intends," "should," "will," and variations of such words and similar expressions are intended to identify forward-looking statements: as defined by the Private Securities Litigation Reform Act of 1995. These statements reflect management's current beliefs as to expected outcomes of future events and are not guarantees of future performance. These statements involve certain risks, uncertainties and assumptions that are difficult to predict with regard to timing, extent, likelihood and degree of occurrence. Therefore, actual results and outcomes may materially differ from what may be expressed or forecasted in such forward-looking statements. Factors that could cause a difference include among others: changes in the national and local economies or market conditions; changes in interest rates and banking regulations; the impact of competition from traditional or new sources; and the possibility that anticipated cost savings and revenue enhancements from mergers and acquisitions, bank consolidations, branch closings and other sources may not be fully realized at all or within specified time frames as well as other risks and uncertainties including but not limited to those detailed from time to time in filings of the Company with the Securities and Exchange Commission. These and other factors may cause decisions and actual results to differ materially from current expectations. Mackinac Financial Corporation undertakes no obligation to revise, update, or clarify forward-looking statements to reflect events or conditions after the date of this release.


           MACKINAC FINANCIAL CORPORATION AND SUBSIDIARIES
                 SELECTED FINANCIAL HIGHLIGHTS


(Dollars in thousands, except per share data)


                                             For The Period Ended
                                     -------------------------------------
                                      March 31,   December 31,   March 31,
                                         2007         2006         2006
                                     -----------  -----------  -----------
                                     (Unaudited)               (Unaudited)
Selected Financial Condition Data
 (at end of period):
Total assets                         $   375,644  $   382,791  $   334,591
Total loans                              318,421      322,581      264,471
Total deposits                           304,412      312,421      267,954
Borrowings and subordinated
 debentures                               38,307       38,307       36,417
Total shareholders' equity                29,932       28,790       27,173


Selected Statements of Income Data:
Net interest income                  $     3,178  $    11,593  $     3,279
Income  (loss) before taxes                1,035        1,216          498
Net income (loss)                          1,035        1,716          498
Income (loss) per common share -
 Basic                                       .30          .50          .15
Income (loss) per common share -
 Diluted                                     .30          .50          .15


Selected Financial Ratios and Other
 Data:
Performance Ratios:
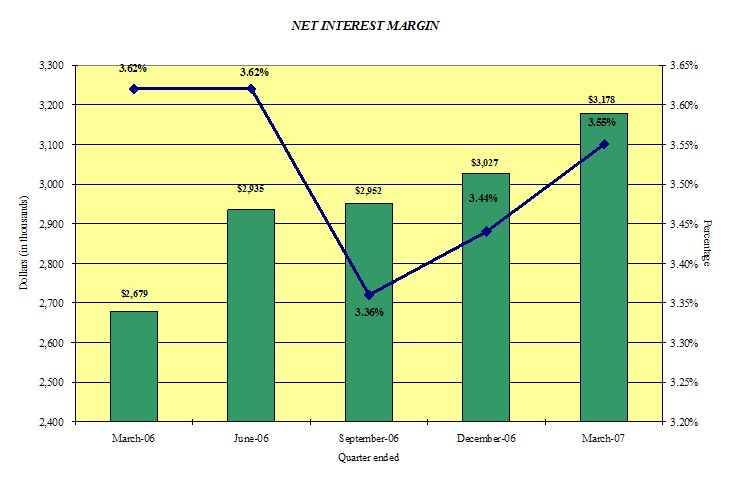
Net interest margin                         3.55%        3.51%        3.62%
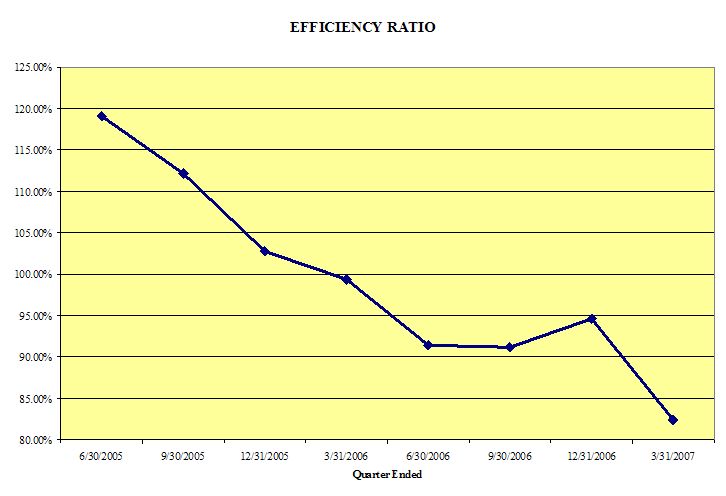
Efficiency ratio                           82.40        93.95        82.88
Return on average assets                    1.10          .49          .63
Return on average equity                   14.35         6.19         7.47

Average total assets                 $   380,403  $   347,927  $   319,007
Average total shareholders' equity        29,254       27,744       27,055
Average loans to average deposits
 ratio                                    102.73%       99.77%      126.73%


Common Share Data (at end of
 period):
Market price per common share        $      9.26  $     11.50  $      9.81
Book value per common share          $      8.73  $      8.40  $      7.93
Common shares outstanding              3,428,695    3,428,695    3,428,695
Weighted average shares outstanding    3,428,695    3,428,695    3,428,695

Other Data (at end of period):
Allowance for loan losses            $     4,975  $     5,006  $     5,415
Non-performing assets                $     4,989  $     2,965  $       952
Allowance for loan losses to total
 loans                                      1.56%        1.55%        2.05%
Non-performing assets to total
 assets                                     1.33%         .77%         .28%
Number of:
     Branch locations                         13           13           13
     FTE Employees                           104           99          105


           MACKINAC FINANCIAL CORPORATION AND SUBSIDIARIES
                 CONSOLIDATED BALANCE SHEETS


                                      March 31,   December 31,  March 31,
(Dollars in thousands)                   2007         2006         2006
                                     -----------  -----------  -----------
                                     (unaudited)               (unaudited)
ASSETS

Cash and due from banks              $     5,647  $     4,865  $     6,220
Federal funds sold                         6,330        5,841       12,000
                                     -----------  -----------  -----------
   Cash and cash equivalents              11,977       10,706       18,220

Interest-bearing deposits in other
 financial institutions                      856          856          853
Securities available for sale             28,511       32,769       34,140
Federal Home Loan Bank stock               3,794        3,794        4,855

Loans:
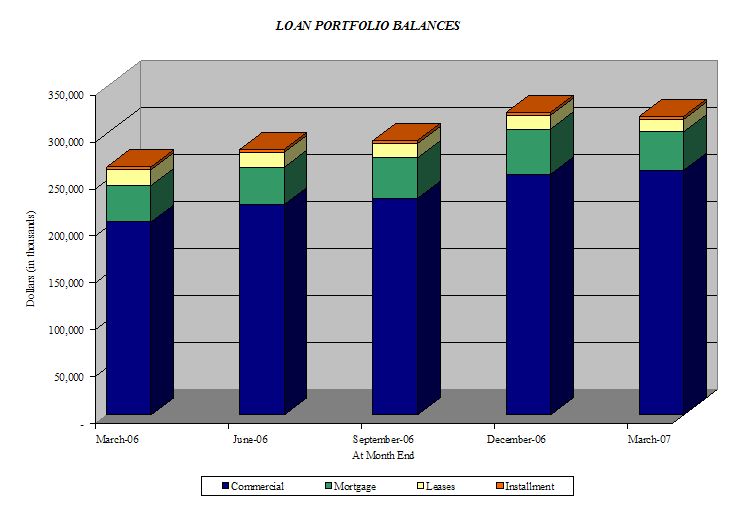
   Commercial                            261,246      261,726      212,052
   Mortgage                               54,204       58,014       50,119
   Installment                             2,971        2,841        2,300
                                     -----------  -----------  -----------
     Total Loans                         318,421      322,581      264,471
       Allowance for loan losses          (4,975)      (5,006)      (5,415)
                                     -----------  -----------  -----------
   Net loans                             313,446      317,575      259,056

Premises and equipment                    12,252       12,453       12,318
Other real estate held for sale              127           26          952
Other assets                               4,681        4,612        4,197
                                     -----------  -----------  -----------

TOTAL ASSETS                         $   375,644  $   382,791  $   334,591
                                     ===========  ===========  ===========

LIABILITIES AND SHAREHOLDERS' EQUITY
Liabilities:
   Non-interest-bearing deposits     $    23,416  $    23,471  $    20,463
   Interest-bearing deposits
     NOW and Money Market                 70,558       73,188       67,467
     Savings                              13,488       13,365       15,304
     CDs < $100,000                       94,067       89,585       80,204
     CDs > $100,000                       24,475       23,645       15,246
     Brokered                             78,408       89,167       69,270
                                     -----------  -----------  -----------
       Total deposits                    304,412      312,421      267,954

   Borrowings                             38,307       38,307       36,417
   Other liabilities                       2,993        3,273        3,047
                                     -----------  -----------  -----------
     Total liabilities                   345,712      354,001      307,418

Shareholders' equity:
   Preferred stock - No par value:
    Authorized 500,000 shares, no
    shares outstanding
   Common stock and additional paid
    in capital - No par value
    Authorized - 18,000,000 shares
    Issued and outstanding -
    3,428,695 shares                      42,750       42,722       42,489
   Accumulated deficit                   (12,709)     (13,745)     (14,961)
   Accumulated other comprehensive
    (loss)                                  (109)        (187)        (355)
                                     -----------  -----------  -----------

       Total shareholders' equity         29,932       28,790       27,173
                                     -----------  -----------  -----------

TOTAL LIABILITIES AND SHAREHOLDERS'
 EQUITY                              $   375,644  $   382,791  $   334,591
                                     ===========  ===========  ===========


           MACKINAC FINANCIAL CORPORATION AND SUBSIDIARIES
                 CONSOLIDATED STATEMENTS OF OPERATIONS


(Dollars in thousands except per share data)         Three Months Ended
                                                          March 31,
                                                  -------------------------
                                                      2007         2006
                                                  ------------ ------------
                                                  (Unaudited)  (Unaudited)
INTEREST INCOME:
     Interest and fees on loans:
          Taxable                                 $      6,233 $     4,499
          Tax-exempt                                       171         194
     Interest on securities:
          Taxable                                          301         273
          Tax-exempt                                         -          41
     Other interest income                                 200         168
                                                  ------------ -----------
          Total interest income                          6,905       5,175
                                                  ------------ -----------

INTEREST EXPENSE:
     Deposits                                            3,222       2,080
     Borrowings                                            505         416
                                                  ------------ -----------
          Total interest expense                         3,727       2,496
                                                  ------------ -----------

Net interest income                                      3,178       2,679
Provision for loan losses                                    -        (600)
                                                  ------------ -----------
Net interest income after provision for loan
 losses                                                  3,178       3,279
                                                  ------------ -----------

OTHER INCOME:
     Service fees                                          161         111
     Net security gains                                      -           -
     Net gains on sale of secondary market loans           108          40
     Other                                                 644          65
                                                  ------------ -----------
          Total other income                               913         216
                                                  ------------ -----------

OTHER EXPENSES:
     Salaries and employee benefits                      1,738       1,594
     Occupancy                                             334         317
     Furniture and equipment                               157         156
     Data processing                                       171         154
     Professional service fees                             151         200
     Loan and deposit                                       72         129
     Telephone                                              58          49
     Advertising                                            92          70
     Other                                                 283         328
                                                  ------------ -----------
          Total other expenses                           3,056       2,997
                                                  ------------ -----------

Income before provision for income taxes                 1,035         498
Provision for (benefit of) income taxes                      -           -
                                                  ------------ -----------

NET INCOME                                        $      1,035 $       498
                                                  ============ ===========
INCOME PER COMMON SHARE:
     Basic                                        $        .30 $       .15
                                                  ============ ===========
     Diluted                                      $        .30 $       .15
                                                  ============ ===========


               MACKINAC FINANCIAL CORPORATION AND SUBSIDIARIES
                      LOAN PORTFOLIO AND CREDIT QUALITY


(Dollars in thousands)

Loan Portfolio Balances (at end of period):


                                           March 31, December 31, March 31,
                                              2007       2006       2006
                                           ---------- ---------- ----------
Commercial Loans
Real estate - operators of nonresidential
 buildings                                 $   44,155 $   44,308 $   32,440
Hospitality and tourism                        33,726     30,826     38,045
Real estate agents and managers                27,313     25,071     12,350
New car dealers                                10,139     10,086      9,988
Other                                         105,937    115,426     98,224
                                           ---------- ---------- ----------
   Total Commercial Loans                     221,270    225,717    191,047

1-4 family residential real estate             54,204     58,014     50,119
Consumer                                        2,971      2,841      2,300
Construction                                   39,976     36,009     21,005
                                           ---------- ---------- ----------

   Total Loans                             $  318,421 $  322,581 $  264,471
                                           ========== ========== ==========


Credit Quality (at end of period):

                                           March 31, December 31, March 31,
                                             2007       2006       2006
                                           ---------  ---------  ---------
Nonperforming Assets :
Nonaccrual loans                           $   4,142  $   2,899  $       -
Loans past due 90 days or more                   720         40          -
Restructured loans                                 -          -          -
                                           ---------  ---------  ---------
   Total nonperforming loans                   4,862      2,939          -
Other real estate owned                          127         26        952
                                           ---------  ---------  ---------
   Total nonperforming assets              $   4,989  $   2,965  $     952
                                           =========  =========  =========
Nonperforming loans as a % of loans             1.53%       .91%         -%
                                           ---------  ---------  ---------
Nonperforming assets as a % of assets           1.33%       .77%       .28%
                                           ---------  ---------  ---------
Reserve for Loan Losses:
At period end                              $   4,975  $   5,006  $   5,415
                                           ---------  ---------  ---------
As a % of loans                                 1.56%      1.55%      2.05%
                                           ---------  ---------  ---------
As a % of nonperforming loans                 102.32%    170.33%       N/A%
                                           ---------  ---------  ---------
As a % of nonaccrual loans                    120.11%    172.68%       N/A%
                                           =========  =========  =========


               MACKINAC FINANCIAL CORPORATION AND SUBSIDIARIES
                      QUARTERLY FINANCIAL HIGHLIGHTS


                                         QUARTER ENDED
                     -----------------------------------------------------
                     March 31,   Dec 31,    Sept 30,  June 30,   March 31,
                       2007       2006       2006       2006       2006
                     ---------  ---------  ---------  ---------  ---------
BALANCE SHEET
(Dollars in thousands)

Total loans          $ 318,421  $ 322,581  $ 292,614  $ 283,110  $ 264,471
Allowance for loan
 losses                 (4,975)    (5,006)    (5,316)    (5,415)    (5,415)
                     ---------  ---------  ---------  ---------  ---------
   Total loans, net    313,446    317,575    287,298    277,695    259,056
Intangible assets          182        205        237        268        299
Total assets           375,644    382,791    363,191    352,497    334,591
Core deposits          201,529    199,609    195,774    185,784    183,438
Noncore deposits (1)   102,883    112,812     97,720     98,380     84,516
                     ---------  ---------  ---------  ---------  ---------
   Total deposits      304,412    312,421    293,494    284,164    267,954
Total borrowings        38,307     38,307     38,307     37,617     36,417
Total shareholders'
 equity                 29,932     28,790     28,226     27,179     27,173
Total shares
 outstanding         3,428,695  3,428,695  3,428,695  3,428,695  3,428,695

INCOME STATEMENT
(Dollars in thousands)

Net interest income  $   3,178  $   3,027  $   2,952  $   2,935  $   2,679
Provision for loan
 losses                      -       (261)         -          -       (600)
                     ---------  ---------  ---------  ---------  ---------
   Net interest
    Income after
    provision            3,178      3,288      2,952      2,935      3,279
Total noninterest
 income                    913        276        240        251        216
Total noninterest
 expense                 3,056      3,226      3,002      2,996      2,997
                     ---------  ---------  ---------  ---------  ---------
Income before taxes      1,035        338        190        190        498
Provision for income
 taxes                       -          -       (500)         -          -
                     ---------  ---------  ---------  ---------  ---------
Net income           $   1,035  $     338  $     690  $     190  $     498
                     =========  =========  =========  =========  =========

PER SHARE DATA

Earnings per share -
 basic               $     .30  $     .10  $     .20  $     .05  $     .15
Earnings per share -
 diluted                   .30        .10        .20        .05        .15
Book value per share      8.73       8.40       8.23       7.93       7.93

ASSET QUALITY RATIOS

Nonperforming
 loans/total loans        1.53%       .91%       .71%       .16%       N/M%
Nonperforming
 assets/total assets      1.33        .77        .58        .14        .28
Allowance for loan
 losses/total loans       1.56       1.55       1.82       1.91       2.05
Allowance for loan
 losses/nonperforming
 loans                  102.32     170.33     257.43   1,214.13        N/M

PROFITABILITY RATIOS

Return on average
 assets                   1.10%       .37%       .75%       .22%       .63%
Return on average
 equity                  14.35       4.68       9.76       2.82       7.47
Net interest margin       3.55       3.44       3.36       3.62       3.62
Efficiency ratio         82.40      94.60      91.17      91.41      99.37
Average
 loans/average
 deposits               102.73     102.29      97.51      99.67      98.44

CAPITAL ADEQUACY
 RATIOS

Leverage ratio            7.85%      7.85%      7.81%      8.04%      8.54%
Tier 1 capital ratio      9.16       8.77       9.36       9.28       9.74
Total capital ratio      10.41      10.02      10.62      10.54      11.00
Average equity/average
 assets                   7.69       7.81       7.73       7.94       8.48
Tangible equity/tangible
 assets                   7.74       7.47       7.71       7.64       8.04


(1)  Noncore deposits includes Internet CDs, brokered deposits and CDs
     greater than $100,000

Contact Information: Contact: Investor Relations (888) 343-8147 Website: www.bankmbank.com