MANISTIQUE, MI--(Marketwired - Apr 30, 2013) - Mackinac Financial Corporation (
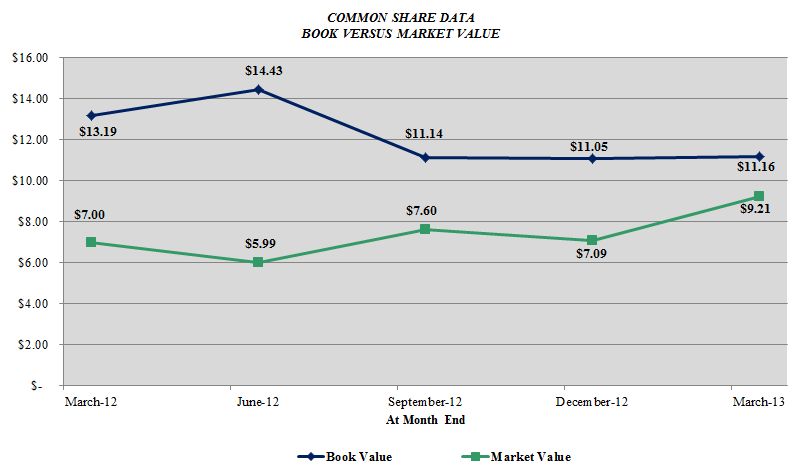
Shareholders' equity at March 31, 2013 totaled $73.039 million, compared to $56.095 million on March 31, 2012, an increase of $16.944 million. Book value of common shareholders' equity was $11.16 per share at March 31, 2013 compared to $13.19 per share at March 31, 2012. The increase in equity, between periods, includes the issuance of 2.138 million shares of common stock in August 2012 for net proceeds of $11.6 million. Weighted average shares outstanding totaled 5,559,859 shares in 2013 first quarter compared to 3,419,736 for the same period in 2012.
Some highlights for the first quarter include:
- New loan production of $39.8 million which encompassed $15.6 million of new commercial originations and $24.2 million of consumer loans predominantly mortgage related. The Upper Peninsula region accounted for $27.4 million of the new production with the Northern Lower Peninsula equating to $10.4 million and Southeast Michigan $2.0 million.
- Secondary mortgage loan income of $.299 million, compared to $.298 million in the first quarter of 2012.
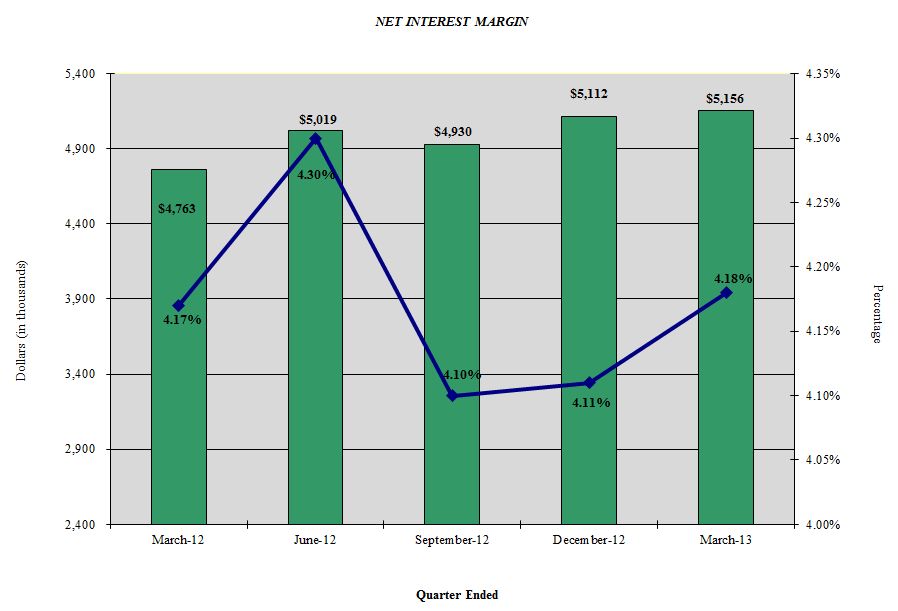
- Stable net interest margin holding up well at 4.18% compared to 4.17% for the first quarter of 2012.
- Improved credit quality with a Texas Ratio of 9.90% compared to 16.84% one year ago.
Loans and Non-performing Assets
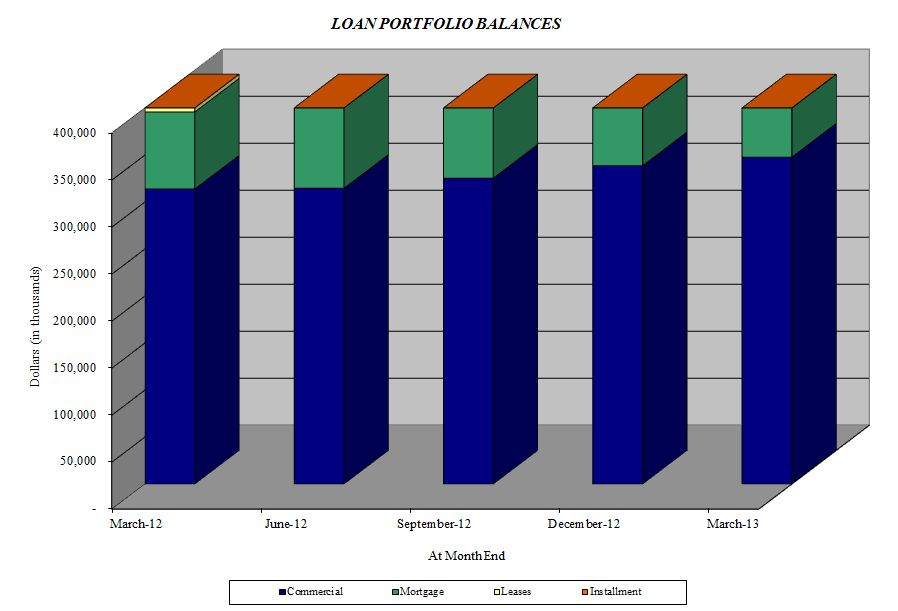
Total loans at March 31, 2013 were $454.051 million, a 9.57% increase from the $414.402 million at March 31, 2012 and up $4.874 million from year-end 2012 total loans of $449.177 million. Commenting on new loan production and overall loan growth, Kelly W. George, President and CEO of mBank stated, "We are still seeing good loan opportunities in all of our markets but have lost some transactions given interest rates and credit structures that did not work for our balance sheet and credit parameters. These were primarily in Southeast Michigan this quarter but all markets are experiencing highly competitive fixed rate commercial loan pricing. In addition, and consistent with previous years given the seasonality of our business primarily in the North, the extended winter and cold has delayed some economic progress for construction projects and just general borrowers overall ability to purchase and/or develop various commercial real estate transactions. We remain encouraged in the North with the 1-4 family mortgage lending activity continuing during this traditional slow period which should bode well for increased lending activities as we enter our peak mortgage lending periods within the late second and third quarters. Our pipeline remains strong too with already funded and waiting to be adjudicated SBA transactions which will lead to increased balance sheet growth and non-interest income generation in the next several quarters."
Nonperforming loans totaled $3.833 million, .84% of total loans at March 31, 2013 compared to $6.857 million, or 1.65% of total loans at March 31, 2012 and down $.854 million from December 31, 2012. Nonperforming assets were reduced by $2.693 million from a year ago and stood at 1.41% of total assets and equated to $7.7 million. Total loan delinquencies greater than 30 days resided at .50 % or $2.266 million. George, commenting on credit quality, stated, "Our overall loan portfolio and corresponding risk tolerance metrics continue to perform well with no material adverse items to note for this quarter. We remain diligent on overall new origination structures to not stretch our comfort zone for new loans, and we continue to timely identify any problems so they can be evaluated and actions plans put in place to either rehabilitate the credit or exit it from the bank. All remaining ORE properties continue to be assessed prudently for collateral valuations and we are confident in their current carrying levels."
Margin Analysis
Net interest margin in the first quarter of 2013 increased to $5.156 million, 4.18%, compared to $4.763 million, or 4.17%, in the first quarter of 2012. The interest margin increase was largely due to decreased overall funding costs. George stated, "We expect some margin pressure as we progress through the year due to increased competition on pricing for new loans and renewals which as noted above stunted our new loan growth this quarter. This resulted in our decision also to operate a little thinner on the liquidity side until the loan pipeline fully picked up given the seasonality of our business. We also remain timely in monitoring the liability side of the balance sheet by making any adjustments to our deposits rates based on market conditions to ensure we are maximizing our ability to maintain our interest spread."
Deposits
Total deposits of $425.236 million at March 31, 2013 increased by 3.19% from deposits of $412.088 million on March 31, 2012, however total deposits on March 31, 2013 were down $9.321 million from year-end 2012 deposits of $434.557 million. The overall decrease in deposits for the first three months of 2013 from year end is comprised of a decrease in core deposits, mostly in transactional accounts due to seasonal and some onetime cash needs of some of our larger commercial client relationships. George, commenting on core deposits, stated, "We have seen very good core deposit growth over the past several years and expect to see continued growth as we expand our customer relationships and also when our tourism season comes into full swing in later May. This continued low interest rate environment has impacted client decisions to remain in shorter term certificates or more liquid accounts as they wait out this period for increases in longer term fixed rate deposits."
Noninterest Income/Expense
Noninterest income, at $.758 million in the first quarter of 2013, increased $.152 million from the first quarter 2012 level of $.606 million with the largest drivers of this income coming from the secondary market mortgage area, which totaled $.299 million in the first quarter. Noninterest expense, at $4.311 million in the first quarter of 2013, increased $.477 million, or 12.44% from the first quarter of 2012. The largest increase from the first quarter of 2012 was in salaries and benefits which reflect several needed staff additions to augment lending/operational controls and sales throughout that 12 month period, and our customary salary and benefit annual awards for overall staff retention and incentive culture. The Corporation continues to look for ways to control costs and remains below peer levels in terms of salary and benefits as a percentage of total assets residing at 1.58%.
Assets and Capital
Total assets of the Corporation at March 31, 2013 were $541.896 million, up 6.99% from the $506.496 million reported at March 31, 2012 and down $4.084 million from the $545.980 million of total assets at year-end 2012. The decrease in assets was primarily due to a decrease in liquidity, as we experienced some seasonal deposit outflows and funded loan growth from cash on hand. Common shareholders' equity at March 31, 2012 totaled $62.039 million, or $11.16 per share, compared to $45.119 million, or $13.19 per share on March 31, 2012. This decrease in book value between periods reflects the impact of our 2012 capital raise when we issued 2.138 million shares of common stock for net proceeds of $11.6 million. The Corporation and the Bank are both "well-capitalized" with Tier 1 Capital at the Corporation of 12.23% and 9.95% at the Bank.
Paul D. Tobias, Chairman and Chief Executive Officer, concluded, "We are pleased with our first quarter operating results. Looking forward, we expect to complete our recently announced plan to redeem $7 million of our $11 million outstanding preferred stock early in the second quarter. This redemption was contemplated when we issued stock in August 2012, and we will redeem the balance of our preferred prior to the contractual increase in rate from the current 5% to 9% which would otherwise occur in April 2014."
Mackinac Financial Corporation is a registered bank holding company formed under the Bank Holding Company Act of 1956 with assets in excess of $500 million and whose common stock is traded on the NASDAQ stock market as "MFNC." The principal subsidiary of the Corporation is mBank. Headquartered in Manistique, Michigan, mBank has 11 branch locations; seven in the Upper Peninsula, three in the Northern Lower Peninsula and one in Oakland County, Michigan. The Company's banking services include commercial lending and treasury management products and services geared toward small to mid-sized businesses, as well as a full array of personal and business deposit products and consumer loans.
Forward-Looking Statements
This release contains certain forward-looking statements. Words such as "anticipates," "believes," "estimates," "expects," "intends," "should," "will," and variations of such words and similar expressions are intended to identify forward-looking statements: as defined by the Private Securities Litigation Reform Act of 1995. These statements reflect management's current beliefs as to expected outcomes of future events and are not guarantees of future performance. These statements involve certain risks, uncertainties and assumptions that are difficult to predict with regard to timing, extent, likelihood, and degree of occurrence. Therefore, actual results and outcomes may materially differ from what may be expressed or forecasted in such forward-looking statements. Factors that could cause a difference include among others: changes in the national and local economies or market conditions; changes in interest rates and banking regulations; the impact of competition from traditional or new sources; and the possibility that anticipated cost savings and revenue enhancements from mergers and acquisitions, bank consolidations, branch closings and other sources may not be fully realized at all or within specified time frames as well as other risks and uncertainties including but not limited to those detailed from time to time in filings of the Company with the Securities and Exchange Commission. These and other factors may cause decisions and actual results to differ materially from current expectations. Mackinac Financial Corporation undertakes no obligation to revise, update, or clarify forward-looking statements to reflect events or conditions after the date of this release.
| MACKINAC FINANCIAL CORPORATION AND SUBSIDIARIES | |||||||||||||
| SELECTED FINANCIAL HIGHLIGHTS | |||||||||||||
(Dollars in thousands, except per share data) |
March 31, 2013 |
December 31, 2012 |
March 31, 2012 |
||||||||||
| (Unaudited) | (Unaudited) | ||||||||||||
| Selected Financial Condition Data (at end of period): | |||||||||||||
| Assets | $ | 541,896 | $ | 545,980 | $ | 506,496 | |||||||
| Loans | 454,051 | 449,177 | 414,402 | ||||||||||
| Investment securities | 48,556 | 43,799 | 36,788 | ||||||||||
| Deposits | 425,236 | 434,557 | 412,088 | ||||||||||
| Borrowings | 40,925 | 35,925 | 35,997 | ||||||||||
| Common Shareholders' Equity | 62,039 | 61,448 | 45,119 | ||||||||||
| Shareholders' equity | 73,039 | 72,448 | 56,095 | ||||||||||
| Selected Statements of Income Data: | |||||||||||||
| Net interest income | $ | 5,156 | $ | 19,824 | $ | 4,763 | |||||||
| Income before taxes and preferred dividend | 1,228 | 6,165 | 1,040 | ||||||||||
| Net income | 676 | 6,458 | 498 | ||||||||||
| Income per common share - Basic | .12 | 1.51 | .12 | ||||||||||
| Income per common share - Diluted | .12 | 1.51 | .11 | ||||||||||
| Weighted average shares outstanding | 5,559,859 | 4,285,043 | 3,419,736 | ||||||||||
| Weighted average shares outstanding - Diluted | 5,559,859 | 4,285,043 | 3,524,953 | ||||||||||
| Selected Financial Ratios and Other Data: | |||||||||||||
| Performance Ratios: | |||||||||||||
| Net interest margin | 4.18 | % | 4.17 | % | 4.17 | % | |||||||
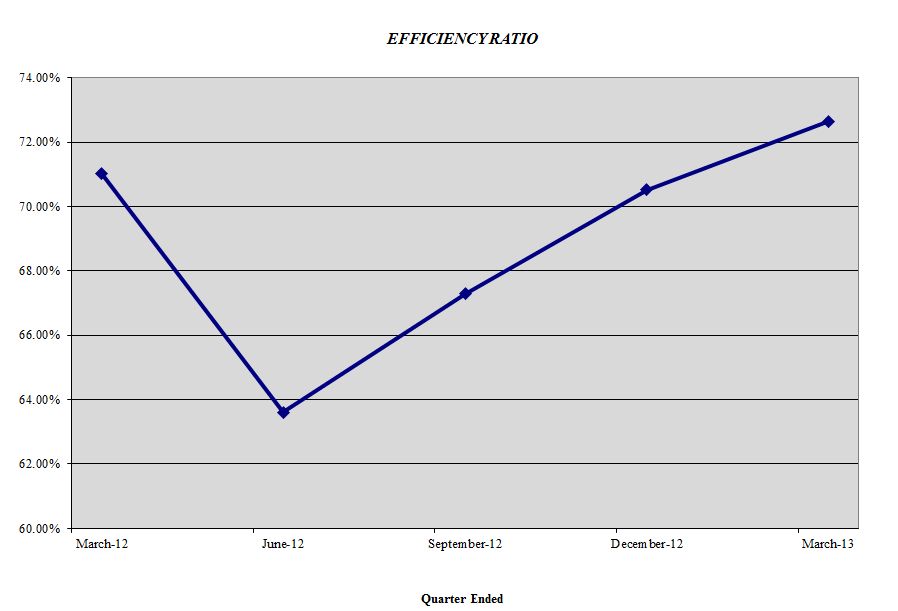
| Efficiency ratio | 72.65 | 67.95 | 71.01 | ||||||||||
| Return on average assets | .51 | 1.23 | .40 | ||||||||||
| Return on average common equity | 4.47 | 12.43 | 4.53 | ||||||||||
| Return on average equity | 3.79 | 10.26 | 3.62 | ||||||||||
| Average total assets | $ | 541,279 | $ | 526,740 | $ | 503,412 | |||||||
| Average common shareholders' equity | 61,238 | 51,978 | 44,229 | ||||||||||
| Average total shareholders' equity | 72,238 | 62,939 | 55,418 | ||||||||||
| Average loans to average deposits ratio | 104.63 | % | 99.45 | % | 98.73 | % | |||||||
| Common Share Data at end of period: | |||||||||||||
| Market price per common share | $ | 9.21 | $ | 7.09 | $ | 7.00 | |||||||
| Book value per common share | $ | 11.16 | $ | 11.05 | $ | 13.19 | |||||||
| Common shares outstanding | 5,557,859 | 5,559,859 | 3,419,736 | ||||||||||
| Other Data at end of period: | |||||||||||||
| Allowance for loan losses | $ | 5,037 | $ | 5,218 | $ | 5,382 | |||||||
| Non-performing assets | $ | 7,658 | $ | 7,899 | $ | 10,351 | |||||||
| Allowance for loan losses to total loans | 1.11 | % | 1.16 | % | 1.30 | % | |||||||
| Non-performing assets to total assets | 1.41 | % | 1.47 | % | 2.04 | % | |||||||
| Texas ratio | 9.90 | % | 10.25 | % | 16.96 | % | |||||||
| Number of: | |||||||||||||
| Branch locations | 11 | 11 | 11 | ||||||||||
| FTE Employees | 126 | 121 | 114 | ||||||||||
| MACKINAC FINANCIAL CORPORATION AND SUBSIDIARIES | |||||||||||||||
| CONSOLIDATED BALANCE SHEETS | |||||||||||||||
| March 31, | December 31, | March 31, | |||||||||||||
| 2013 | 2012 | 2012 | |||||||||||||
| (Unaudited) | (Unaudited) | ||||||||||||||
| ASSETS | |||||||||||||||
| Cash and due from banks | $ | 12,598 | $ | 26,958 | $ | 16,912 | |||||||||
| Federal funds sold | 3 | 3 | 14,000 | ||||||||||||
| Cash and cash equivalents | 12,601 | 26,961 | 30,912 | ||||||||||||
| Interest-bearing deposits in other financial institutions | 10 | 10 | 10 | ||||||||||||
| Securities available for sale | 48,556 | 43,799 | 36,788 | ||||||||||||
| Federal Home Loan Bank stock | 3,060 | 3,060 | 3,060 | ||||||||||||
| Loans: | |||||||||||||||
| Commercial | 345,032 | 342,841 | 318,810 | ||||||||||||
| Mortgage | 97,216 | 95,413 | 81,953 | ||||||||||||
| Consumer | 11,803 | 10,923 | 13,639 | ||||||||||||
| Total Loans | 454,051 | 449,177 | 414,402 | ||||||||||||
| Allowance for loan losses | (5,037 | ) | (5,218 | ) | (5,382 | ) | |||||||||
| Net loans | 449,014 | 443,959 | 409,020 | ||||||||||||
| Premises and equipment | 10,587 | 10,633 | 9,774 | ||||||||||||
| Other real estate held for sale | 3,825 | 3,212 | 3,494 | ||||||||||||
| Deferred tax asset | 8,726 | 9,131 | 7,958 | ||||||||||||
| Other assets | 5,517 | 5,215 | 5,480 | ||||||||||||
| TOTAL ASSETS | $ | 541,896 | $ | 545,980 | $ | 506,496 | |||||||||
| LIABILITIES AND SHAREHOLDERS' EQUITY | |||||||||||||||
| LIABILITIES: | |||||||||||||||
| Deposits: | |||||||||||||||
| Noninterest bearing deposits | $ | 57,547 | $ | 67,652 | $ | 52,470 | |||||||||
| NOW, money market, interest checking | 161,445 | 155,465 | 151,614 | ||||||||||||
| Savings | 13,273 | 13,829 | 13,601 | ||||||||||||
| CDs < $100,000 | 130,646 | 135,550 | 137,501 | ||||||||||||
| CDs > $100,000 | 24,619 | 24,355 | 24,066 | ||||||||||||
| Brokered | 37,706 | 37,706 | 32,836 | ||||||||||||
| Total deposits | 425,236 | 434,557 | 412,088 | ||||||||||||
| Borrowings: | |||||||||||||||
| Fed funds purchased | 5,000 | - | - | ||||||||||||
| FHLB and other | 35,925 | 35,925 | 35,997 | ||||||||||||
| Total borrowings | 40,925 | 35,925 | 35,997 | ||||||||||||
| Other liabilities | 2,696 | 3,050 | 2,316 | ||||||||||||
| Total liabilities | 468,857 | 473,532 | 450,401 | ||||||||||||
| SHAREHOLDERS' EQUITY: | |||||||||||||||
| Preferred stock - No par value: | |||||||||||||||
| Authorized 500,000 shares, Issued and outstanding - 11,000 shares | 11,000 | 11,000 | 10,976 | ||||||||||||
| Common stock and additional paid in capital - No par value | |||||||||||||||
| Authorized - 18,000,000 shares | |||||||||||||||
| Issued and outstanding - 5,557,859; 5,559,859; and 3,419,736 shares respectively | 53,888 | 53,797 | 43,525 | ||||||||||||
| Retained earnings | 7,181 | 6,727 | 990 | ||||||||||||
| Accumulated other comprehensive income | 970 | 924 | 604 | ||||||||||||
| Total shareholders' equity | 73,039 | 72,448 | 56,095 | ||||||||||||
| TOTAL LIABILITIES AND SHAREHOLDERS' EQUITY | $ | 541,896 | $ | 545,980 | $ | 506,496 | |||||||||
| MACKINAC FINANCIAL CORPORATION AND SUBSIDIARIES | ||||||||
| CONSOLIDATED STATEMENTS OF OPERATIONS | ||||||||
| Three Months Ended | ||||||||
| March 31, | ||||||||
| 2013 | 2012 | |||||||
| (Unaudited) | ||||||||
| INTEREST INCOME: | ||||||||
| Interest and fees on loans: | ||||||||
| Taxable | $ | 5,889 | $ | 5,580 | ||||
| Tax-exempt | 27 | 32 | ||||||
| Interest on securities: | ||||||||
| Taxable | 240 | 264 | ||||||
| Tax-exempt | 7 | 7 | ||||||
| Other interest income | 31 | 25 | ||||||
| Total interest income | 6,194 | 5,908 | ||||||
| INTEREST EXPENSE: | ||||||||
| Deposits | 877 | 983 | ||||||
| Borrowings | 161 | 162 | ||||||
| Total interest expense | 1,038 | 1,145 | ||||||
| Net interest income | 5,156 | 4,763 | ||||||
| Provision for loan losses | 375 | 495 | ||||||
| Net interest income after provision for loan losses | 4,781 | 4,268 | ||||||
| OTHER INCOME: | ||||||||
| Deposit service fees | 162 | 194 | ||||||
| Income from secondary market loans sold | 299 | 298 | ||||||
| SBA/USDA loan sale gains | 109 | - | ||||||
| Mortgage servicing income | 103 | 85 | ||||||
| Other | 85 | 29 | ||||||
| Total other income | 758 | 606 | ||||||
| OTHER EXPENSE: | ||||||||
| Salaries and employee benefits | 2,306 | 1,975 | ||||||
| Occupancy | 382 | 345 | ||||||
| Furniture and equipment | 270 | 228 | ||||||
| Data processing | 265 | 228 | ||||||
| Professional service fees | 225 | 180 | ||||||
| Loan and deposit | 73 | 141 | ||||||
| Writedowns and losses on other real estate held for sale | 2 | 11 | ||||||
| FDIC insurance assessment | 105 | 159 | ||||||
| Telephone | 82 | 55 | ||||||
| Advertising | 104 | 98 | ||||||
| Other | 497 | 414 | ||||||
| Total other expenses | 4,311 | 3,834 | ||||||
| Income before provision for income taxes | 1,228 | 1,040 | ||||||
| Provision for income taxes | 415 | 349 | ||||||
| NET INCOME | 813 | 691 | ||||||
| Preferred dividend and accretion of discount | 137 | 193 | ||||||
| NET INCOME AVAILABLE TO COMMON SHAREHOLDERS | $ | 676 | $ | 498 | ||||
| INCOME PER COMMON SHARE: | ||||||||
| Basic | $ | .12 | $ | .12 | ||||
| Diluted | $ | .12 | $ | .11 | ||||
| MACKINAC FINANCIAL CORPORATION AND SUBSIDIARIES | ||||||||||
| LOAN PORTFOLIO AND CREDIT QUALITY | ||||||||||
| (Dollars in thousands) | ||||||||||
| Loan Portfolio Balances (at end of period): | ||||||||||
| March 31, | December 31, | March 31, | ||||||||
| 2013 | 2012 | 2012 | ||||||||
| (Unaudited) | (Unaudited) | (Unaudited) | ||||||||
| Commercial Loans: | ||||||||||
| Real estate - operators of nonresidential buildings | $ | 94,828 | $ | 95,151 | $ | 78,769 | ||||
| Hospitality and tourism | 42,733 | 40,787 | 33,452 | |||||||
| Lessors of residential buildings | 13,162 | 12,672 | 15,460 | |||||||
| Insurance agencies and brokerages | 11,854 | 12,128 | 11,302 | |||||||
| Gasoline stations and convenience stores | 11,201 | 11,393 | 11,872 | |||||||
| Other | 154,959 | 153,481 | 145,839 | |||||||
| Total Commercial Loans | 328,737 | 325,612 | 296,694 | |||||||
| 1-4 family residential real estate | 89,629 | 87,948 | 81,953 | |||||||
| Consumer | 11,803 | 10,923 | 8,524 | |||||||
| Construction | ||||||||||
| Commercial | 16,295 | 17,229 | 22,116 | |||||||
| Consumer | 7,587 | 7,465 | 5,115 | |||||||
| Total Loans | $ | 454,051 | $ | 449,177 | $ | 414,402 | ||||
| Credit Quality (at end of period): | |||||||||||||
| March 31, | December 31, | March 31, | |||||||||||
| 2013 | 2012 | 2012 | |||||||||||
| (Unaudited) | (Unaudited) | (Unaudited) | |||||||||||
| Nonperforming Assets : | |||||||||||||
| Nonaccrual loans | $ | 3,833 | $ | 4,687 | $ | 4,457 | |||||||
| Loans past due 90 days or more | - | - | - | ||||||||||
| Restructured loans | - | - | 2,400 | ||||||||||
| Total nonperforming loans | 3,833 | 4,687 | 6,857 | ||||||||||
| Other real estate owned | 3,825 | 3,212 | 3,494 | ||||||||||
| Total nonperforming assets | $ | 7,658 | $ | 7,899 | $ | 10,351 | |||||||
| Nonperforming loans as a % of loans | .84 | % | 1.04 | % | 1.65 | % | |||||||
| Nonperforming assets as a % of assets | 1.41 | % | 1.45 | % | 2.04 | % | |||||||
| Reserve for Loan Losses: | |||||||||||||
| At period end | $ | 5,037 | $ | 5,218 | $ | 5,382 | |||||||
| As a % of average loans | 1.12 | % | 1.24 | % | 1.30 | % | |||||||
| As a % of nonperforming loans | 131.41 | % | 111.33 | % | 78.49 | % | |||||||
| As a % of nonaccrual loans | 131.41 | % | 111.33 | % | 120.75 | % | |||||||
| Texas Ratio | 9.90 | % | 10.25 | % | 16.96 | % | |||||||
| Charge-off Information (year to date): | |||||||||||||
| Average loans | $ | 449,065 | $ | 422,440 | $ | 380,066 | |||||||
| Net charge-offs | $ | 364 | $ | 978 | $ | 429 | |||||||
| Charge-offs as a % of average loans, annualized | .32 | % | .23 | % | .45 | % | |||||||
| MACKINAC FINANCIAL CORPORATION AND SUBSIDIARIES | ||||||||||||||||
| QUARTERLY FINANCIAL HIGHLIGHTS | ||||||||||||||||
| QUARTER ENDED | ||||||||||||||||
| (Unaudited) | ||||||||||||||||
| March 31, | December 31, | September 30, | June 30, | March 31, | ||||||||||||
| 2013 | 2012 | 2012 | 2012 | 2012 | ||||||||||||
| BALANCE SHEET (Dollars in thousands) | ||||||||||||||||
| Total loans | $ | 454,051 | $ | 449,177 | $ | 433,958 | $ | 419,453 | $ | 414,402 | ||||||
| Allowance for loan losses | (5,037 | ) | (5,218 | ) | (5,186 | ) | (5,083 | ) | (5,382 | ) | ||||||
| Total loans, net | 449,014 | 443,959 | 428,772 | 414,370 | 409,020 | |||||||||||
| Total assets | 541,896 | 545,980 | 551,117 | 524,366 | 506,496 | |||||||||||
| Core deposits | 362,911 | 372,496 | 372,500 | 357,933 | 355,186 | |||||||||||
| Noncore deposits (1) | 62,325 | 62,061 | 66,863 | 67,448 | 56,902 | |||||||||||
| Total deposits | 425,236 | 434,557 | 439,363 | 425,381 | 412,088 | |||||||||||
| Total borrowings | 40,925 | 35,925 | 35,925 | 35,997 | 35,997 | |||||||||||
| Common shareholders' equity | 62,039 | 61,448 | 61,945 | 49,352 | 45,119 | |||||||||||
| Total shareholders' equity | 73,039 | 72,448 | 72,945 | 60,352 | 56,095 | |||||||||||
| Total shares outstanding | 5,557,859 | 5,559,859 | 5,559,859 | 3,419,736 | 3,419,736 | |||||||||||
| Weighted average shares outstanding | 5,559,859 | 5,559,859 | 4,722,029 | 3,419,736 | 3,419,736 | |||||||||||
| AVERAGE BALANCES (Dollars in thousands) | ||||||||||||||||
| Assets | $ | 541,279 | $ | 545,661 | $ | 545,788 | $ | 511,681 | $ | 503,412 | ||||||
| Loans | 449,065 | 438,168 | 424,461 | 422,887 | 404,048 | |||||||||||
| Deposits | 429,174 | 433,573 | 439,327 | 452,655 | 409,250 | |||||||||||
| Common Equity | 61,238 | 61,936 | 56,327 | 44,927 | 44,469 | |||||||||||
| Equity | 72,238 | 72,936 | 67,327 | 55,915 | 55,418 | |||||||||||
| INCOME STATEMENT (Dollars in thousands) | ||||||||||||||||
| Net interest income | $ | 5,156 | $ | 5,112 | $ | 4,930 | $ | 5,019 | $ | 4,763 | ||||||
| Provision for loan losses | 375 | 150 | 150 | 150 | 495 | |||||||||||
| Net interest income after provision | 4,781 | 4,962 | 4,780 | 4,869 | 4,268 | |||||||||||
| Total noninterest income | 758 | 983 | 1,149 | 1,305 | 606 | |||||||||||
| Total noninterest expense | 4,311 | 4,349 | 4,367 | 4,207 | 3,834 | |||||||||||
| Income before taxes | 1,228 | 1,596 | 1,562 | 1,967 | 1,040 | |||||||||||
| Provision for income taxes | 415 | 536 | 528 | (2,335 | ) | 349 | ||||||||||
| Net income | 813 | 1,060 | 1,034 | 4,302 | 691 | |||||||||||
| Preferred dividend expense | 137 | 138 | 137 | 161 | 193 | |||||||||||
| Net income (loss) available to common shareholders | $ | 676 | $ | 922 | $ | 897 | $ | 4,141 | $ | 498 | ||||||
| PER SHARE DATA | ||||||||||||||||
| Earnings | $ | .12 | $ | .21 | $ | .21 | $ | .97 | $ | .12 | ||||||
| Book value per common share | 11.16 | 11.05 | 11.14 | 14.43 | 13.19 | |||||||||||
| Market value, closing price | 9.21 | 7.09 | 7.60 | 5.99 | 7.00 | |||||||||||
| ASSET QUALITY RATIOS | ||||||||||||||||
| Nonperforming loans/total loans | .84 | % | 1.07 | % | 1.23 | % | 1.28 | % | 1.65 | % | ||||||
| Nonperforming assets/total assets | 1.41 | 1.47 | 1.61 | 1.70 | 2.04 | |||||||||||
| Allowance for loan losses/total loans | 1.11 | 1.16 | 1.20 | 1.21 | 1.30 | |||||||||||
| Allowance for loan losses/nonperforming loans | 131.41 | 108.96 | 96.99 | 94.57 | 78.49 | |||||||||||
| Texas ratio (2) | 9.90 | 10.25 | 11.35 | 13.70 | 16.96 | |||||||||||
| PROFITABILITY RATIOS | ||||||||||||||||
| Return on average assets | .51 | % | .67 | % | .65 | % | 3.21 | % | .40 | % | ||||||
| Return on average common equity | 4.47 | 5.93 | 6.33 | 36.57 | 4.53 | |||||||||||
| Return on average equity | 3.79 | 5.03 | 5.29 | 29.39 | 3.62 | |||||||||||
| Net interest margin | 4.18 | 4.11 | 4.10 | 4.30 | 4.17 | |||||||||||
| Efficiency ratio | 72.65 | 70.52 | 67.29 | 63.61 | 71.01 | |||||||||||
| Average loans/average deposits | 104.63 | 99.45 | 96.62 | 101.50 | 98.73 | |||||||||||
| CAPITAL ADEQUACY RATIOS | ||||||||||||||||
| Tier 1 leverage ratio | 12.23 | % | 11.98 | % | 10.16 | % | 9.95 | % | 10.08 | % | ||||||
| Tier 1 capital to risk weighted assets | 13.98 | 13.81 | 12.87 | 11.55 | 11.62 | |||||||||||
| Total capital to risk weighted assets | 15.06 | 14.93 | 14.12 | 12.80 | 12.87 | |||||||||||
| Average equity/average assets | 13.16 | 13.37 | 10.93 | 11.01 | 11.33 | |||||||||||
| Tangible equity/tangible assets | 13.36 | 13.17 | 13.15 | 11.42 | 11.00 | |||||||||||
| (1) | Noncore deposits includes Internet CDs, brokered deposits and CDs greater than $100,000 | |
| (2) | Texas ratio equals nonperforming assets divided by shareholders' equity plus allowance for loan losses | |
Contact Information:
Contact:
Ernie R. Krueger
(906)341-7158
Website: www.bankmbank.com