MANISTIQUE, MI--(Marketwire - Jul 28, 2011) - Mackinac Financial Corporation (
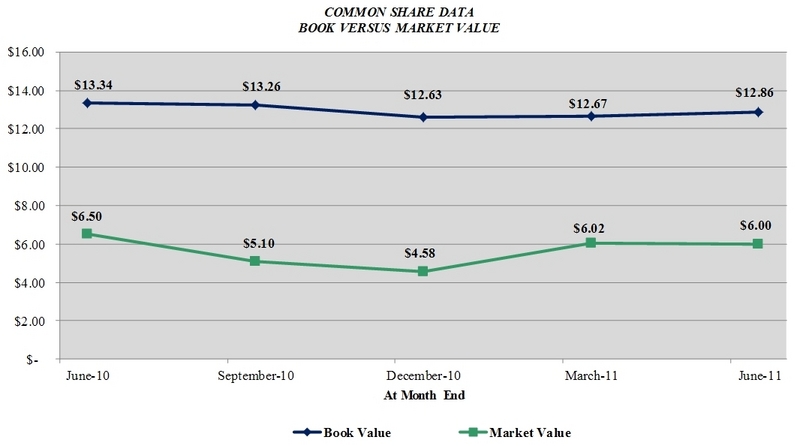
Total shareholders' equity at June 30, 2011 totaled $54.784 million, compared to $56.231 million on June 30, 2010, a decrease of $1.447 million, or 2.57%. Book value of common shareholders' equity was $12.86 per share at June 30, 2011 compared to $13.34 per share at June 30, 2010.
Weighted average shares outstanding totaled 3,419,736 for all periods. The common stock warrants outstanding of 379,310 shares were slightly dilutive, at approximately $.01 per share, for the 2011 second quarter, as the market value of our stock moved above the $4.35 strike price.
Some highlights for the second quarter and six month period included:
-
SBA/USDA loan sale premium income of $1.186 million year to date, exceeded all of 2010 totals, with a solid pipeline of new loans for sale entering into the third and fourth quarters. We continue to see good premiums in the 7% to 8% range on these transactions. This line of business has become a core competency and revenue driver to the company. mBank was ranked 10th in terms of the number of SBA 7A loans (21) and 9th in terms of the dollar volume ($12.3M) in the July 18, 2011 issue of Crains Magazine for the SBA period Oct 1, 2010 through March 31, 2011. This comparison is to all other banks in the state, some of who are much larger in size.
-
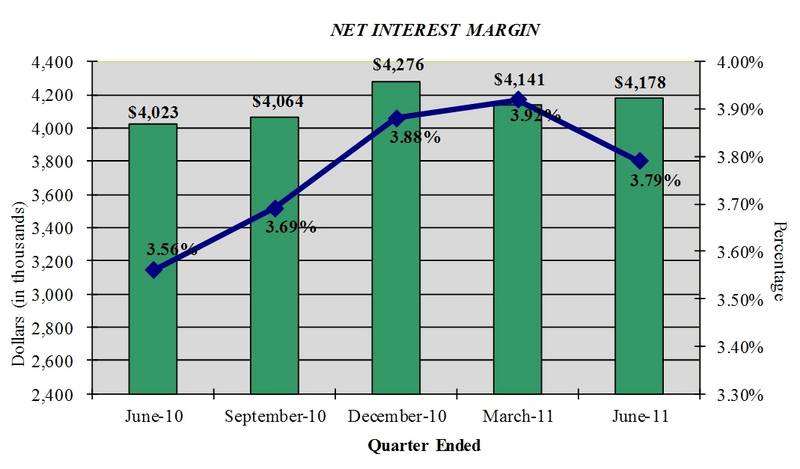
Improved net interest margin at 3.79% for the second quarter and 3.85% for the six month period of 2011.
-
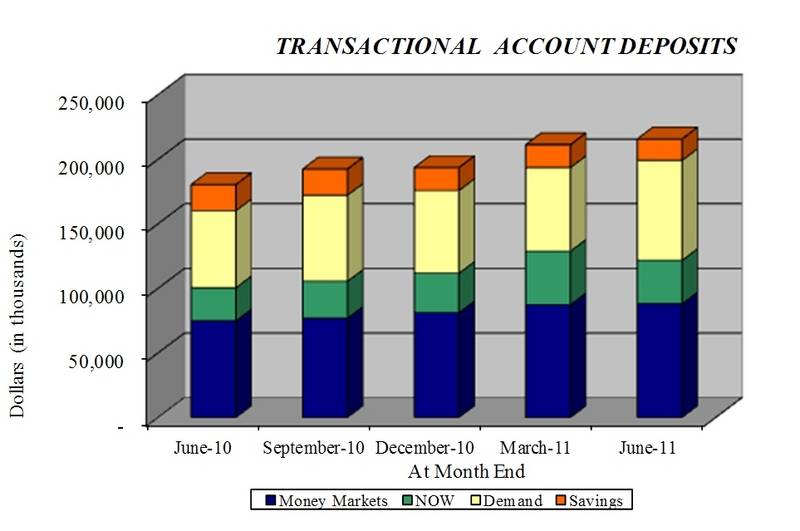
Core deposit growth of $39.344 million primarily in transactional accounts, accounting for $22.106 million of this growth for the first six months of 2011, which improved our funding mix.
-
ORE gains of $.035 million for the second quarter and losses of $.432 million for the six month period of 2011, compared to $1.845 million in losses in the second quarter of 2010 and YTD 2010 losses of $1.993 million.
-
In the second quarter and six month period of 2011, the Corporation recorded a provision for loan losses of $.600 million as compared to the $2.800 million and $3.700 million provision recorded in the second quarter and six month period of 2010.
-
Nonperforming assets at the end of the second quarter of 2011 totaled $14.247 million or a manageable 2.88% of total assets, a reduction of $1.878 million from 2010 year end balances. Non-accrual loans reside at a stable 1.93% of total loans.
Loans and Non-performing Assets
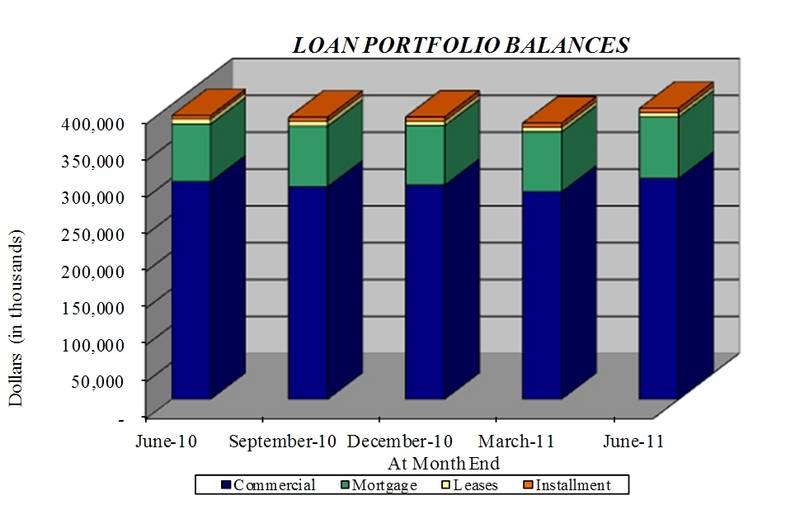
Total loans at June 30, 2011 were $394.812 million, a 2.59% increase from the $384.839 million at June 30, 2010 and up $11.726 million from year-end 2010 total loans of $383.086 million. Commenting on loan growth, Kelly W. George, President and CEO of mBank, stated, "Loan growth in the second quarter picked up dramatically with overall production of $56.1 million. Loans outstanding increased by $20.2 million in the 2011 second quarter despite SBA loan sales of $12.4 million along with normal amortization and principal runoff of approximately $28.2 million. Our current loan pipeline is good with a nice balance of SBA/USDA transactions along with more conventional financings in both the consumer and commercial segments of the business. The SBA government guaranteed funding programs continue to be a source of capital for many companies to expand their operations in the form of new equipment or buildings, to provide more jobs or in some ways to provide better structure to their overall debt picture. Our strongest region continues to be the Upper Peninsula with overall new loan production for the first half of the year residing at $73 million bank-wide, with the UP contributing $37.5 million, the Northern Lower Peninsula $26.5 million, and Southeast Michigan, $8.8 million."
The decrease in nonperforming assets in the second quarter is the result of continued diligence and aggressive remediation of problem borrowers and/or properties, and related workout programs in some circumstances where client loans have the propensity, based on improving financial and payment trends, to become earning assets once again for the bank. The added provision for this quarter was primarily the result of an older non-performing commercial loan relationship that has been going through the stages of legal and collections for over a year now. George, commenting on credit quality, stated: "We continue to aggressively market our OREO properties and believe our aggressive write-downs reflect current market values, and will result in further sales later this year. We remain highly focused on overall asset quality metrics given the still challenging overall Michigan economy but believe that the market is stabilizing. We are encouraged by our Texas Ratio of 23.38% for the quarter, which is among the lowest of the 15 largest public banks headquartered in Michigan."
Margin Analysis
Net interest margin in the second quarter of 2011 increased to $4.178 million, 3.79%, compared to $4.023 million, or 3.56%, in the second quarter of 2010 and the net interest margin in the first six months of 2011 increased to $8.319 million, 3.85%, compared to $8.045 million, or 3.53%, in the first six months of 2010. The interest margin increase was largely due to decreased funding costs. George stated, "We are disciplined in our deposit and loan pricing structures in order to minimize interest rate risk while maintaining and looking to grow current margins. We expect our margin to improve as we progress through the year with increased funding of new loans through lower cost transactional accounts and further repayment of longer-term maturing brokered deposits." On hand liquidity remains strong with over $25M of fed funds/cash and $28M of unpledged investments available to service depositor needs and fund new asset growth.
Deposits
Total deposits of $399.667 million at June 30, 2011 were down 1.51% from deposits of $405.784 million on June 30, 2010 due to decreased levels of brokered deposits, which declined from $111.106 million on June 30, 2010, to $46.607 million on June 30, 2011. Total deposits on June 30, 2011 deposits were up $12.888 million from year-end 2010 deposits of $386.779 million. The overall increase in deposits for the first six months of 2011 is comprised of a decrease in noncore deposits of $26.456 million which was offset with increased core deposits of $39.344 million. George, commenting on the increased core deposits, stated, "In the first half of 2011, we continued to grow core deposits at a steady rate. Our dependency on brokered deposits, which stood at 42% of total deposits at 2009 year-end, has decreased to 12% of deposits on June 30, 2011. We are extremely pleased with our deposit mix and we will continue to monitor all of our products and pricing to remain competitive and in order to maintain interest margins and preserve franchise value associated with core deposits."
Noninterest Income/Expense
Noninterest income, at $1.348 million in the second quarter of 2011, increased $.755 million from the second quarter 2010 level of $.593 million with the largest driver of this income being increased gains from the sale of SBA/USDA loans, which totaled $.950 million in the second quarter and $1.186 million for the six month period. Noninterest income, at $1.925 million in the first six months of 2011, increased $.525 million from the first six months of 2010 level of $1.400 million. Noninterest income in the first six months of 2010 also includes $.215 million of security gains which the Corporation does not consider recurring or a true core earnings provider on a year to year basis.
Noninterest expense, at $3.729 million in the second quarter of 2011, decreased $1.601 million, or 30.04% from the second quarter of 2010. Noninterest expense, at $7.788 million in the first six months of 2011, decreased $1.170 million, or 13.06% from the first six months of 2010 due primarily to lower losses and write-downs of ORE properties, which declined from $1.993 million of write-downs in 2010 to $.432 million in 2011. Our operating expenses in 2011 remain somewhat elevated due to the added cost of aggressive nonperforming asset remediation, along with an increase in FDIC insurance premiums of $.034 million. The Corporation continues to look for ways to control costs and remains below peer levels in terms of salary and benefits as a percentage of total assets residing at 1.47%.
Assets and Capital
Total assets of the Corporation at June 30, 2011 were $492.373 million, down 1.68% from the $500.774 million reported at June 30, 2010 and up 2.86% from the $478.696 million of total assets at year-end 2010. Common Shareholders' equity at June 30, 2011 totaled $43.973 million, or $12.86 per share, compared to $45.621 million, or $13.34 per share on June 30, 2010. The Corporation and the Bank are both "well-capitalized" with Tier 1 Capital at the Corporation of 9.50% and 8.51% at the Bank.
Paul D. Tobias, Chairman and Chief Executive Officer, concluded, "We are pleased with our operating results thus far in 2011 as we come out of the financial turmoil that has centered around Michigan for the last several years. We continue to build a strong balance sheet with a balanced portfolio of loans funded with in-market core deposits which translates into increased franchise value. We believe we have weathered the financial crisis and look forward to prudently expanding our franchise in the near term."
Mackinac Financial Corporation is a registered bank holding company formed under the Bank Holding Company Act of 1956 with assets in excess of $490 million and whose common stock is traded on the NASDAQ stock market as "MFNC." The principal subsidiary of the Corporation is mBank. Headquartered in Manistique, Michigan, mBank has 11 branch locations; seven in the Upper Peninsula, three in the Northern Lower Peninsula and one in Oakland County, Michigan. The Company's banking services include commercial lending and treasury management products and services geared toward small to mid-sized businesses, as well as a full array of personal and business deposit products and consumer loans.
Forward-Looking Statements
This release contains certain forward-looking statements. Words such as "anticipates," "believes," "estimates," "expects," "intends," "should," "will," and variations of such words and similar expressions are intended to identify forward-looking statements: as defined by the Private Securities Litigation Reform Act of 1995. These statements reflect management's current beliefs as to expected outcomes of future events and are not guarantees of future performance. These statements involve certain risks, uncertainties and assumptions that are difficult to predict with regard to timing, extent, likelihood, and degree of occurrence. Therefore, actual results and outcomes may materially differ from what may be expressed or forecasted in such forward-looking statements. Factors that could cause a difference include among others: changes in the national and local economies or market conditions; changes in interest rates and banking regulations; the impact of competition from traditional or new sources; and the possibility that anticipated cost savings and revenue enhancements from mergers and acquisitions, bank consolidations, branch closings and other sources may not be fully realized at all or within specified time frames as well as other risks and uncertainties including but not limited to those detailed from time to time in filings of the Company with the Securities and Exchange Commission. These and other factors may cause decisions and actual results to differ materially from current expectations. Mackinac Financial Corporation undertakes no obligation to revise, update, or clarify forward-looking statements to reflect events or conditions after the date of this release.
| MACKINAC FINANCIAL CORPORATION AND SUBSIDIARIES | ||||||||||||
| SELECTED FINANCIAL HIGHLIGHTS | ||||||||||||
| (Dollars in thousands, except per share data) | For The Period Ended | |||||||||||
| June 30, | December 31, | June 30, | ||||||||||
| 2011 | 2010 | 2010 | ||||||||||
| (Unaudited) | (Unaudited) | |||||||||||
| Selected Financial Condition Data (at end of period): | ||||||||||||
| Assets | $ | 492,373 | $ | 478,696 | $ | 500,774 | ||||||
| Loans | 394,812 | 383,086 | 384,839 | |||||||||
| Investment securities | 38,613 | 33,860 | 34,942 | |||||||||
| Deposits | 399,667 | 386,779 | 405,784 | |||||||||
| Borrowings | 36,069 | 36,069 | 36,140 | |||||||||
| Common shareholders' equity | 43,973 | 43,176 | 45,621 | |||||||||
| Total shareholders' equity | 54,784 | 53,882 | 56,231 | |||||||||
| Selected Statements of Income Data (six months and year ended): | ||||||||||||
| Net interest income | $ | 8,319 | $ | 16,385 | $ | 8,045 | ||||||
| Income (Loss) before taxes and preferred dividend | 1,856 | (3,918 | ) | (3,214 | ) | |||||||
| Net income | 859 | (1,160 | ) | 1,038 | ||||||||
| Income per common share - Basic | .25 | (.34 | ) | .30 | ||||||||
| Income per common share - Diluted | .25 | (.34 | ) | .30 | ||||||||
| Weighted average shares outstanding | 3,419,736 | 3,419,736 | 3,419,736 | |||||||||
| Three Months Ended: | ||||||||||||
| Net interest income | $ | 4,178 | $ | 4,276 | $ | 4,023 | ||||||
| Income (Loss) before taxes and preferred dividend | 1,197 | (814 | ) | (3,514 | ) | |||||||
| Net income (Loss) | 603 | (2,092 | ) | (2,488 | ) | |||||||
| Income (Loss) per common share - Basic | .18 | (.61 | ) | (.73 | ) | |||||||
| Income (Loss) per common share - Diluted | .17 | (.61 | ) | (.73 | ) | |||||||
| Selected Financial Ratios and Other Data (six months and year ended): | ||||||||||||
| Performance Ratios: | ||||||||||||
| Net interest margin | 3.85 | % | 3.66 | % | 3.53 | % | ||||||
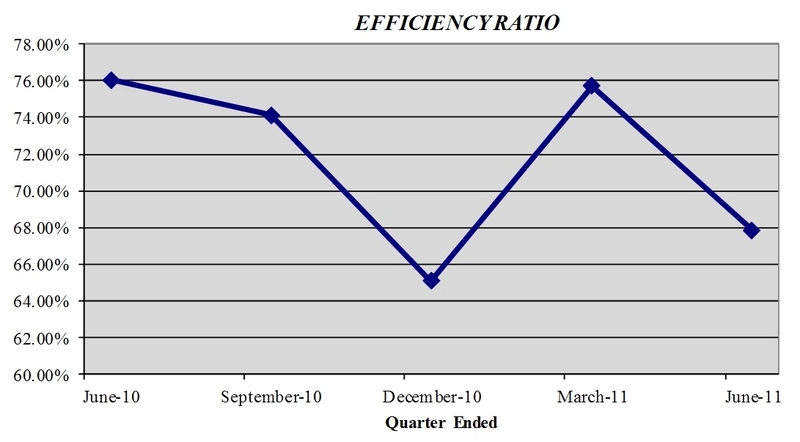
| Efficiency ratio | 71.47 | 72.57 | 77.08 | |||||||||
| Return on average assets | .36 | (.23 | ) | .41 | ||||||||
| Return on average common equity | 4.00 | (2.64 | ) | 4.56 | ||||||||
| Return on average total equity | 3.21 | (2.06 | ) | 3.70 | ||||||||
| Average total assets | $ | 486,714 | $ | 502,993 | $ | 505,703 | ||||||
| Average common shareholders' equity | $ | 43,255 | $ | 43,981 | $ | 45,951 | ||||||
| Average total shareholders' equity | $ | 54,005 | $ | 56,171 | $ | 56,506 | ||||||
| Average loans to average deposits ratio | 96.19 | % | 94.36 | % | 93.59 | % | ||||||
| Common Share Data (at end of period): | ||||||||||||
| Market price per common share | $ | 6.00 | $ | 4.58 | $ | 6.50 | ||||||
| Book value per common share | $ | 12.86 | $ | 12.63 | $ | 13.34 | ||||||
| Common shares outstanding | 3,419,736 | 3,419,736 | 3,419,736 | |||||||||
| Other Data (at end of period): | ||||||||||||
| Allowance for loan losses | $ | 6,155 | $ | 6,613 | $ | 6,371 | ||||||
| Non-performing assets | $ | 14,247 | $ | 16,125 | $ | 16,719 | ||||||
| Allowance for loan losses to total loans | 1.56 | % | 1.73 | % | 1.66 | % | ||||||
| Non-performing assets to total assets | 2.89 | % | 3.37 | % | 3.34 | % | ||||||
| Texas Ratio* | 23.38 | % | 26.66 | % | 26.71 | % | ||||||
| MACKINAC FINANCIAL CORPORATION AND SUBSIDIARIES | ||||||||||||||||
| CONSOLIDATED BALANCE SHEETS | ||||||||||||||||
| June 30, | December 31, | June 30, | ||||||||||||||
| (Dollars in thousands) | 2011 | 2010 | 2010 | |||||||||||||
| (Unaudited) | (Unaudited) | |||||||||||||||
| ASSETS | ||||||||||||||||
| Cash and due from banks | $ | 22,294 | $ | 22,719 | $ | 39,165 | ||||||||||
| Federal funds sold | 12,000 | 12,000 | 12,000 | |||||||||||||
| Cash and cash equivalents | 34,294 | 34,719 | 51,165 | |||||||||||||
| Interest-bearing deposits in other financial institutions | 10 | 713 | 678 | |||||||||||||
| Securities available for sale | 38,613 | 33,860 | 34,942 | |||||||||||||
| Federal Home Loan Bank stock | 3,060 | 3,423 | 3,794 | |||||||||||||
| Loans: | ||||||||||||||||
| Commercial | 305,752 | 297,047 | 302,228 | |||||||||||||
| Mortgage | 83,194 | 80,756 | 78,428 | |||||||||||||
| Installment | 5,866 | 5,283 | 4,183 | |||||||||||||
| Total Loans | 394,812 | 383,086 | 384,839 | |||||||||||||
| Allowance for loan losses | (6,155 | ) | (6,613 | ) | (6,371 | ) | ||||||||||
| Net loans | 388,657 | 376,473 | 378,468 | |||||||||||||
| Premises and equipment | 9,623 | 9,660 | 10,085 | |||||||||||||
| Other real estate held for sale | 4,806 | 5,562 | 5,676 | |||||||||||||
| Other assets | 13,310 | 14,286 | 15,966 | |||||||||||||
| TOTAL ASSETS | $ | 492,373 | $ | 478,696 | $ | 500,774 | ||||||||||
| LIABILITIES AND SHAREHOLDERS' EQUITY | ||||||||||||||||
| LIABILITIES: | ||||||||||||||||
| Deposits: | ||||||||||||||||
| Noninterest bearing deposits | $ | 49,769 | $ | 41,264 | $ | 41,434 | ||||||||||
| NOW, money market, checking | 149,448 | 134,703 | 118,909 | |||||||||||||
| Savings | 16,526 | 17,670 | 20,110 | |||||||||||||
| CDs < $100,000 | 114,215 | 96,977 | 90,573 | |||||||||||||
| CDs > $100,000 | 23,102 | 22,698 | 23,652 | |||||||||||||
| Brokered | 46,607 | 73,467 | 111,106 | |||||||||||||
| Total deposits | 399,667 | 386,779 | 405,784 | |||||||||||||
| Borrowings: | ||||||||||||||||
| Federal Home Loan Bank | 35,000 | 35,000 | 35,000 | |||||||||||||
| Other | 1,069 | 1,069 | 1,140 | |||||||||||||
| Total borrowings | 36,069 | 36,069 | 36,140 | |||||||||||||
| Other liabilities | 1,853 | 1,966 | 2,619 | |||||||||||||
| Total liabilities | 437,589 | 424,814 | 444,543 | |||||||||||||
| Shareholders' equity: | ||||||||||||||||
| Preferred stock - No par value: | ||||||||||||||||
| Authorized 500,000 shares, 11,000 shares issued and outstanding | 10,811 | 10,706 | 10,610 | |||||||||||||
| Common stock and additional paid in capital - No par value | ||||||||||||||||
| Authorized - 18,000,000 shares | ||||||||||||||||
| Issued and outstanding - 3,419,736 shares | 43,525 | 43,525 | 43,509 | |||||||||||||
| Accumulated earnings (deficit) | (102 | ) | (961 | ) | 1,236 | |||||||||||
| Accumulated other comprehensive income | 550 | 612 | 876 | |||||||||||||
| Total shareholders' equity | 54,784 | 53,882 | 56,231 | |||||||||||||
| TOTAL LIABILITIES AND SHAREHOLDERS' EQUITY | $ | 492,373 | $ | 478,696 | $ | 500,774 | ||||||||||
| MACKINAC FINANCIAL CORPORATION AND SUBSIDIARIES | |||||||||||||||||
| CONSOLIDATED STATEMENTS OF OPERATIONS | |||||||||||||||||
| (Dollars in thousands except per share data) | |
Three Months Ended June 30, |
|
|
Six Months Ended June 30, |
|
|||||||||||
| 2011 | 2010 | 2011 | 2010 | ||||||||||||||
| (Unaudited) | (Unaudited) | ||||||||||||||||
| INTEREST INCOME: | |||||||||||||||||
| Interest and fees on loans: | |||||||||||||||||
| Taxable | $ | 5,198 | $ | 5,227 | $ | 10,334 | $ | 10,418 | |||||||||
| Tax-exempt | 37 | 47 | 79 | 99 | |||||||||||||
| Interest on securities: | |||||||||||||||||
| Taxable | 292 | 356 | 574 | 753 | |||||||||||||
| Tax-exempt | 7 | 7 | 14 | 14 | |||||||||||||
| Other interest income | 30 | 37 | 63 | 77 | |||||||||||||
| Total interest income | 5,564 | 5,674 | 11,064 | 11,361 | |||||||||||||
| INTEREST EXPENSE: | |||||||||||||||||
| Deposits | 1,231 | 1,439 | 2,449 | 2,896 | |||||||||||||
| Borrowings | 155 | 212 | 296 | 420 | |||||||||||||
| Total interest expense | 1,386 | 1,651 | 2,745 | 3,316 | |||||||||||||
| Net interest income | 4,178 | 4,023 | 8,319 | 8,045 | |||||||||||||
| Provision for loan losses | 600 | 2,800 | 600 | 3,700 | |||||||||||||
| Net interest income after provision for loan losses | 3,578 | 1,223 | 7,719 | 4,345 | |||||||||||||
| OTHER INCOME: | |||||||||||||||||
| Service fees | 219 | 252 | 436 | 474 | |||||||||||||
| Net security gains | - | - | - | 215 | |||||||||||||
| Income from loans sold | 1,070 | 309 | 1,385 | 625 | |||||||||||||
| Other | 59 | 32 | 104 | 86 | |||||||||||||
| Total other income | 1,348 | 593 | 1,925 | 1,400 | |||||||||||||
| OTHER EXPENSES: | |||||||||||||||||
| Salaries and employee benefits | 1,806 | 1,781 | 3,630 | 3,501 | |||||||||||||
| Occupancy | 349 | 345 | 714 | 690 | |||||||||||||
| Furniture and equipment | 221 | 197 | 415 | 391 | |||||||||||||
| Data processing | 179 | 205 | 355 | 394 | |||||||||||||
| Professional service fees | 232 | 161 | 385 | 334 | |||||||||||||
| Loan and deposit | 252 | 198 | 431 | 466 | |||||||||||||
| ORE writedowns and (gains) losses on sale | (35 | ) | 1,845 | 432 | 1,993 | ||||||||||||
| FDIC insurance assessment | 255 | 221 | 540 | 443 | |||||||||||||
| Telephone | 58 | 45 | 109 | 92 | |||||||||||||
| Advertising | 111 | 72 | 199 | 144 | |||||||||||||
| Other | 301 | 260 | 578 | 511 | |||||||||||||
| Total other expenses | 3,729 | 5,330 | 7,788 | 8,959 | |||||||||||||
| Income (Loss) before provision for income taxes | 1,197 | (3,514 | ) | 1,856 | (3,214 | ) | |||||||||||
| Provision for (benefit of) income taxes | 402 | (1,212 | ) | 616 | (4,623 | ) | |||||||||||
| NET INCOME (LOSS) | 795 | (2,302 | ) | 1,240 | 1,409 | ||||||||||||
| Preferred dividend and accretion of discount | 192 | 186 | 381 | 371 | |||||||||||||
| NET INCOME (LOSS) AVAILABLE TO COMMON SHAREHOLDERS | $ | 603 | $ | (2,488 | ) | $ | 859 | $ | 1,038 | ||||||||
| INCOME (LOSS) PER COMMON SHARE: | |||||||||||||||||
| Basic | $ | .18 | $ | (.73 | ) | $ | .25 | $ | .30 | ||||||||
| Diluted | $ | .17 | $ | (.73 | ) | $ | .25 | $ | .30 | ||||||||
| MACKINAC FINANCIAL CORPORATION AND SUBSIDIARIES | ||||||||||||||
| LOAN PORTFOLIO AND CREDIT QUALITY | ||||||||||||||
| (Dollars in thousands) | ||||||||||||||
| Loan Portfolio Balances (at end of period): | ||||||||||||||
| June 30, | December 31, | June 30, | ||||||||||||
| 2011 | 2010 | 2010 | ||||||||||||
| Commercial Loans | ||||||||||||||
| Real estate - operators of nonresidential buildings | $ | 59,587 | $ | 58,114 | $ | 50,000 | ||||||||
| Hospitality and tourism | 33,467 | 37,737 | 43,883 | |||||||||||
| Operators of nonresidential buildings | 16,316 | 16,598 | 14,794 | |||||||||||
| Real estate - operators of nonresidential buildings | 14,909 | 15,857 | 20,727 | |||||||||||
| Other | 158,411 | 135,411 | 145,605 | |||||||||||
| Total Commercial Loans | 282,690 | 263,717 | 275,009 | |||||||||||
| 1-4 family residential real estate | 79,013 | 75,074 | 71,613 | |||||||||||
| Consumer | 5,866 | 5,283 | 4,183 | |||||||||||
| Construction | ||||||||||||||
| Commercial | 23,062 | 33,330 | 27,219 | |||||||||||
| Consumer | 4,181 | 5,682 | 6,815 | |||||||||||
| Total Loans | $ | 394,812 | $ | 383,086 | $ | 384,839 | ||||||||
| Credit Quality (at end of period): | ||||||||||||||
| June 30, | December 31, | June 30, | ||||||||||||
| 2011 | 2010 | 2010 | ||||||||||||
| Nonperforming Assets : | ||||||||||||||
| Nonaccrual loans | $ | 7,639 | $ | 5,921 | $ | 10,174 | ||||||||
| Loans past due 90 days or more | - | - | - | |||||||||||
| Restructured loans | 1,802 | 4,642 | 869 | |||||||||||
| Total nonperforming loans | 9,441 | 10,563 | 11,043 | |||||||||||
| Other real estate owned | 4,806 | 5,562 | 5,676 | |||||||||||
| Total nonperforming assets | $ | 14,247 | $ | 16,125 | $ | 16,719 | ||||||||
| Nonperforming loans as a % of loans | 2.39 | % | 2.76 | % | 2.87 | % | ||||||||
| Nonperforming assets as a % of assets | 2.89 | % | 3.37 | % | 3.34 | % | ||||||||
| Reserve for Loan Losses: | ||||||||||||||
| At period end | $ | 6,155 | $ | 6,613 | $ | 6,371 | ||||||||
| As a % of loans | 1.56 | % | 1.73 | % | 1.66 | % | ||||||||
| As a % of nonperforming loans | 65.19 | % | 62.61 | % | 57.69 | % | ||||||||
| As a % of nonaccrual loans | 80.57 | % | 111.69 | % | 62.62 | % | ||||||||
| Texas ratio | 23.38 | % | 26.66 | % | 26.71 | % | ||||||||
| Charge-off Information (year to date): | ||||||||||||||
| Average loans | $ | 379,153 | $ | 384,347 | $ | 383,398 | ||||||||
| Net charge-offs | 1,058 | 5,112 | 2,554 | |||||||||||
| Charge-offs as a % of average loans | .28 | % | 1.33 | % | .67 | % | ||||||||
| MACKINAC FINANCIAL CORPORATION AND SUBSIDIARIES | |||||||||||||||||||
| QUARTERLY FINANCIAL HIGHLIGHTS | |||||||||||||||||||
| QUARTER ENDED | |||||||||||||||||||
| (Unaudited) | |||||||||||||||||||
| June 30, | March 31, | December 31, | September 30, | June 30, | |||||||||||||||
| 2011 | 2011 | 2010 | 2010 | 2010 | |||||||||||||||
| BALANCE SHEET (Dollars in thousands) | |||||||||||||||||||
| Total loans | $ | 394,812 | $ | 374,609 | $ | 383,086 | $ | 382,727 | $ | 384,839 | |||||||||
| Allowance for loan losses | (6,155 | ) | (6,184 | ) | (6,613 | ) | (5,437 | ) | (6,371 | ) | |||||||||
| Total loans, net | 388,657 | 368,425 | 376,473 | 377,290 | 378,468 | ||||||||||||||
| Intangible assets | - | - | - | - | - | ||||||||||||||
| Total assets | 492,373 | 492,790 | 478,696 | 499,006 | 500,774 | ||||||||||||||
| Core deposits | 329,958 | 315,638 | 290,614 | 287,055 | 271,026 | ||||||||||||||
| Noncore deposits (1) | 69,709 | 85,145 | 96,165 | 117,469 | 134,758 | ||||||||||||||
| Total deposits | 399,667 | 400,783 | 386,779 | 404,524 | 405,784 | ||||||||||||||
| Total borrowings | 36,069 | 36,069 | 36,069 | 36,069 | 36,140 | ||||||||||||||
| Common shareholders' equity | 43,973 | 43,340 | 43,176 | 45,329 | 45,621 | ||||||||||||||
| Total shareholders' equity | 54,784 | 54,097 | 53,882 | 55,987 | 56,231 | ||||||||||||||
| Total shares outstanding | 3,419,736 | 3,419,736 | 3,419,736 | 3,419,736 | 3,419,736 | ||||||||||||||
| AVERAGE BALANCES (Dollars in thousands) | |||||||||||||||||||
| Assets | $ | 494,481 | $ | 478,861 | $ | 488,320 | $ | 512,335 | $ | 502,942 | |||||||||
| Loans | 378,250 | 380,066 | 385,296 | 385,268 | 382,169 | ||||||||||||||
| Deposits | 401,549 | 386,743 | 393,266 | 416,847 | 405,449 | ||||||||||||||
| Common equity | 43,363 | 43,147 | 44,339 | 46,041 | 47,310 | ||||||||||||||
| Equity | 54,138 | 53,870 | 55,015 | 56,668 | 57,889 | ||||||||||||||
| INCOME STATEMENT (Dollars in thousands) | |||||||||||||||||||
| Net interest income | $ | 4,178 | $ | 4,141 | $ | 4,276 | $ | 4,064 | $ | 4,023 | |||||||||
| Provision for loan losses | 600 | - | 1,800 | 1,000 | 2,800 | ||||||||||||||
| Net interest income after provision | 3,578 | 4,141 | 2,476 | 3,064 | 1,223 | ||||||||||||||
| Total other income | 1,348 | 577 | 747 | 648 | 593 | ||||||||||||||
| Total other expense | 3,729 | 4,059 | 4,037 | 3,601 | 5,330 | ||||||||||||||
| Income before taxes | 1,197 | 659 | (814 | ) | 111 | (3,514 | ) | ||||||||||||
| Provision for (benefit of) income taxes | 402 | 214 | 1,093 | 30 | (1,212 | ) | |||||||||||||
| Net income | 795 | 445 | (1,907 | ) | 81 | (2,302 | ) | ||||||||||||
| Preferred dividend expense | 192 | 189 | 185 | 185 | 186 | ||||||||||||||
| Net income (loss) available to common shareholders | $ | 603 | $ | 256 | $ | (2,092 | ) | $ | (104 | ) | $ | (2,488 | ) | ||||||
| PER SHARE DATA | |||||||||||||||||||
| Earnings | $ | .18 | $ | .07 | $ | (.61 | ) | $ | (.03 | ) | $ | (.73 | ) | ||||||
| Book value per common share | 12.86 | 12.67 | 12.63 | 13.26 | 13.34 | ||||||||||||||
| Market value, closing price | 6.00 | 6.02 | 4.58 | 5.10 | 6.50 | ||||||||||||||
| ASSET QUALITY RATIOS | |||||||||||||||||||
| Nonperforming loans/total loans | 2.39 | % | 2.66 | % | 2.76 | % | 2.94 | % | 2.87 | % | |||||||||
| Nonperforming assets/total assets | 2.89 | 3.05 | 3.37 | 3.41 | 3.34 | ||||||||||||||
| Allowance for loan losses/total loans | 1.56 | 1.65 | 1.73 | 1.42 | 1.66 | ||||||||||||||
| Allowance for loan losses/nonperforming loans | 65.19 | 62.06 | 62.61 | 48.34 | 57.69 | ||||||||||||||
| Texas ratio (2) | 23.38 | 24.96 | 26.66 | 27.68 | 26.71 | ||||||||||||||
| PROFITABILITY RATIOS | |||||||||||||||||||
| Return on average assets | .49 | % | .22 | % | (1.70 | )% | (.08 | )% | (1.98 | )% | |||||||||
| Return on average common equity | 5.58 | 2.40 | (18.72 | ) | (.90 | ) | (21.09 | ) | |||||||||||
| Return on average equity | 4.47 | 1.92 | (15.09 | ) | (.73 | ) | (17.24 | ) | |||||||||||
| Net interest margin | 3.79 | 3.92 | 3.88 | 3.69 | 3.56 | ||||||||||||||
| Efficiency ratio | 67.84 | 75.73 | 65.05 | 75.98 | 76.04 | ||||||||||||||
| Average loans/average deposits | 94.20 | 98.27 | 97.97 | 92.42 | 94.26 | ||||||||||||||
| CAPITAL ADEQUACY RATIOS | |||||||||||||||||||
| Tier 1 leverage ratio | 9.50 | % | 9.70 | % | 9.25 | % | 9.22 | % | 9.38 | % | |||||||||
| Tier 1 capital to risk weighted assets | 11.40 | 11.61 | 11.36 | 11.73 | 11.65 | ||||||||||||||
| Total capital to risk weighted assets | 12.66 | 12.86 | 12.62 | 12.98 | 12.91 | ||||||||||||||
| Average equity/average assets | 10.95 | 11.25 | 11.27 | 11.06 | 11.51 | ||||||||||||||
| Tangible equity/tangible assets | 10.95 | 11.25 | 11.27 | 11.06 | 11.51 | ||||||||||||||
| (1) Noncore deposits includes Internet CDs, brokered deposits and CDs greater than $100,000 | |||||||||||||||||||
| (2) Texas ratio equals nonperforming assets divided by shareholders' equity plus allowance for loan losses | |||||||||||||||||||
Contact Information:
Contact:
Investor Relations
(888) 343-8147
Website:
www.bankmbank.com