MANISTIQUE, MI--(Marketwire - Aug 2, 2012) - Mackinac Financial Corporation (
Operating results excluding the deferred tax asset for the first six months of 2012 totaled $1.639 million or $.48 per share compared to $.859 million or $.25 per share for the same period in 2011. The Corporation's subsidiary mBank recorded net income of $2.248 million, excluding the valuation adjustment to deferred taxes, for the first six months of this year compared to $1.439 million for the same period in 2011.
Some highlights for the first six months of 2012 results include:
- Improved credit quality with a Texas Ratio of 13.59% compared to 23.38% one year ago, with nonperforming loans of $5.375 million, a $4.066 million reduction from a year earlier
- Reduced credit related charges in 2012 at $.403 million compared to $.748 million in the 2011 six month period
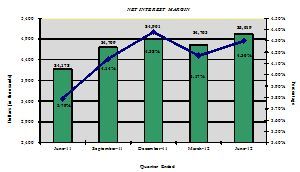
- Improved net interest margin at 4.23% compared to 3.85% for the first six months of 2011
- Six month Secondary mortgage loan income of $.524 million, compared to $.199 million in the same period of 2011
- Continued success in SBA/USDA lending initiatives, with $.620 million in sold guarantees to the secondary market. The Corporation continues to be a state leader in supporting small businesses with these programs ranking 9th in the state in total dollars for all banks for newly originated SBA 7(a) loans for the third quarter 2012 Michigan SBA results. The Corporation, under this program, originated 21 loans totaling $9.6 million.
- Growth in core deposits of $9.2 million
Loans and Nonperforming Assets
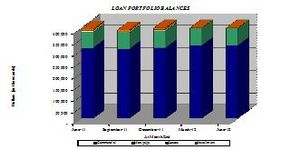
Total loans at June 30, 2012 were $419.453 million, a 6.24% increase from the $394.812 million at June 30, 2011 and up $18.207 million from year-end 2011 total loans of $401.246 million. The Corporation had total loan production for all loan types of $101 million in the first six months of this year. Comprising the total production were $54 million in commercial loans, and $47 million in retail, $44 million of which were mortgages. The Upper Peninsula continues to drive a large majority of the new originations, totaling $66 million, with Southeast Michigan production of $18 million, and the Northern Lower Peninsula with $17 million. Commenting on loan growth, Kelly W. George, President and CEO of mBank, stated, "We are very pleased with the level of loan activity we are seeing in all our markets. The activity is all encompassing, including new home purchases and refinances, as well as small business expansion for various needs. Actual loan outstandings would have been greater, but the Corporation experienced unexpected large loan pay downs as a result of excess cash flow from strong commercial credits, and has also begun to experience tougher competition in the marketplace with respect to rate conditions. This has led to several relationships exiting because of pricing reasons. However, given our balance sheet and funding structure, we felt it was prudent to not try to retain these loans."
Nonperforming loans totaled $5.375 million, 1.28% of total loans at June 30, 2012 compared to $9.441 million, or 2.39% of total loans at June 30, 2011 and down $2.618 million from December 31, 2011. Nonperforming assets were reduced by $5.354 million from a year ago and stood at 1.70% of total assets. Total loan delinquencies resided at .82% or $3.448 million, almost solely made up of non-accrual commercial loans. George, commenting on credit quality, stated, "We are pleased with our continued reduction in the level of nonperforming assets and the overall payment performance on our total loan portfolio which has been good for several years now since coming out of the severe economic conditions from the 2008 downturn. Our current level of nonperforming assets is manageable and our associated costs are now more in line with a normal business climate with the reductions we have seen this year. We will remain diligent and timely in our recognition and disposal methods for our remaining nonperforming assets in terms of any future deterioration and in the event any new issues arise in subsequent quarters."
Manistique Papers Inc. Bankruptcy and Community Partnership Lending
As noted in our 2011 annual report, mBank was very close to consummating the sale of Manistique Papers Inc. out of a Chapter 11 bankruptcy process where it had played the lead role in facilitating since August of 2011 when mBank stepped in as the Senior Lender through a variety of transactions to purchase legacy debt of the corporation and provide new working capital funding to prevent the liquidation and closure of this 91 year old paper mill and the loss of approximately 150 jobs. We are very pleased to announce that in May of this year, though the collective efforts of various parties, we were able to close a sale to The Watermill Group, a private equity firm located in Boston Mass., to become the new owner of the local mill and ensure its continued vital operations for our local community in Manistique. George commenting on the sale events, "We could not be happier for the outcome of this endeavor we chose to take on 10 months ago to support our second largest employer and icon of the local business community Manistique Papers and all the good people who have worked there for years. Manistique Papers will benefit greatly from The Watermill Group's financial stability, operational expertise and experience in environmental paper and we appreciate the Watermill team's creative strategies for revitalizing the mill and the commitment they've shown to the company and local community. We're pleased to be working with them going forward and look forward to a mutually rewarding banking relationship as we move into a new rewarding chapter of the paper mills legacy."
Margin Analysis
Net interest margin in the first six months of 2012 increased to $9.782 million, 4.23%, compared to $8.319 million, or 3.85%, in the same period in 2011. The interest margin increase was largely due to decreased funding costs. George, commenting on margin items, stated, "We expect some margin pressure in future periods with this prolonged low interest rate environment, which limits investment options and provides for a highly competitive commercial loan procurement market for all banks centered on pricing options. We are continually seeing added pressure from existing borrowers and new credit opportunities for longer fixed rate terms and lower variable rate floors as we continue to look to structure our balance sheet with properly matched liabilities to manage our growth with diligence towards limiting longer term interest rate risk given the continued uncertainty of where interest rates will move in the next 12-24 months."
Deposits
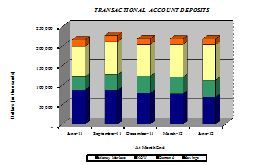
Total deposits of $425.381 million at June 30, 2012 increased 6.43% from deposits of $399.667 million on June 30, 2011. Total deposits on June 30, 2012 deposits were up $20.592 million from year-end 2011 deposits of $404.789 million. The overall increase in deposits for the six months of 2012 is comprised of an increase in noncore deposits of $11.383 million and increased core deposits of $9.209 million. George, commenting on core deposits, stated, "In 2012 we have continued to experience a good growth rate on core deposits though lower than in previous years which is partially due to our reduced rates on transactional accounts to manage our net interest margin where we have seen a small exit from primarily rate only driven clients. We have supplemented our deposit growth with noncore deposits to manage interest rate risk in this prolonged low interest rate cycle, along with the need to align our funding costs with rates and maturities on loans as noted previously."
Noninterest Income/Expense
Noninterest income, at $1.911 million in the first six months of 2012, decreased $.014 million from the same period in 2011 of $1.925 million with the largest drivers of this income coming from the secondary market mortgage activities and gains from SBA/USDA loan sales. Income from secondary mortgage activities totaled $.524 million in 2012 compared to $.199 million in 2011. SBA/USDA loan sale gains were behind 2011 with year to date gains of $.620 million compared to 2011 gains of $1.186 million.
Noninterest expense, at $8.041 million in the first six months of 2012, increased $.253 million, or 3.25% from the same period in 2011. The Corporation continues to look for ways to control costs and remains below peer levels in terms of salary and benefits as a percentage of total assets at 1.58%.
Assets and Capital
Total assets of the Corporation at June 30, 2012 were $524.366 million, up 6.50% from the $492.373 million reported at June 30, 2011 and up 5.23% from the $498.311 million of total assets at year-end 2011.
Total shareholders' equity at June 30, 2012 totaled $60.352 million, compared to $54.784 million on June 30, 2011, an increase of $5.568 million, or 10.16%. Book value of common shareholders' equity was $14.43 per share at June 30, 2012 compared to $12.86 per share at June 30, 2011 and compared to $46.148 million, or $12.97 per share on December 31, 2011. The Corporation and the Bank are both "well-capitalized" with Tier 1 Capital at the Corporation of 10.16% and 9.52% at the Bank.
Weighted average shares outstanding totaled 3,419,736 for both periods. The common stock warrants outstanding of 379,310 shares were slightly dilutive for the 2012 second quarter by $.04 per share and for the six month period at $.05 per share.
Paul D. Tobias, Chairman and Chief Executive Officer, concluded, "We are pleased with our 2012 year to date operating results. Our loan production has been steady and we have a good pipeline of portfolio loans and SBA/USDA opportunities. Loan portfolio expansion will be challenging but we expect continued growth. Our credit quality is strong and we expect increased noninterest revenue, mainly from SBA/USDA loan sales later this year."
"Looking forward, we are excited about our rights offering and the pending investment from the Steinhardt family. We expect to complete these transactions within the next few weeks and issue approximately 2.2 million shares with net proceeds of roughly $12.0 million. This will provide the funding necessary to pursue several initial strategic alternatives. This new capitalization and the access to the capital and the funding that accompany an association with the Steinhardt's will be significant catalysts in the execution of our long-term strategic plan for franchise growth and increasing shareholder value."
Mackinac Financial Corporation is a registered bank holding company formed under the Bank Holding Company Act of 1956 with assets in excess of $520 million and whose common stock is traded on the NASDAQ stock market as "MFNC." The principal subsidiary of the Corporation is mBank. Headquartered in Manistique, Michigan, mBank has 11 branch locations; seven in the Upper Peninsula, three in the Northern Lower Peninsula and one in Oakland County, Michigan. The Company's banking services include commercial lending and treasury management products and services geared toward small to mid-sized businesses, as well as a full array of personal and business deposit products and consumer loans.
Forward-Looking Statements
This release contains certain forward-looking statements. Words such as "anticipates," "believes," "estimates," "expects," "intends," "should," "will," and variations of such words and similar expressions are intended to identify forward-looking statements: as defined by the Private Securities Litigation Reform Act of 1995. These statements reflect management's current beliefs as to expected outcomes of future events and are not guarantees of future performance. These statements involve certain risks, uncertainties and assumptions that are difficult to predict with regard to timing, extent, likelihood, and degree of occurrence. Therefore, actual results and outcomes may materially differ from what may be expressed or forecasted in such forward-looking statements. Factors that could cause a difference include among others: changes in the national and local economies or market conditions; changes in interest rates and banking regulations; the impact of competition from traditional or new sources; and the possibility that anticipated cost savings and revenue enhancements from mergers and acquisitions, bank consolidations, branch closings and other sources may not be fully realized at all or within specified time frames as well as other risks and uncertainties including but not limited to those detailed from time to time in filings of the Company with the Securities and Exchange Commission. These and other factors may cause decisions and actual results to differ materially from current expectations. Mackinac Financial Corporation undertakes no obligation to revise, update, or clarify forward-looking statements to reflect events or conditions after the date of this release.
| MACKINAC FINANCIAL CORPORATION AND SUBSIDIARIES SELECTED FINANCIAL HIGHLIGHTS |
|||||||||||||
(Dollars in thousands, except per share data) |
June 30, 2012 |
December 31, 2011 |
June 30, 2011 |
||||||||||
| (Unaudited) | (Unaudited) | ||||||||||||
| Selected Financial Condition Data (at end of period): | |||||||||||||
| Assets | $ | 524,366 | $ | 498,311 | $ | 492,373 | |||||||
| Loans | 419,453 | 401,246 | 394,812 | ||||||||||
| Investment securities | 39,054 | 38,727 | 38,613 | ||||||||||
| Deposits | 425,381 | 404,789 | 399,667 | ||||||||||
| Borrowings | 35,997 | 35,997 | 36,069 | ||||||||||
| Common Shareholders' Equity | 49,352 | 44,342 | 43,973 | ||||||||||
| Shareholders' equity | 60,352 | 55,263 | 54,784 | ||||||||||
| Selected Statements of Income Data (six months and year ended): | |||||||||||||
| Net interest income | $ | 9,782 | $ | 17,929 | $ | 8,319 | |||||||
| Income before taxes and preferred dividend | 3,007 | 3,316 | 1,856 | ||||||||||
| Net income | 4,639 | 1,452 | 859 | ||||||||||
| Income per common share - Basic | 1.36 | .42 | .25 | ||||||||||
| Income per common share - Diluted | 1.31 | .41 | .25 | ||||||||||
| Weighted average shares outstanding | 3,419,736 | 3,419,736 | 3,419,736 | ||||||||||
| Weighted average shares outstanding- Diluted | 3,532,640 | 3,500,204 | 3,504,567 | ||||||||||
| Three Months Ended: | |||||||||||||
| Net interest income | $ | 5,019 | 4,901 | 4,178 | |||||||||
| Income before taxes and preferred dividend | 1,967 | 105 | 1,197 | ||||||||||
| Net income | 4,141 | (114 | ) | 603 | |||||||||
| Income per common share - Basic | 1.21 | (.03 | ) | .18 | |||||||||
| Income per common share - Diluted | 1.17 | (.03 | ) | .17 | |||||||||
| Weighted average shares outstanding | 3,419,736 | 3,419,736 | 3,419,736 | ||||||||||
| Weighted average shares outstanding- Diluted | 3,539,908 | 3,480,347 | 3,509,810 | ||||||||||
| Selected Financial Ratios and Other Data: | |||||||||||||
| Performance Ratios: | |||||||||||||
| Net interest margin | 4.23 | % | 4.06 | % | 3.85 | % | |||||||
| Efficiency ratio | 66.98 | 68.43 | 71.47 | ||||||||||
| Return on average assets | 2.20 | .30 | .36 | ||||||||||
| Return on average common equity | 24.99 | 3.30 | 4.00 | ||||||||||
| Return on average equity | 20.07 | 2.66 | 3.21 | ||||||||||
| Average total assets | $ | 507,546 | $ | 489,539 | $ | 486,714 | |||||||
| Average common shareholders' equity | 44,706 | 43,940 | 43,255 | ||||||||||
| Average total shareholders' equity | 55,666 | 54,561 | 54,005 | ||||||||||
| Average loans to average deposits ratio | 100.12 | % | 98.05 | % | 96.19 | % | |||||||
| Common Share Data at end of period: | |||||||||||||
| Market price per common share | $ | 5.99 | $ | 5.42 | $ | 6.00 | |||||||
| Book value per common share | $ | 14.43 | $ | 12.97 | $ | 12.86 | |||||||
| Common shares outstanding | 3,419,736 | 3,419,736 | 3,419,736 | ||||||||||
| Other Data at end of period: | |||||||||||||
| Allowance for loan losses | $ | 5,083 | $ | 5,251 | $ | 6,155 | |||||||
| Non-performing assets | $ | 8,893 | $ | 11,155 | $ | 14,247 | |||||||
| Allowance for loan losses to total loans | 1.21 | % | 1.31 | % | 1.56 | % | |||||||
| Non-performing assets to total assets | 1.70 | % | 2.24 | % | 2.89 | % | |||||||
| Texas ratio | 13.59 | % | 18.43 | % | 23.38 | % | |||||||
| Number of: | |||||||||||||
| Branch locations | 11 | 11 | 12 | ||||||||||
| FTE Employees | 120 | 116 | 113 | ||||||||||
| MACKINAC FINANCIAL CORPORATION AND SUBSIDIARIES CONSOLIDATED BALANCE SHEETS |
|||||||||||||||
| June 30, | December 31, | June 30, | |||||||||||||
| 2012 | 2011 | 2011 | |||||||||||||
| (Unaudited) | (Unaudited) | ||||||||||||||
| ASSETS | |||||||||||||||
| Cash and due from banks | $ | 33,248 | $ | 20,071 | $ | 22,294 | |||||||||
| Federal funds sold | - | 13,999 | 12,000 | ||||||||||||
| Cash and cash equivalents | 33,248 | 34,070 | 34,294 | ||||||||||||
| Interest-bearing deposits in other financial institutions | 10 | 10 | 10 | ||||||||||||
| Securities available for sale | 39,054 | 38,727 | 38,613 | ||||||||||||
| Federal Home Loan Bank stock | 3,060 | 3,060 | 3,060 | ||||||||||||
| Loans: | |||||||||||||||
| Commercial | 319,398 | 311,215 | 305,752 | ||||||||||||
| Mortgage | 90,260 | 83,106 | 83,194 | ||||||||||||
| Consumer | 9,795 | 6,925 | 5,866 | ||||||||||||
| Total Loans | 419,453 | 401,246 | 394,812 | ||||||||||||
| Allowance for loan losses | (5,083 | ) | (5,251 | ) | (6,155 | ) | |||||||||
| Net loans | 414,370 | 395,995 | 388,657 | ||||||||||||
| Premises and equipment | 10,134 | 9,627 | 9,623 | ||||||||||||
| Other real estate held for sale | 3,518 | 3,162 | 4,806 | ||||||||||||
| Deferred Tax Asset | 10,271 | 8,427 | 8,444 | ||||||||||||
| Other assets | 10,701 | 5,233 | 4,866 | ||||||||||||
| TOTAL ASSETS | $ | 524,366 | $ | 498,311 | $ | 492,373 | |||||||||
| LIABILITIES AND SHAREHOLDERS' EQUITY | |||||||||||||||
| LIABILITIES: | |||||||||||||||
| Deposits: | |||||||||||||||
| Noninterest bearing deposits | $ | 59,872 | $ | 51,273 | $ | 49,769 | |||||||||
| NOW, money market, interest checking | 143,795 | 152,563 | 149,448 | ||||||||||||
| Savings | 14,248 | 14,203 | 16,526 | ||||||||||||
| CDs < $100,000 | 140,018 | 130,685 | 114,215 | ||||||||||||
| CDs > $100,000 | 25,975 | 23,229 | 23,102 | ||||||||||||
| Brokered | 41,473 | 32,836 | 46,607 | ||||||||||||
| Total deposits | 425,381 | 404,789 | 399,667 | ||||||||||||
| Borrowings | 35,997 | 35,997 | 36,069 | ||||||||||||
| Other liabilities | 2,636 | 2,262 | 1,853 | ||||||||||||
| Total liabilities | 464,014 | 443,048 | 437,589 | ||||||||||||
| SHAREHOLDERS' EQUITY: | |||||||||||||||
| Preferred stock - No par value: | |||||||||||||||
| Authorized 500,000 shares, Issued and outstanding - 11,000 shares | 11,000 | 10,921 | 10,811 | ||||||||||||
| Common stock and additional paid in capital - No par value | |||||||||||||||
| Authorized - 18,000,000 shares | |||||||||||||||
| Issued and outstanding - 3,419,736 shares | 43,525 | 43,525 | 43,525 | ||||||||||||
| Retained earnings | 5,131 | 492 | (102 | ) | |||||||||||
| Accumulated other comprehensive income | 696 | 325 | 550 | ||||||||||||
| Total shareholders' equity | 60,352 | 55,263 | 54,784 | ||||||||||||
| TOTAL LIABILITIES AND SHAREHOLDERS' EQUITY | $ | 524,366 | $ | 498,311 | $ | 492,373 | |||||||||
| MACKINAC FINANCIAL CORPORATION AND SUBSIDIARIES CONSOLIDATED STATEMENTS OF OPERATIONS |
|||||||||||||||||
| Three Months Ended | Six Months Ended | ||||||||||||||||
| June 30, | June 30, | ||||||||||||||||
| 2012 | 2011 | 2012 | 2011 | ||||||||||||||
| (Unaudited) | (Unaudited) | ||||||||||||||||
| INTEREST INCOME: | |||||||||||||||||
| Interest and fees on loans: | |||||||||||||||||
| Taxable | $ | 5,873 | $ | 5,198 | $ | 11,453 | $ | 10,334 | |||||||||
| Tax-exempt | 30 | 37 | 62 | 79 | |||||||||||||
| Interest on securities: | |||||||||||||||||
| Taxable | 238 | 292 | 502 | 574 | |||||||||||||
| Tax-exempt | 7 | 7 | 14 | 14 | |||||||||||||
| Other interest income | 30 | 30 | 55 | 63 | |||||||||||||
| Total interest income | 6,178 | 5,564 | 12,086 | 11,064 | |||||||||||||
| INTEREST EXPENSE: | |||||||||||||||||
| Deposits | 992 | 1,231 | 1,975 | 2,449 | |||||||||||||
| Borrowings | 167 | 155 | 329 | 296 | |||||||||||||
| Total interest expense | 1,159 | 1,386 | 2,304 | 2,745 | |||||||||||||
| Net interest income | 5,019 | 4,178 | 9,782 | 8,319 | |||||||||||||
| Provision for loan losses | 150 | 600 | 645 | 600 | |||||||||||||
| Net interest income after provision for loan losses | 4,869 | 3,578 | 9,137 | 7,719 | |||||||||||||
| OTHER INCOME: | |||||||||||||||||
| Deposit service fees | 189 | 219 | 383 | 436 | |||||||||||||
| Income from secondary market loans sold | 226 | 120 | 524 | 199 | |||||||||||||
| SBA/USDA loan sale gains | 620 | 950 | 620 | 1,186 | |||||||||||||
| Mortgage servicing income | 115 | - | 200 | - | |||||||||||||
| Other | 155 | 59 | 184 | 104 | |||||||||||||
| Total other income | 1,305 | 1,348 | 1,911 | 1,925 | |||||||||||||
| OTHER EXPENSE: | |||||||||||||||||
| Salaries and employee benefits | 2,003 | 1,806 | 3,978 | 3,630 | |||||||||||||
| Occupancy | 335 | 349 | 680 | 714 | |||||||||||||
| Furniture and equipment | 219 | 221 | 447 | 415 | |||||||||||||
| Data processing | 258 | 179 | 486 | 355 | |||||||||||||
| Professional service fees | 310 | 232 | 490 | 385 | |||||||||||||
| Loan and deposit | 338 | 252 | 479 | 431 | |||||||||||||
| Writedowns and losses on other real estate held for sale | 174 | (35 | ) | 185 | 432 | ||||||||||||
| FDIC insurance assessment | 159 | 255 | 318 | 540 | |||||||||||||
| Telephone | 57 | 58 | 112 | 109 | |||||||||||||
| Advertising | 98 | 111 | 196 | 199 | |||||||||||||
| Other | 256 | 301 | 670 | 578 | |||||||||||||
| Total other expenses | 4,207 | 3,729 | 8,041 | 7,788 | |||||||||||||
| Income before provision for income taxes | 1,967 | 1,197 | 3,007 | 1,856 | |||||||||||||
| Provision for income taxes | (2,335 | ) | 402 | (1,986 | ) | 616 | |||||||||||
| NET INCOME | 4,302 | 795 | 4,993 | 1,240 | |||||||||||||
| Preferred dividend and accretion of discount | 161 | 192 | 354 | 381 | |||||||||||||
| NET INCOME AVAILABLE TO COMMON SHAREHOLDERS | $ | 4,141 | $ | 603 | $ | 4,639 | $ | 859 | |||||||||
| INCOME PER COMMON SHARE: | |||||||||||||||||
| Basic | $ | 1.21 | $ | .18 | $ | 1.36 | $ | .25 | |||||||||
| Diluted | $ | 1.17 | $ | .17 | $ | 1.31 | $ | .25 | |||||||||
| MACKINAC FINANCIAL CORPORATION AND SUBSIDIARIES LOAN PORTFOLIO AND CREDIT QUALITY |
||||||||||
| (Dollars in thousands) | ||||||||||
| Loan Portfolio Balances (at end of period): | ||||||||||
| June 30, | December 31, | June 30, | ||||||||
| 2012 | 2011 | 2011 | ||||||||
| (Unaudited) | (Unaudited) | (Audited) | ||||||||
| Commercial Loans: | ||||||||||
| Real estate - operators of nonresidential buildings | $ | 83,539 | $ | 75,391 | $ | 59,587 | ||||
| Hospitality and tourism | 36,557 | 33,306 | 33,467 | |||||||
| Lessors of nonresidential buildings | 13,358 | 16,499 | 16,316 | |||||||
| Real estate agents and managers | 12,860 | 10,617 | 14,909 | |||||||
| Other | 150,291 | 155,657 | 158,411 | |||||||
| Total Commercial Loans | 296,605 | 291,470 | 282,690 | |||||||
| 1-4 family residential real estate | 84,665 | 77,332 | 79,013 | |||||||
| Consumer | 9,795 | 6,925 | 5,866 | |||||||
| Construction | ||||||||||
| Commercial | 22,793 | 19,745 | 23,062 | |||||||
| Consumer | 5,595 | 5,774 | 4,181 | |||||||
| Total Loans | $ | 419,453 | $ | 401,246 | $ | 394,812 | ||||
| Credit Quality (at end of period): | |||||||||||||
| June 30, | December 31, | June 30, | |||||||||||
| 2012 | 2011 | 2011 | |||||||||||
| (Unaudited) | (Unaudited) | (Unaudited) | |||||||||||
| Nonperforming Assets : | |||||||||||||
| Nonaccrual loans | $ | 5,375 | $ | 5,490 | $ | 7,639 | |||||||
| Loans past due 90 days or more | - | - | - | ||||||||||
| Restructured loans | - | 2,503 | 1,802 | ||||||||||
| Total nonperforming loans | 5,375 | 7,993 | 9,441 | ||||||||||
| Other real estate owned | 3,518 | 3,162 | 4,806 | ||||||||||
| Total nonperforming assets | $ | 8,893 | $ | 11,155 | $ | 14,247 | |||||||
| Nonperforming loans as a % of loans | 1.28 | % | 1.99 | % | 2.39 | % | |||||||
| Nonperforming assets as a % of assets | 1.70 | % | 2.24 | % | 2.89 | % | |||||||
| Reserve for Loan Losses: | |||||||||||||
| At period end | $ | 5,083 | $ | 5,251 | $ | 6,155 | |||||||
| As a % of average loans | 1.23 | % | 1.35 | % | 1.62 | % | |||||||
| As a % of nonperforming loans | 94.57 | % | 65.69 | % | 65.19 | % | |||||||
| As a % of nonaccrual loans | 94.57 | % | 95.65 | % | 80.57 | % | |||||||
| Texas Ratio | 13.59 | % | 18.43 | % | 23.38 | % | |||||||
| Charge-off Information (year to date): | |||||||||||||
| Average loans | $ | 413,467 | $ | 388,115 | $ | 379,153 | |||||||
| Net charge-offs | $ | 813 | $ | 3,662 | $ | 1,058 | |||||||
| Charge-offs as a % of average loans | .20 | % | .94 | % | .28 | % | |||||||
| MACKINAC FINANCIAL CORPORATION AND SUBSIDIARIES QUARTERLY FINANCIAL HIGHLIGHTS |
|||||||||||||||||||
| QUARTER ENDED | |||||||||||||||||||
| (Unaudited) | |||||||||||||||||||
| June 30, | March 31, | December 31, | September 30, | June 30, | |||||||||||||||
| 2012 | 2012 | 2011 | 2011 | 2011 | |||||||||||||||
| BALANCE SHEET (Dollars in thousands) | |||||||||||||||||||
| Total loans | $ | 419,453 | $ | 414,402 | $ | 401,246 | $ | 391,903 | $ | 394,812 | |||||||||
| Allowance for loan losses | (5,083 | ) | (5,382 | ) | (5,251 | ) | (5,838 | ) | (6,155 | ) | |||||||||
| Total loans, net | 414,370 | 409,020 | 395,995 | 386,065 | 388,657 | ||||||||||||||
| Intangible assets | - | - | - | - | - | ||||||||||||||
| Total assets | 524,366 | 506,496 | 498,311 | 498,598 | 492,373 | ||||||||||||||
| Core deposits | 357,933 | 355,186 | 348,724 | 346,843 | 329,958 | ||||||||||||||
| Noncore deposits (1) | 67,448 | 56,902 | 56,065 | 58,215 | 69,709 | ||||||||||||||
| Total deposits | 425,381 | 412,088 | 404,789 | 405,058 | 399,667 | ||||||||||||||
| Total borrowings | 35,997 | 35,997 | 35,997 | 35,997 | 36,069 | ||||||||||||||
| Common shareholders' equity | 49,352 | 45,119 | 44,342 | 44,613 | 43,973 | ||||||||||||||
| Total shareholders' equity | 60,352 | 56,095 | 55,263 | 55,479 | 54,784 | ||||||||||||||
| Total shares outstanding | 3,419,736 | 3,419,736 | 3,419,736 | 3,419,736 | 3,419,736 | ||||||||||||||
| AVERAGE BALANCES (Dollars in thousands) | |||||||||||||||||||
| Assets | $ | 511,681 | $ | 503,412 | $ | 487,304 | $ | 497,333 | $ | 494,481 | |||||||||
| Loans | 422,887 | 404,048 | 396,197 | 397,665 | 378,250 | ||||||||||||||
| Deposits | 452,655 | 409,250 | 390,940 | 403,957 | 401,549 | ||||||||||||||
| Common Equity | 44,927 | 44,469 | 44,325 | 44,105 | 43,354 | ||||||||||||||
| Equity | 55,915 | 55,418 | 55,219 | 54,998 | 54,138 | ||||||||||||||
| INCOME STATEMENT (Dollars in thousands) | |||||||||||||||||||
| Net interest income | $ | 5,019 | $ | 4,763 | $ | 4,901 | $ | 4,709 | $ | 4,178 | |||||||||
| Provision for loan losses | 150 | 495 | 1,300 | 400 | 600 | ||||||||||||||
| Net interest income after provision | 4,869 | 4,268 | 3,601 | 4,309 | 3,578 | ||||||||||||||
| Total noninterest income | 1,305 | 606 | 725 | 1,006 | 1,348 | ||||||||||||||
| Total noninterest expense | 4,207 | 3,834 | 4,221 | 3,960 | 3,729 | ||||||||||||||
| Income before taxes | 1,967 | 1,040 | 105 | 1,355 | 1,197 | ||||||||||||||
| Provision for income taxes | (2,335 | ) | 349 | 27 | 455 | 402 | |||||||||||||
| Net income | 4,302 | 691 | 78 | 900 | 795 | ||||||||||||||
| Preferred dividend expense | 161 | 193 | 192 | 193 | 192 | ||||||||||||||
| Net income (loss) available to common shareholders | $ | 4,141 | $ | 498 | $ | (114 | ) | $ | 707 | $ | 603 | ||||||||
| PER SHARE DATA | |||||||||||||||||||
| Earnings | $ | 1.21 | $ | .15 | $ | (.03 | ) | $ | .21 | $ | .18 | ||||||||
| Book value per common share | 14.43 | 13.19 | 12.97 | 13.05 | 12.86 | ||||||||||||||
| Market value, closing price | 5.99 | 7.00 | 5.42 | 5.46 | 6.00 | ||||||||||||||
| ASSET QUALITY RATIOS | |||||||||||||||||||
| Nonperforming loans/total loans | 1.28 | % | 1.65 | % | 1.99 | % | 2.47 | % | 2.39 | % | |||||||||
| Nonperforming assets/total assets | 1.70 | 2.04 | 2.24 | 2.99 | 2.89 | ||||||||||||||
| Allowance for loan losses/total loans | 1.21 | 1.30 | 1.31 | 1.49 | 1.56 | ||||||||||||||
| Allowance for loan losses/nonperforming loans | 94.57 | 78.49 | 65.69 | 60.35 | 65.19 | ||||||||||||||
| Texas ratio (2) | 13.59 | 16.84 | 18.43 | 24.28 | 23.38 | ||||||||||||||
| PROFITABILITY RATIOS | |||||||||||||||||||
| Return on average assets | 3.21 | % | .40 | % | (.09) | % | .56 | % | .49 | % | |||||||||
| Return on average common equity | 36.57 | 4.53 | (1.02 | ) | 6.35 | 5.58 | |||||||||||||
| Return on average equity | 29.39 | 3.62 | (.82 | ) | 5.10 | 4.47 | |||||||||||||
| Net interest margin | 4.30 | 4.17 | 4.38 | 4.14 | 3.79 | ||||||||||||||
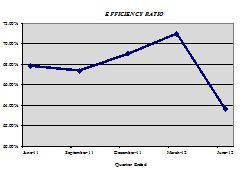
| Efficiency ratio | 63.61 | 71.01 | 69.04 | 67.39 | 67.84 | ||||||||||||||
| Average loans/average deposits | 101.50 | 98.73 | 101.34 | 98.44 | 94.20 | ||||||||||||||
| CAPITAL ADEQUACY RATIOS | |||||||||||||||||||
| Tier 1 leverage ratio | 10.16 | % | 9.95 | % | 10.08 | % | 9.73 | % | 9.50 | % | |||||||||
| Tier 1 capital to risk weighted assets | 12.87 | 11.55 | 11.62 | 11.65 | 11.40 | ||||||||||||||
| Total capital to risk weighted assets | 14.12 | 12.80 | 12.87 | 12.97 | 12.66 | ||||||||||||||
| Average equity/average assets | 10.93 | 11.01 | 11.33 | 11.06 | 10.95 | ||||||||||||||
| Tangible equity/tangible assets | 11.51 | 11.01 | 11.33 | 11.06 | 10.95 | ||||||||||||||
| (1) Noncore deposits includes Internet CDs, brokered deposits and CDs greater than $100,000 | |||||||||||||||||||
| (2)Texas ratio equals nonperforming assets divided by shareholders' equity plus allowance for loan losses | |||||||||||||||||||
Contact Information:
Contact:
Ernie R. Krueger
(906) 341-7158
Website: www.bankmbank.com