MACKINAC FINANCIAL CORPORATION AND SUBSIDIARIES
SELECTED FINANCIAL HIGHLIGHTS
(Dollars in thousands, except per share
data) For The Period Ended
---------------------------------
September December September
30, 31, 30,
2009 2008 2008
---------- --------- ----------
(Unaudited) (Unaudited)
Selected Financial Condition Data (at
end of period):
Assets $ 513,180 $ 451,431 $ 440,953
Loans 384,100 370,280 361,521
Investment securities 80,203 47,490 42,781
Deposits 418,581 371,097 360,694
Borrowings 36,140 36,210 36,210
Shareholders' Equity 55,766 41,552 41,427
Selected Statements of Income Data (nine
months and year ended):
Net interest income $ 11,856 $ 12,864 $ 9,534
Income before taxes and preferred
dividend 3,552 2,659 3,082
Net income 2,087 1,872 2,124
Income per common share - Basic .61 .55 .62
Income per common share - Diluted .61 .55 .62
Three Months Ended:
Net interest income $ 4,310 $ 3,330 $ 3,371
Income before taxes and preferred
dividend 2,585 (423) 274
Net income 1,536 (252) 216
Income per common share - Basic .45 (.07) .06
Income per common share - Diluted .45 (.07) .06
Selected Financial Ratios and Other Data
(nine months and year ended):
Performance Ratios:
Net interest margin 3.54% 3.23% 3.24%
Efficiency ratio 77.71 85.51 87.36
Return on average assets .57 .44 .68
Return on average common equity 5.72 4.61 7.03
Average total assets $ 486,447 $ 425,343 $ 419,891
Average total common shareholders'
equity $ 44,312 $ 40,630 $ 40,332
Average loans to average deposits ratio 91.72% 105.61% 106.83%
Common Share Data (at end of period):
Market price per common share $ 4.10 $ 4.40 $ 5.26
Book value per common share $ 13.25 $ 12.15 $ 12.11
Common shares outstanding 3,419,736 3,419,736 3,419,736
Weighted average shares outstanding 3,419,736 3,422,012 3,422,777
Other Data (at end of period):
Allowance for loan losses $ 4,081 $ 4,277 $ 3,585
Non-performing assets $ 17,439 $ 7,076 $ 6,400
Allowance for loan losses to total loans 1.06% 1.16% .94%
Non-performing assets to total assets 3.38% 1.57% 1.45%
Number of:
Branch locations 10 12 12
FTE Employees 97 100 96
MACKINAC FINANCIAL CORPORATION AND SUBSIDIARIES
CONSOLIDATED BALANCE SHEETS
September December September
30, 31, 30,
(Dollars in thousands) 2009 2008 2008
---------- --------- ----------
(unaudited) (unaudited)
ASSETS
Cash and due from banks $ 23,249 $ 10,112 $ 8,217
Federal funds sold - - 4,422
---------- --------- ----------
Cash and cash equivalents 23,249 10,112 12,639
Interest-bearing deposits in other
financial institutions 662 582 382
Securities available for sale 80,203 47,490 42,781
Federal Home Loan Bank stock 3,794 3,794 3,794
Loans:
Commercial 306,590 296,088 290,406
Mortgage 73,116 70,447 67,576
Installment 4,394 3,745 3,539
---------- --------- ----------
Total Loans 384,100 370,280 361,521
Allowance for loan losses (4,081) (4,277) (3,385)
---------- --------- ----------
Net loans 380,019 366,003 358,136
Premises and equipment 10,281 11,189 11,360
Other real estate held for sale 5,821 2,189 1,751
Other assets 9,151 10,072 10,110
---------- --------- ----------
TOTAL ASSETS $ 513,180 $ 451,431 $ 440,953
========== ========= ==========
LIABILITIES AND SHAREHOLDERS' EQUITY
LIABILITIES:
Noninterest bearing deposits $ 33,254 $ 30,099 $ 34,858
NOW, money market, checking 88,843 70,584 80,185
Savings 18,807 20,730 18,957
CDs < $100,000 59,637 73,752 74,940
CDs > $100,000 25,409 25,044 30,220
Brokered 192,631 150,888 121,534
---------- --------- ----------
Total deposits 418,581 371,097 360,694
Borrowings:
Federal funds purchased - - -
Short-term - - -
Long-term 36,140 36,210 36,210
---------- --------- ----------
Total borrowings 36,140 36,210 36,210
Other liabilities 2,693 2,572 2,622
---------- --------- ----------
Total liabilities 457,414 409,879 399,526
SHAREHOLDERS' EQUITY:
Preferred stock - No par value:
Authorized 500,000 shares, no
shares outstanding 10,466 - -
Common stock and additional paid in
capital - No par value
Authorized - 18,000,000 shares
Issued and outstanding - 3,419,736
shares 43,485 42,815 42,794
Retained Earnings 378 (1,708) (1,456)
Accumulated other comprehensive
income 1,437 445 89
---------- --------- ----------
Total shareholders' equity 55,766 41,552 41,427
---------- --------- ----------
TOTAL LIABILITIES AND SHAREHOLDERS'
EQUITY $ 513,180 $ 451,431 $ 440,953
========== ========= ==========
MACKINAC FINANCIAL CORPORATION AND SUBSIDIARIES
CONSOLIDATED STATEMENTS OF OPERATIONS
(Dollars in thousands except per share
data) Three Months Ended Nine Months Ended
September 30, September 30,
----------------- -----------------
2009 2008 2009 2008
-------- ------- -------- --------
(Unaudited) (Unaudited)
INTEREST INCOME:
Interest and fees on loans:
Taxable $ 5,106 $ 5,537 $ 15,212 $ 17,241
Tax-exempt 63 100 237 310
Interest on securities:
Taxable 888 303 2,020 840
Tax-exempt 7 1 11 4
Other interest income 28 87 44 257
-------- ------- -------- --------
Total interest income 6,092 6,028 17,524 18,652
-------- ------- -------- --------
INTEREST EXPENSE:
Deposits 1,550 2,308 4,894 7,924
Borrowings 232 349 774 1,194
-------- ------- -------- --------
Total interest expense 1,782 2,657 5,668 9,118
-------- ------- -------- --------
Net interest income 4,310 3,371 11,856 9,534
Provision for loan losses 700 450 1,400 1,200
-------- ------- -------- --------
Net interest income after provision for
loan losses 3,610 2,921 10,456 8,334
-------- ------- -------- --------
OTHER INCOME:
Service fees 236 229 750 597
Net security gains 644 (1) 644 64
Net gains on sale of secondary
market loans 247 16 179 113
Proceeds from lawsuit settlements - - - 3,475
Other 1,291 44 1,675 96
-------- ------- -------- --------
Total other income 2,418 288 3,248 4,345
-------- ------- -------- --------
OTHER EXPENSES:
Salaries and employee benefits 1,603 1,534 4,761 5,416
Occupancy 336 336 1,069 1,039
Furniture and equipment 193 202 604 570
Data processing 221 212 665 649
Professional service fees 161 120 458 352
Loan and deposit 402 176 1,175 430
Telephone 50 41 139 125
Advertising 80 93 238 213
Other 397 221 1,043 803
-------- ------- -------- --------
Total other expenses 3,443 2,935 10,152 9,597
-------- ------- -------- --------
Income before provision for income
taxes 2,585 274 3,552 3,082
Provision for (benefit of) income taxes 864 58 1,142 958
-------- ------- -------- --------
NET INCOME 1,721 216 2,410 2,124
-------- ------- -------- --------
Preferred dividend expense 185 - 323 -
-------- ------- -------- --------
NET INCOME AVAILABLE TO COMMON
SHAREHOLDERS $ 1,536 $ 216 $ 2,087 $ 2,124
======== ======= ======== ========
INCOME PER COMMON SHARE:
Basic $ .45 $ .06 $ .61 $ .62
======== ======= ======== ========
Diluted $ .45 $ .06 $ .61 $ .62
======== ======= ======== ========
MACKINAC FINANCIAL CORPORATION AND SUBSIDIARIES
LOAN PORTFOLIO AND CREDIT QUALITY
(Dollars in thousands)
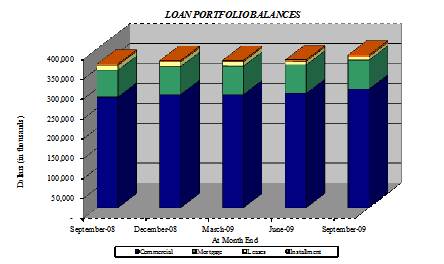
Loan Portfolio Balances (at end of period):
September December September
30, 31, 30,
2009 2008 2008
----------- ----------- -----------
Commercial Loans
Real estate - operators of
nonresidential buildings $ 47,007 $ 41,299 $ 41,486
Hospitality and tourism 45,867 35,086 35,287
Real estate agents and managers 23,996 29,292 29,277
Lessors of nonresidential buildings 13,782 13,467 13,352
Other 151,862 145,831 140,631
----------- ----------- -----------
Total Commercial Loans 282,514 264,975 260,033
1-4 family residential real estate 66,700 65,595 62,895
Consumer 4,394 3,745 3,539
Construction
Commercial 24,076 31,113 30,373
Consumer 6,416 4,852 4,681
----------- ----------- -----------
Total Loans $ 384,100 $ 370,280 $ 361,521
=========== =========== ===========
Credit Quality (at end of period):
September December September
30, 31, 30,
2009 2008 2008
---------- ---------- ----------
Nonperforming Assets:
Nonaccrual loans $ 10,655 $ 4,887 $ 4,649
Loans past due 90 days or more - - -
Restructured loans 873 - -
---------- ---------- ----------
Total nonperforming loans 11,528 4,887 4,649
Other real estate owned 5,821 2,189 1,751
---------- ---------- ----------
Total nonperforming assets $ 17,349 $ 7,076 $ 6,400
========== ========== ==========
Nonperforming loans as a % of loans 3.00% 1.32% 1.29%
---------- ---------- ----------
Nonperforming assets as a % of assets 3.38% 1.57% 1.45%
---------- ---------- ----------
Reserve for Loan Losses:
At period end $ 4,081 $ 4,277 $ 3,385
---------- ---------- ----------
As a % of average loans 1.10% 1.16% 0.94%
---------- ---------- ----------
As a % of nonperforming loans 35.40% 87.52% 72.81%
---------- ---------- ----------
As a % of nonaccrual loans 38.30% 87.52% 72.81%
========== ========== ==========
Charge-off Information (year to date):
Average loans 370,952 361,324 359,729
---------- ---------- ----------
Net charge-offs 1,596 2,169 1,961
---------- ---------- ----------
Charge-offs as a % of average loans .43% .60% .55%
---------- ---------- ----------
MACKINAC FINANCIAL CORPORATION AND SUBSIDIARIES
QUARTERLY FINANCIAL HIGHLIGHTS
QUARTER ENDED
-------------------------------------------------------
(Unaudited)
-------------------------------------------------------
September December September
30, June 30, March 31, 31, 30,
2009 2009 2009 2008 2008
--------- --------- --------- --------- ----------
BALANCE SHEET
(Dollars in
thousands)
Total loans $ 384,100 $ 372,004 $ 370,776 $ 370,280 $ 361,521
Allowance for loan
losses (4,081) (4,119) (4,793) (4,277) (3,385)
--------- --------- --------- --------- ----------
Total loans,
net 380,019 367,885 365,983 366,003 358,136
Intangible assets - 6 26 46 65
Total assets 513,180 506,304 466,375 451,431 440,953
Core deposits 200,541 202,892 196,860 195,165 208,940
Noncore deposits
(1) 218,040 210,260 188,897 175,932 151,754
--------- --------- --------- --------- ----------
Total deposits 418,581 413,152 385,757 371,097 360,694
Total borrowings 36,140 36,210 36,210 36,210 36,210
Total
shareholders'
equity 55,766 53,939 41,864 41,552 41,427
Total shares
outstanding 3,419,736 3,419,736 3,419,736 3,419,736 3,419,736
AVERAGE BALANCES
(Dollars in
thousands)
Assets $ 513,687 $ 491,205 $ 454,741 $ 441,583 $ 423,702
Loans 370,310 371,609 370,943 366,077 358,844
Deposits 419,102 401,510 372,670 358,213 341,377
Equity 54,594 49,855 41,813 41,516 41,097
INCOME STATEMENT
(Dollars in
thousands)
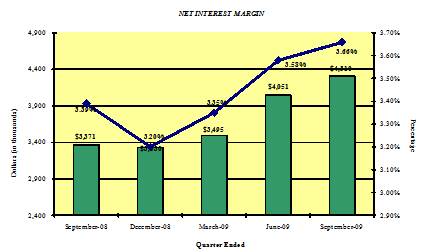
Net interest
income $ 4,310 $ 4,051 $ 3,495 $ 3,330 $ 3,371
Provision for loan
losses 700 150 550 1,100 450
--------- --------- --------- --------- ----------
Net interest
income after
provision 3,610 3,901 2,945 2,230 2,921
Total noninterest
income 2,418 439 391 308 288
Total noninterest
expense 3,443 3,470 3,239 2,961 2,935
--------- --------- --------- --------- ----------
Income before
taxes 2,585 870 97 (423) 274
Provision for
income taxes 864 271 7 (171) 58
Preferred dividend
expense 185 138 - - -
--------- --------- --------- --------- ----------
Net income $ 1,536 $ 461 $ 90 $ (252) $ 216
========= ========= ========= ========= ==========
PER SHARE DATA
Earnings - basic $ .45 $ .13 $ .03 $ (.07) $ .06
Earnings - diluted .45 .13 .03 (.07) .06
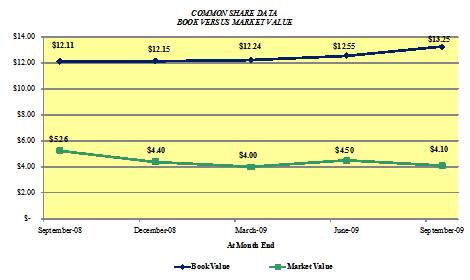
Book value per
common share 13.25 12.55 12.24 12.15 12.11
Market value,
closing price 4.10 4.50 4.00 4.40 5.26
ASSET QUALITY
RATIOS
Nonperforming
loans/total loans 3.00% 2.66% 3.52% 1.32% 1.29%
Nonperforming
assets/total
assets 3.38 2.93 3.27 1.57 1.45
Allowance for loan
losses/total
loans 1.06 1.11 1.29 1.16 .94
Allowance for loan
losses/nonperfor-
ming loans 35.40 41.71 36.72 87.52 72.81
PROFITABILITY
RATIOS
Return on average
assets .77% .38% .08% (.23)% .20%
Return on average
equity 7.17 3.71 .87 (2.42) 2.08
Net interest
margin 3.66 3.58 3.35 3.20 3.39
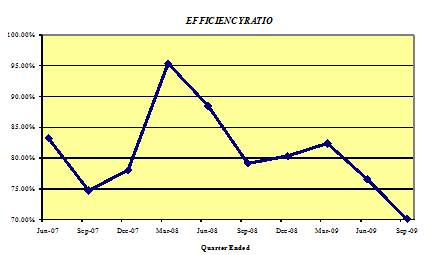
Efficiency ratio 70.09 76.55 82.36 80.30 79.12
Average
loans/average
deposits 88.36 92.55 99.54 102.20 105.12
CAPITAL ADEQUACY
RATIOS
Tier 1 leverage
ratio 10.30% 9.65% 7.86% 8.01% 8.31%
Tier 1 capital to
risk weighted
assets 12.89 11.94 9.31 9.25 9.40
Total capital to
risk weighted
assets 13.90 13.00 10.56 10.38 10.31
Average
equity/average
assets 10.63 10.15 9.20 9.40 9.70
Tangible
equity/tangible
assets 10.87 10.65 8.97 9.20 9.38
(1) Noncore deposits includes Internet CDs, brokered deposits and CDs
greater than $100,000
Contact Information: Contact: Investor Relations (888) 343-8147 Website: www.bankmbank.com