MANISTIQUE, MI--(Marketwire - Oct 28, 2011) - Mackinac Financial Corporation (
The Corporation's primary asset, mBank, recorded net income of $.999 million for the third quarter of 2011 and $2.439 million for the nine month period in 2011. The third quarter results include the initial recording value of mortgage servicing rights at $.300 million, a provision for loan losses of $.400 million and $.296 million of losses on OREO properties. Operating results for the same period in 2010 include a $1.000 million provision and negligible OREO losses.
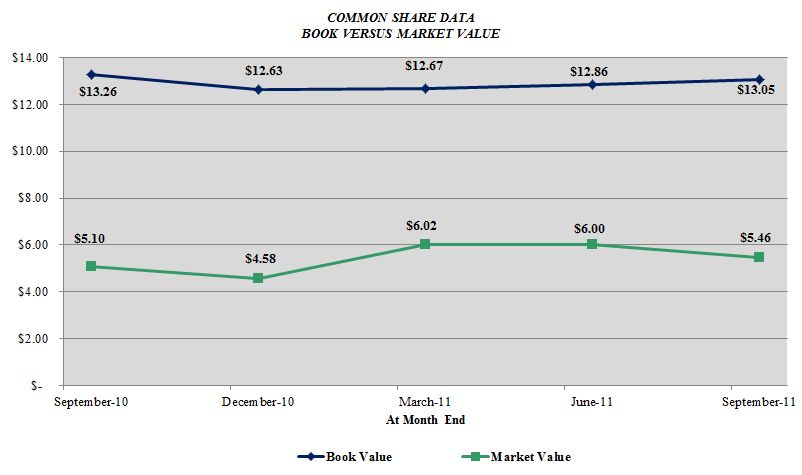
Total shareholders' equity at September 30, 2011 totaled $55.479 million, compared to $55.987 million on September 30, 2010, a decrease of $.508 million and a $1.597 million, or 7.96% increase from 2010 year end equity of $53.882 million. Book value of common shareholders' equity was $13.05 per share at September 30, 2011 compared to $13.26 per share at September 30, 2010 and $12.63 on December 31, 2010. Weighted average shares outstanding totaled 3,419,736 for all periods. The common stock warrants outstanding of 379,310 shares were slightly dilutive, at approximately $.01 per share, for the 2011 third quarter and the nine month period, as the market value of our stock moved above the $4.35 strike price.
Some highlights for the third quarter and nine month period included:
- SBA/USDA loan sale premium income of $1.469 million year to date, exceeded all of 2010 totals. We continue to see good premiums in the 7% to 8% range on these transactions. This line of business has become a core competency and revenue driver to the company as evidenced by our continued strong results statewide in terms of these programs. SBA fiscal year-end September 30th, 2011 totals reflect mBank ranking 9th in terms of the number of 7A program loans (39), and 8th in total dollars of 7A program loans ($23.4M). We continue to strive to be a steady catalyst for small business lending within the markets we serve throughout the State of Michigan by providing the necessary capital for business expansion and infrastructure growth.
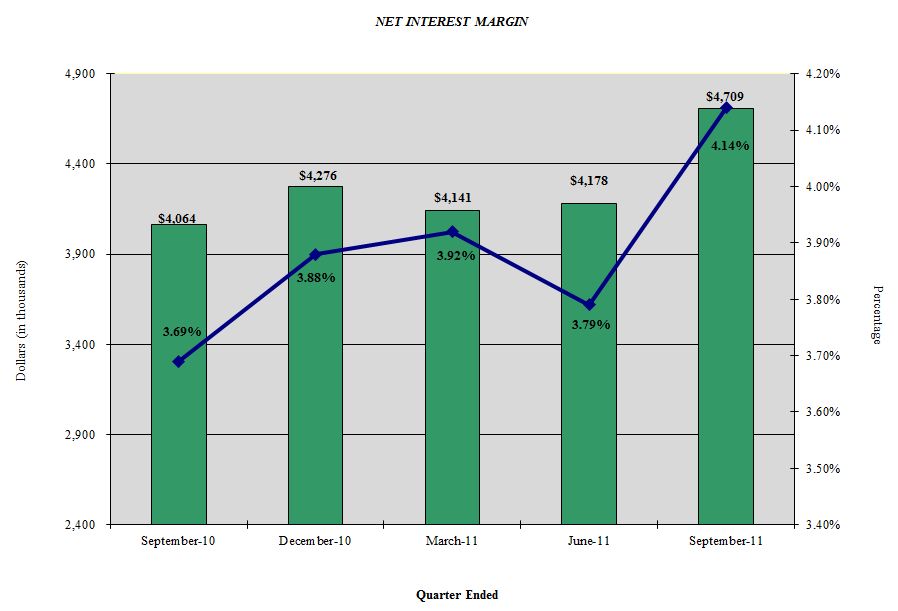
- Improved net interest margin at 4.14% for the third quarter and 3.95% for the nine month period of 2011 through the increased growth in low cost transactional deposit accounts and disciplined loan pricing ensuring appropriate asset returns on a loan by loan basis.
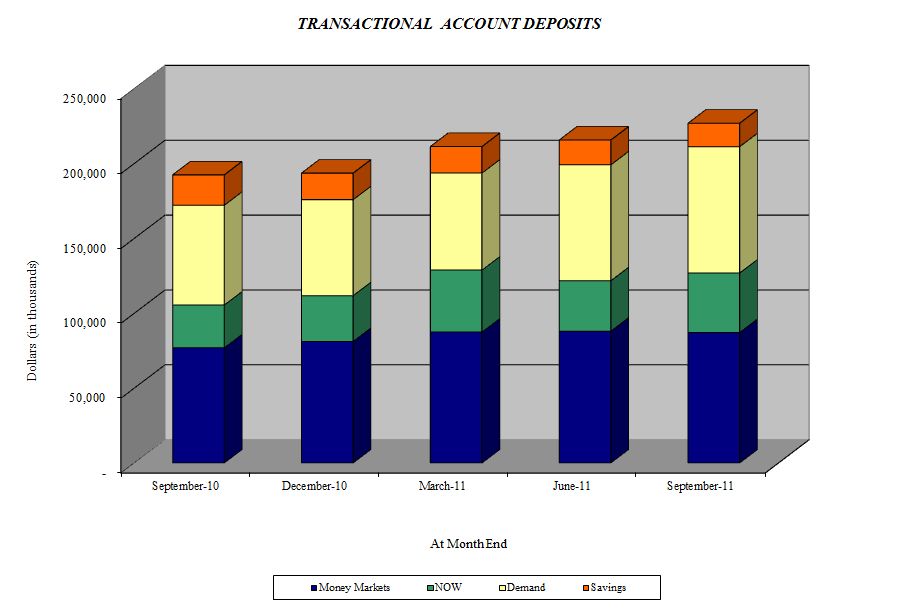
- Core deposit growth for the first nine months of 2011 totaled $56.229 million, with transactional accounts accounting for $33.313 million of this growth, improving our funding mix.
- Recorded initial valuation of mortgage servicing rights at $.300 million.
- In the third quarter and nine month period of 2011, the Corporation recorded a provision for loan losses of $.400 million and $1.000 million, as compared to the $1.000 million and $4.700 million provision recorded in the third quarter and nine month period of 2010. ORE losses of $.296 million for the third quarter and losses of $.728 million for the nine month period of 2011 compared to negligible losses in the 2010 third quarter and YTD 2010 losses of $2.000 million. Both are showing trends of an improved and overall well performing asset base.
- Nonperforming assets at September 30, 2011 totaled $14.885 million or a manageable 2.99% of total assets, a reduction of $1.240 million from 2010 year end balances. Non-accrual loans comprise 1.51% of total loans. Total loan delinquencies greater than 30 days past due were a nominal 1.65%, and the company's Texas Ratio resides at 24.28% for the quarter end, which is among the lowest of the 15 largest public banks headquartered in Michigan.
- The company formed and opened its solely owned title company in conjunction with the Michigan Bankers Association. The title company began operations in September of this year and is expected to provide another business line to augment non-interest income growth through offering title services for both commercial and retail based mortgage transactions.
- The company began the process of relocating its in-store Escanaba Menards Office location to a free standing traditional office given the growth and market share penetration we have been able to procure with our in-store branch the last two and half years and expect a full service branch to increase overall loan and deposit growth to increase shareholder value in this large commerce hub in the UP. We hope to have the new branch open during the end of the second quarter of 2012 or early summer.
- mBank recently played an instrumental and lead role in staving off the permanent closure of Manistique Papers, Inc., a 90-year old paper mill located in Manistique, the bank's headquarters, that was being forced into Chapter 7 bankruptcy liquidation. The mill employs approximately 150 local workers and is the county's second largest private employer where the bank is based. A closure would have devastated the local economy and hundreds of direct manufacturing and indirect ancillary business jobs would have been lost. mBank's management worked quickly and diligently with the mill's prior non-local bank to purchase the senior secured debt at a discount to avert the Chapter 7 liquidation and keep the company functional in its current Chapter 11 process by also providing additional working capital through a new "debtor in possession" loan arrangement.
With mBank as the lead, the bank was supported in these transactions through participation by the Michigan Economic Development Corporation ("MEDC") and the Governor's office, whose support enabled these transactions to be consummated. Through these joint actions, the Manistique mill reopened less than six weeks after its closure in mid-August and days away from a complete liquidation in bankruptcy. Kelly W. George, President and CEO, commenting on mBank's role, stated, "We at mBank are very proud that we were able to boldly provide the financial support and expertise to a vital member of our local community to save hundreds of jobs and to help rehabilitate the paper mill, a long standing member of our business community. I believe that this is the essence of real community banking; providing local banking services and financial expertise to foster economic development in order to preserve and create employment opportunities, keeping our communities vibrant and strong with a good quality of life for all."
Loans and Non-performing Assets
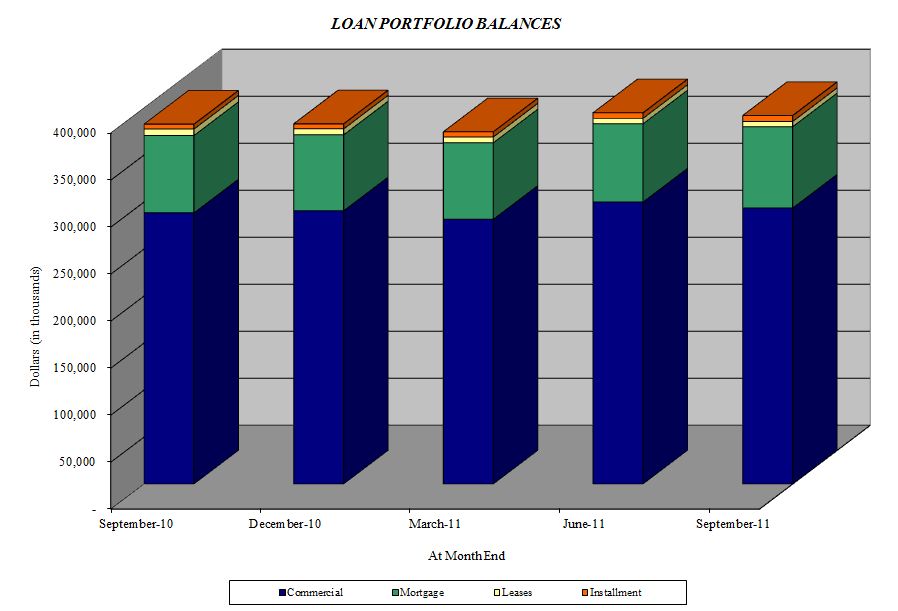
Total loans at September 30, 2011 were $391.903 million, a 2.40% increase from the $382.727 million at September 30, 2010 and up $8.817 million from year-end 2010 total loans of $383.086 million. Commenting on loan growth, Kelly W. George, President and CEO, of mBank stated, "New loan production in the third quarter continued to gain momentum with overall new production of $40.6 million. On a year to date basis, the company has generated over $113 million of new loans, with $70 million of those being commercial in nature, and $43 million retail based. The Upper Peninsula continues to lead all regions with $64 million of this new production, the Northern Lower Peninsula with $34 million, and Southeast Michigan with $15 million. In addition, through the use of the various governmental loan guarantee programs offered through the SBA, USDA, and the Michigan Economic Development Corporation (MEDC), we have been able to prudently structure and extend credit throughout various commercial industries to help spur economic growth and help repair a state and job market that was significantly hurt by the financial and real-estate collapse several years ago."
Nonperforming loans of $9.673 million have declined from 2010 year end balances of $10.563 million with nominal new additions throughout the year and balances representing several older loans that still remain in some stage of legal proceedings. George commented, "Subsequent to the close of the third quarter, we did also accept an offer for the sale of a nonperforming piece of ORE of approximately $1.5 million, at very close to its carrying value that should exit the bank in the near future. We continue our aggressive remediation actions on all of our problem assets in order to mitigate our losses and ongoing carrying costs. We believe that the current carrying values of our OREO properties, which are reassessed annually to ensure timely identification for any deterioration in values, properly reflect as best they can current market value for these assets. We remain highly focused on overall asset quality metrics and are staying vigilant in extending new credit, given the still challenging overall Michigan economy, but we do believe that the market is stabilizing."
Margin Analysis
Net interest margin in the third quarter of 2011 increased to $4.709 million, 4.14%, compared to $4.064 million, or 3.69%, in the third quarter of 2010 and the net interest margin in the first nine months of 2011 increased to $13.028 million, 3.95%, compared to $12.109 million, or 3.59%, in the first nine months of 2010. The interest margin increase was largely due to decreased funding costs. George stated, "We are disciplined in our deposit and loan pricing structures in order to minimize long term interest rate risk with the primary objective of growing our current margins. We expect our margin to improve as we progress through the end of the year and into 2012 with increased funding of new loans with lower cost transactional accounts and further repayment of longer-term maturing brokered deposits. On hand liquidity remains strong with over $30 million of fed funds/cash and $28 million of unpledged investments available to service depositor needs and fund new asset growth."
Deposits
Total deposits of $405.058 million at September 30, 2011 increased slightly from deposits of $404.524 million on September 30, 2010; however, the deposit mix changed dramatically with brokered deposits declining from $94.660 million on September 30, 2010 to $34.077 million on September 30, 2011. Total deposits on September 30, 2011 were up $18.279 million from year-end 2010 deposits of $386.779 million. The overall increase in deposits for the first nine months of 2011 is comprised of a decrease in noncore deposits of $37.950 million which was offset with increased core deposits of $56.229 million. George, commenting on the increased core deposits, stated, "In the first nine months of 2011, we continued to grow core deposits at a steady rate. Our dependency on brokered deposits, which stood at 42% of total deposits at 2009 year-end, has decreased to 8% of deposits on September 30, 2011. We are pleased with our current deposit mix and we will continue to monitor all of our products and pricing to remain competitive in order to maintain interest margins and preserve franchise value associated with core deposits."
Noninterest Income/Expense
Noninterest income, at $1.006 million in the third quarter of 2011, increased $.358 million from the third quarter 2010 level of $.648 million with the largest drivers of this income being the increased gains from the sale of SBA/USDA loans, which totaled $.283 million in the third quarter and $1.469 million for the nine month period, and the initial recognition of the value of mortgage servicing rights in the amount of $.300 million. Noninterest income, at $2.931 million in the first nine months of 2011, increased $.883 million from the first nine months of 2010 level of $2.048 million. Noninterest income in the first nine months of 2010 also includes $.215 million of security gains which the Corporation does not consider recurring earnings provider on a year to year basis.
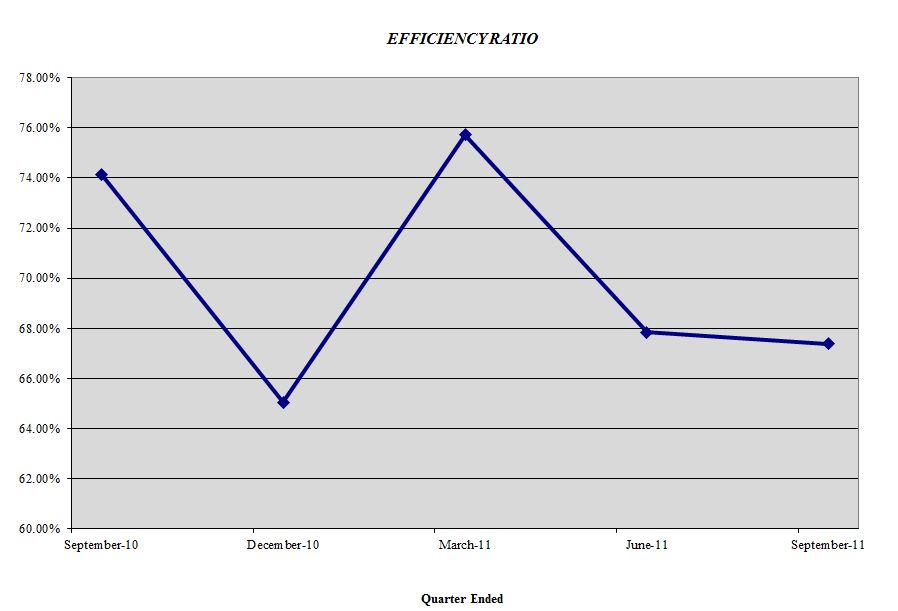
Noninterest expense, at $3.960 million in the third quarter of 2011, increased $.359 million, or 9.97% from the third quarter of 2010. Noninterest expense, at $11.749 million in the first nine months of 2011, decreased $.811 million, or 6.46% from the first nine months of 2010 due primarily to lower losses and write-downs of ORE properties, which declined from $2.000 million of write-downs in 2010 to $.728 million in 2011. Our other operating expenses in 2011 remain marginally elevated due to the added cost of aggressive nonperforming asset remediation to cleanse the credit book and are expected to decrease as these remaining problem assets eventually exit the bank. The Corporation continues to look for ways to control costs and for the quarter end continues to remain below peer levels in terms of salary and benefits as a percentage of total assets residing at 1.48%, and total overhead as a percentage of total assets which equated to 3.01%. The company's year-to-date efficiency ratio equated to 70.06%, down slightly from year end 2010 levels of 72.57%.
Assets and Capital
Total assets of the Corporation at September 30, 2011 were $498.598 million, down slightly from the $499.006 million reported at September 30, 2010 and up 4.16% from the $478.696 million of total assets at year-end 2010. Common Shareholders' equity at September 30, 2011 totaled $44.613 million, or $13.05 per share, compared to $45.329 million, or $13.26 per share on September 30, 2010 and $43.173 million, or $12.63 per share at 2010 year end. The Corporation and the Bank are both "well-capitalized" with Tier 1 Capital at the Corporation of 9.73% and 8.79% at the Bank.
Paul D. Tobias, Chairman and Chief Executive Officer, concluded, "We are pleased with our progress thus far in 2011. We continue to build franchise value through core deposit growth and other strategic initiatives, such as the organization of mBank Title Insurance Agency, LLC and look forward to prudently expanding our franchise in the near term. An additional near-term objective is to begin exploration of a TARP exit strategy sometime in 2012 given our outlook for increased core earnings which creates opportunities for other sources of capital."
Mackinac Financial Corporation is a registered bank holding company formed under the Bank Holding Company Act of 1956 with assets in excess of $490 million and whose common stock is traded on the NASDAQ stock market as "MFNC." The principal subsidiary of the Corporation is mBank. Headquartered in Manistique, Michigan, mBank has 11 branch locations; seven in the Upper Peninsula, three in the Northern Lower Peninsula and one in Oakland County, Michigan. The Company's banking services include commercial lending and treasury management products and services geared toward small to mid-sized businesses, as well as a full array of personal and business deposit products and consumer loans.
Forward-Looking Statements
This release contains certain forward-looking statements. Words such as "anticipates," "believes," "estimates," "expects," "intends," "should," "will," and variations of such words and similar expressions are intended to identify forward-looking statements: as defined by the Private Securities Litigation Reform Act of 1995. These statements reflect management's current beliefs as to expected outcomes of future events and are not guarantees of future performance. These statements involve certain risks, uncertainties and assumptions that are difficult to predict with regard to timing, extent, likelihood, and degree of occurrence. Therefore, actual results and outcomes may materially differ from what may be expressed or forecasted in such forward-looking statements. Factors that could cause a difference include among others: changes in the national and local economies or market conditions; changes in interest rates and banking regulations; the impact of competition from traditional or new sources; and the possibility that anticipated cost savings and revenue enhancements from mergers and acquisitions, bank consolidations, branch closings and other sources may not be fully realized at all or within specified time frames as well as other risks and uncertainties including but not limited to those detailed from time to time in filings of the Company with the Securities and Exchange Commission. These and other factors may cause decisions and actual results to differ materially from current expectations. Mackinac Financial Corporation undertakes no obligation to revise, update, or clarify forward-looking statements to reflect events or conditions after the date of this release.
| MACKINAC FINANCIAL CORPORATION AND SUBSIDIARIES | |||||||||||||
| SELECTED FINANCIAL HIGHLIGHTS | |||||||||||||
| (Dollars in thousands, except per share data) | For The Period Ended | ||||||||||||
| September 30, | December 31, | September 30, | |||||||||||
| 2011 | 2010 | 2010 | |||||||||||
| (Unaudited) | (Unaudited) | ||||||||||||
| Selected Financial Condition Data (at end of period): | |||||||||||||
| Assets | $ | 498,598 | $ | 478,696 | $ | 499,006 | |||||||
| Loans | 391,903 | 383,086 | 382,727 | ||||||||||
| Investment securities | 37,022 | 33,860 | 37,450 | ||||||||||
| Deposits | 405,058 | 386,779 | 404,524 | ||||||||||
| Borrowings | 35,997 | 36,069 | 36,069 | ||||||||||
| Common shareholders' equity | 44,613 | 43,176 | 45,329 | ||||||||||
| Shareholders' Equity | 55,479 | 53,882 | 55,987 | ||||||||||
| Selected Statements of Income Data (nine months and year ended): | |||||||||||||
| Net interest income | $ | 13,028 | $ | 16,385 | $ | 12,109 | |||||||
| Income (Loss) before taxes and preferred dividend | 3,210 | (3,918 | ) | (3,103 | ) | ||||||||
| Net income | 1,566 | (1,160 | ) | 934 | |||||||||
| Income (loss) per common share - Basic | .46 | (.34 | ) | .27 | |||||||||
| Income (loss) per common share - Diluted | .45 | (.34 | ) | .27 | |||||||||
| Weighted average shares outstanding | 3,419,736 | 3,419,736 | 3,419,736 | ||||||||||
| Weighted average shares outstanding - diluted | 3,503,347 | 3,419,736 | 3,419,736 | ||||||||||
| Three Months Ended: | |||||||||||||
| Net interest income | $ | 4,709 | $ | 4,276 | $ | 4,064 | |||||||
| Income (Loss) before taxes and preferred dividend | 1,355 | (814 | ) | 111 | |||||||||
| Net income (Loss) | 707 | (1,907 | ) | (104 | ) | ||||||||
| Income (Loss) per common share - Basic | .21 | (.61 | ) | (.03 | ) | ||||||||
| Income (Loss) per common share - Diluted | .20 | (.61 | ) | (.03 | ) | ||||||||
| Weighted average shares outstanding | 3,419,736 | 3,419,736 | 3,419,736 | ||||||||||
| Weighted average shares outstanding - diluted | 3,509,581 | 3,419,736 | 3,419,736 | ||||||||||
| Selected Financial Ratios and Other Data (nine months and year ended): | |||||||||||||
| Performance Ratios: | |||||||||||||
| Net interest margin | 3.95 | % | 3.66 | % | 3.59 | % | |||||||
| Efficiency ratio | 70.06 | 72.57 | 74.12 | ||||||||||
| Return on average assets | .43 | (.23 | ) | .25 | |||||||||
| Return on average common equity | 4.81 | (2.64 | ) | 2.71 | |||||||||
| Return on average equity | 3.85 | (2.06 | ) | 2.21 | |||||||||
| Average total assets | $ | 490,293 | $ | 502,993 | $ | 507,938 | |||||||
| Average common shareholders' equity | $ | 43,563 | $ | 43,981 | $ | 45,975 | |||||||
| Average total shareholders' equity | $ | 54,340 | $ | 56,171 | $ | 56,561 | |||||||
| Average loans to average deposits ratio | 96.96 | % | 94.36 | % | 93.19 | % | |||||||
| Common Share Data (at end of period): | |||||||||||||
| Market price per common share | $ | 5.46 | $ | 4.58 | $ | 5.10 | |||||||
| Book value per common share | $ | 13.05 | $ | 12.63 | $ | 13.26 | |||||||
| Common shares outstanding | 3,419,736 | 3,419,736 | 3,419,736 | ||||||||||
| Other Data (at end of period): | |||||||||||||
| Allowance for loan losses | $ | 5,838 | $ | 6,613 | $ | 5,437 | |||||||
| Non-performing assets | $ | 14,885 | $ | 16,125 | $ | 17,005 | |||||||
| Allowance for loan losses to total loans | 1.49 | % | 1.73 | % | 1.42 | % | |||||||
| Non-performing assets to total assets | 2.99 | % | 3.37 | % | 3.41 | % | |||||||
| Texas Ratio | 24.28 | % | 26.66 | % | 27.68 | % | |||||||
| Number of: | |||||||||||||
| Branch locations | 11 | 11 | 11 | ||||||||||
| FTE Employees | 114 | 110 | 98 | ||||||||||
| MACKINAC FINANCIAL CORPORATION AND SUBSIDIARIES | |||||||||||||||
| CONSOLIDATED BALANCE SHEETS | |||||||||||||||
| September 30, | December 31, | September 30, | |||||||||||||
| (Dollars in thousands) | 2011 | 2010 | 2010 | ||||||||||||
| (Unaudited) | (Unaudited) | ||||||||||||||
| ASSETS | |||||||||||||||
| Cash and due from banks | $ | 30,122 | $ | 22,719 | $ | 36,561 | |||||||||
| Federal funds sold | 12,000 | 12,000 | 12,000 | ||||||||||||
| Cash and cash equivalents | 42,122 | 34,719 | 48,561 | ||||||||||||
| Interest-bearing deposits in other financial institutions | 10 | 713 | 692 | ||||||||||||
| Securities available for sale | 37,022 | 33,860 | 37,450 | ||||||||||||
| Federal Home Loan Bank stock | 3,060 | 3,423 | 3,794 | ||||||||||||
| Loans: | |||||||||||||||
| Commercial | 299,135 | 297,047 | 295,262 | ||||||||||||
| Mortgage | 86,500 | 80,756 | 82,312 | ||||||||||||
| Installment | 6,268 | 5,283 | 5,153 | ||||||||||||
| Total Loans | 391,903 | 383,086 | 382,727 | ||||||||||||
| Allowance for loan losses | (5,838 | ) | (6,613 | ) | (5,437 | ) | |||||||||
| Net loans | 386,065 | 376,473 | 377,290 | ||||||||||||
| Premises and equipment | 9,507 | 9,660 | 9,843 | ||||||||||||
| Other real estate held for sale | 5,212 | 5,562 | 5,758 | ||||||||||||
| Other assets | 15,600 | 14,286 | 15,618 | ||||||||||||
| TOTAL ASSETS | $ | 498,598 | $ | 478,696 | $ | 499,006 | |||||||||
| LIABILITIES AND SHAREHOLDERS' EQUITY | |||||||||||||||
| LIABILITIES: | |||||||||||||||
| Deposits: | |||||||||||||||
| Noninterest bearing deposits | $ | 53,736 | $ | 41,264 | $ | 44,402 | |||||||||
| NOW, money market, checking | 157,596 | 134,703 | 127,828 | ||||||||||||
| Savings | 15,618 | 17,670 | 20,265 | ||||||||||||
| CDs < $100,000 | 119,893 | 96,977 | 94,560 | ||||||||||||
| CDs > $100,000 | 24,138 | 22,698 | 22,809 | ||||||||||||
| Brokered | 34,077 | 73,467 | 94,660 | ||||||||||||
| Total deposits | 405,058 | 386,779 | 404,524 | ||||||||||||
| Borrowings: | |||||||||||||||
| Federal Home Loan Bank | 35,000 | 35,000 | 35,000 | ||||||||||||
| Other | 997 | 1,069 | 1,069 | ||||||||||||
| Total borrowings | 35,997 | 36,069 | 36,069 | ||||||||||||
| Other liabilities | 2,064 | 1,966 | 2,426 | ||||||||||||
| Total liabilities | 443,119 | 424,814 | 443,019 | ||||||||||||
| SHAREHOLDERS' EQUITY | |||||||||||||||
| Preferred stock - No par value: Authorized 500,000 shares 11,000 issued and outstanding | 10,866 | 10,706 | 10,658 | ||||||||||||
| Common stock and additional paid in capital - No par value | |||||||||||||||
| Authorized - 18,000,000 shares | |||||||||||||||
| Issued and outstanding - 3,419,736 shares | 43,525 | 43,525 | 43,517 | ||||||||||||
| Accumulated earnings (deficit) | 607 | (961 | ) | 1,131 | |||||||||||
| Accumulated other comprehensive income | 481 | 612 | 681 | ||||||||||||
| Total shareholders' equity | 55,479 | 53,882 | 55,987 | ||||||||||||
| TOTAL LIABILITIES AND SHAREHOLDERS' EQUITY | $ | 498,598 | $ | 478,696 | $ | 499,006 | |||||||||
| MACKINAC FINANCIAL CORPORATION AND SUBSIDIARIES | ||||||||||||||||
| CONSOLIDATED STATEMENTS OF OPERATIONS | ||||||||||||||||
| (Dollars in thousands except per share data) | Three Months Ended | Nine Months Ended | ||||||||||||||
| September 30, | September 30, | |||||||||||||||
| 2011 | 2010 | 2011 | 2010 | |||||||||||||
| (Unaudited) | (Unaudited) | |||||||||||||||
| INTEREST INCOME: | ||||||||||||||||
| Interest and fees on loans: | ||||||||||||||||
| Taxable | $ | 5,584 | $ | 5,300 | $ | 15,918 | $ | 15,718 | ||||||||
| Tax-exempt | 35 | 46 | 114 | 145 | ||||||||||||
| Interest on securities: | ||||||||||||||||
| Taxable | 304 | 324 | 878 | 1,077 | ||||||||||||
| Tax-exempt | 7 | 7 | 21 | 21 | ||||||||||||
| Other interest income | 26 | 23 | 89 | 100 | ||||||||||||
| Total interest income | 5,956 | 5,700 | 17,020 | 17,061 | ||||||||||||
| INTEREST EXPENSE: | ||||||||||||||||
| Deposits | 1,091 | 1,414 | 3,541 | 4,309 | ||||||||||||
| Borrowings | 156 | 222 | 452 | 643 | ||||||||||||
| Total interest expense | 1,247 | 1,636 | 3,993 | 4,952 | ||||||||||||
| Net interest income | 4,709 | 4,064 | 13,028 | 12,109 | ||||||||||||
| Provision for loan losses | 400 | 1,000 | 1,000 | 4,700 | ||||||||||||
| Net interest income after provision for loan losses | 4,309 | 3,064 | 12,028 | 7,409 | ||||||||||||
| OTHER INCOME: | ||||||||||||||||
| Service fees | 180 | 264 | 616 | 737 | ||||||||||||
| Net security gains | - | (1 | ) | - | 215 | |||||||||||
| Income from loans sold | 478 | 334 | 1,863 | 958 | ||||||||||||
| Mortgage servicing rights | 300 | - | 300 | - | ||||||||||||
| Other | 48 | 51 | 152 | 138 | ||||||||||||
| Total other income | 1,006 | 648 | 2,931 | 2,048 | ||||||||||||
| OTHER EXPENSES: | ||||||||||||||||
| Salaries and employee benefits | 1,811 | 1,779 | 5,441 | 5,281 | ||||||||||||
| Occupancy | 334 | 358 | 1,048 | 1,048 | ||||||||||||
| Furniture and equipment | 197 | 202 | 612 | 593 | ||||||||||||
| Data processing | 177 | 193 | 532 | 587 | ||||||||||||
| Professional service fees | 165 | 168 | 550 | 502 | ||||||||||||
| Loan and deposit | 288 | 212 | 719 | 665 | ||||||||||||
| ORE Writedowns and (gains)/losses on sale | 296 | 7 | 728 | 2,000 | ||||||||||||
| FDIC Insurance Assessment | 215 | 222 | 755 | 665 | ||||||||||||
| Telephone | 51 | 53 | 160 | 145 | ||||||||||||
| Advertising | 93 | 77 | 292 | 220 | ||||||||||||
| Other | 333 | 330 | 912 | 854 | ||||||||||||
| Total other expenses | 3,960 | 3,601 | 11,749 | 12,560 | ||||||||||||
| Income (Loss) before provision for income taxes | 1,355 | 111 | 3,210 | (3,103 | ) | |||||||||||
| Provision for (benefit of) income taxes | 455 | 30 | 1,071 | (4,593 | ) | |||||||||||
| NET INCOME | 900 | 81 | 2,139 | 1,490 | ||||||||||||
| Preferred dividend expense | 193 | 185 | 573 | 556 | ||||||||||||
| NET INCOME (LOSS) AVAILABLE TO COMMON SHAREHOLDERS | $ | 707 | $ | (104 | ) | $ | 1,566 | $ | 934 | |||||||
| INCOME (LOSS) PER COMMON SHARE: | ||||||||||||||||
| Basic | $ | .21 | $ | (.03 | ) | $ | .46 | $ | .27 | |||||||
| Diluted | $ | .20 | $ | (.03 | ) | $ | .45 | $ | .27 | |||||||
| MACKINAC FINANCIAL CORPORATION AND SUBSIDIARIES | ||||||||||
| LOAN PORTFOLIO AND CREDIT QUALITY | ||||||||||
| (Dollars in thousands) | ||||||||||
| Loan Portfolio Balances (at end of period): | ||||||||||
| September 30, | December 31, | September 30, | ||||||||
| 2011 | 2010 | 2010 | ||||||||
| Commercial Loans | ||||||||||
| Real estate - operators of nonresidential buildings | $ | 62,567 | $ | 58,114 | $ | 52,192 | ||||
| Hospitality and tourism | 33,867 | 37,737 | 39,998 | |||||||
| Commercial construction | 19,771 | 33,330 | 25,718 | |||||||
| Lessors of residential buildings | 16,433 | 16,598 | 15,854 | |||||||
| Other | 166,497 | 151,268 | 161,500 | |||||||
| Total Commercial Loans | 299,135 | 297,047 | 295,262 | |||||||
| Consumer Loans | ||||||||||
| 1-4 family residential real estate | 78,759 | 75,074 | 74,829 | |||||||
| Consumer construction | 7,741 | 5,682 | 7,483 | |||||||
| Consumer | 6,268 | 5,283 | 5,153 | |||||||
| Total Loans | $ | 391,903 | $ | 383,086 | $ | 382,727 | ||||
| MACKINAC FINANCIAL CORPORATION AND SUBSIDIARIES | |||||||||||||||||||||
| QUARTERLY FINANCIAL HIGHLIGHTS | |||||||||||||||||||||
| QUARTER ENDED | |||||||||||||||||||||
| (Unaudited) | |||||||||||||||||||||
| September 30, | June 30, | March 31, | December 31, | September 30, | |||||||||||||||||
| 2011 | 2011 | 2011 | 2010 | 2010 | |||||||||||||||||
| BALANCE SHEET (Dollars in thousands) | |||||||||||||||||||||
| Total loans | $ | 391,903 | $ | 394,812 | $ | 374,609 | $ | 383,086 | $ | 382,727 | |||||||||||
| Allowance for loan losses | (5,838 | ) | (6,155 | ) | (6,184 | ) | (6,613 | ) | (5,437 | ) | |||||||||||
| Total loans, net | 386,065 | 388,657 | 368,425 | 376,473 | 377,290 | ||||||||||||||||
| Total assets | 492,373 | 492,373 | 492,790 | 478,696 | 499,006 | ||||||||||||||||
| Core deposits | 346,843 | 329,958 | 315,638 | 290,614 | 287,055 | ||||||||||||||||
| Noncore deposits (1) | 58,215 | 69,709 | 85,145 | 96,165 | 117,469 | ||||||||||||||||
| Total deposits | 405,058 | 399,667 | 400,783 | 386,779 | 404,524 | ||||||||||||||||
| Total borrowings | 35,997 | 36,069 | 36,069 | 36,069 | 36,069 | ||||||||||||||||
| Common shareholders' equity | 44,613 | 43,973 | 43,340 | 43,176 | 45,329 | ||||||||||||||||
| Total shareholders' equity | 55,479 | 54,784 | 54,097 | 53,882 | 55,987 | ||||||||||||||||
| Total shares outstanding | 3,419,736 | 3,419,736 | 3,419,736 | 3,419,736 | 3,419,736 | ||||||||||||||||
| AVERAGE BALANCES (Dollars in thousands) | |||||||||||||||||||||
| Assets | $ | 497,333 | $ | 494,481 | $ | 478,861 | $ | 488,320 | $ | 512,335 | |||||||||||
| Loans | 397,665 | 378,250 | 380,066 | 385,296 | 385,268 | ||||||||||||||||
| Deposits | 403,957 | 401,549 | 386,743 | 393,266 | 416,847 | ||||||||||||||||
| Common equity | 44,176 | 43,363 | 43,147 | 44,339 | 46,041 | ||||||||||||||||
| Equity | 54,998 | 54,138 | 53,870 | 55,015 | 56,668 | ||||||||||||||||
| INCOME STATEMENT (Dollars in thousands) | |||||||||||||||||||||
| Net interest income | $ | 4,709 | $ | 4,178 | $ | 4,141 | $ | 4,276 | $ | 4,064 | |||||||||||
| Provision for loan losses | 400 | 600 | - | 1,800 | 1,000 | ||||||||||||||||
| Net interest income after provision | 4,309 | 3,578 | 4,141 | 2,476 | 3,064 | ||||||||||||||||
| Total other income | 1,006 | 1,348 | 577 | 747 | 648 | ||||||||||||||||
| Total other expense | 3,960 | 3,729 | 4,059 | 4,037 | 3,601 | ||||||||||||||||
| Income before taxes | 1,355 | 1,197 | 659 | (814 | ) | 111 | |||||||||||||||
| Provision for (benefit of) income taxes | 455 | 402 | 214 | 1,093 | 30 | ||||||||||||||||
| Net income | 900 | 795 | 445 | (1,907 | ) | 81 | |||||||||||||||
| Preferred dividend expense | 193 | 192 | 189 | 185 | 185 | ||||||||||||||||
| Net income (loss) available to common shareholders | $ | 707 | $ | 603 | $ | 256 | $ | (2,092 | ) | $ | (104 | ) | |||||||||
| PER SHARE DATA | |||||||||||||||||||||
| Earnings | $ | .21 | $ | .18 | $ | .07 | $ | (.61 | ) | $ | (.03 | ) | |||||||||
| Book value per common share | 13.05 | 12.86 | 12.67 | 12.63 | 13.26 | ||||||||||||||||
| Market value, closing price | 5.46 | 6.00 | 6.02 | 4.58 | 5.10 | ||||||||||||||||
| ASSET QUALITY RATIOS | |||||||||||||||||||||
| Nonperforming loans/total loans | 2.47 | % | 2.39 | % | 2.66 | % | 2.76 | % | 2.94 | % | |||||||||||
| Nonperforming assets/total assets | 2.99 | 2.89 | 3.05 | 3.37 | 3.41 | ||||||||||||||||
| Allowance for loan losses/total loans | 1.49 | 1.56 | 1.65 | 1.73 | 1.42 | ||||||||||||||||
| Allowance for loan losses / nonperforming loans | 60.35 | 65.19 | 62.06 | 62.61 | 48.34 | ||||||||||||||||
| Texas ratio (2) | 24.28 | 23.38 | 24.96 | 26.66 | 27.68 | ||||||||||||||||
| PROFITABILITY RATIOS | |||||||||||||||||||||
| Return on average assets | .56 | % | .49 | % | .22 | % | (1.70) | % | (.08) | % | |||||||||||
| Return on average common equity | 6.35 | 5.58 | 2.40 | (18.72 | ) | (.90 | ) | ||||||||||||||
| Return on average equity | 5.10 | 4.47 | 1.92 | (15.09 | ) | (.73 | ) | ||||||||||||||
| Net interest margin | 4.14 | 3.79 | 3.92 | 3.88 | 3.69 | ||||||||||||||||
| Efficiency ratio | 67.39 | 67.84 | 75.73 | 65.05 | 75.98 | ||||||||||||||||
| Average loans/average deposits | 98.44 | 94.20 | 98.27 | 97.97 | 92.42 | ||||||||||||||||
| CAPITAL ADEQUACY RATIOS | |||||||||||||||||||||
| Tier 1 leverage ratio | 9.73 | % | 9.50 | % | 9.70 | % | 9.25 | % | 9.22 | % | |||||||||||
| Tier 1 capital to risk weighted assets | 11.65 | 11.40 | 11.61 | 11.36 | 11.73 | ||||||||||||||||
| Total capital to risk weighted assets | 12.97 | 12.66 | 12.86 | 12.62 | 12.98 | ||||||||||||||||
| Average equity/average assets | 11.06 | 10.95 | 11.25 | 11.27 | 11.06 | ||||||||||||||||
| Tangible equity/tangible assets | 11.06 | 10.95 | 11.25 | 11.27 | 11.06 | ||||||||||||||||
(1) Noncore deposits includes Internet CDs, brokered deposits and CDs greater than $100,000
(2) Texas ratio equals nonperforming assets divided by shareholders' equity plus allowance for loan losses
Contact Information:
Contact:
Investor Relations
(888) 343-8147
Website: www.bankmbank.com