HOUSTON, TX--(Marketwire - Nov 9, 2011) - Magnum Hunter Resources Corporation (
Financial Results for the Three Months Ended September 30, 2011
Magnum Hunter reported an increase in total revenues of 310% for the third quarter of 2011 compared to the third quarter of 2010. Total revenues were $32.4 million for the three months ended September 30, 2011 compared to $7.9 million for the three months ended September 30, 2010. The increase in revenues was driven principally by the significant increase in production derived from both the NGAS and NuLoch acquisitions along with the Company's ongoing drilling programs in its three unconventional resource plays. Operating margins also improved substantially as lease operating expenses per barrel of oil equivalent ("Boe") declined from $22.32 per Boe to $15.69 per Boe, primarily due to the addition of new production, divestitures of high lifting cost conventional properties, and tighter controls on field operating expenses. Recurring cash general and administrative costs per Boe also declined from $29.81 to $15.83 per Boe. The Company anticipates this trend of improving operating statistics to continue during the fourth quarter of 2011 and into fiscal year 2012.
The Company reported a net loss of $1.9 million or ($0.01) per basic and diluted common shares outstanding for the third quarter of 2011, compared to a net loss of $4.3 million, or ($0.07) per basic and diluted common shares outstanding during the third quarter of 2010. The Company's net loss per share for the third quarter of 2011 would have been ($0.05) when adjusted for non-recurring and non-cash charges of ($5.2) million including: unrealized gain on derivatives of $17.4 million (-$0.13 per share); non-cash compensation expense of $8.8 million ($0.07 per share); acquisition-related and non-recurring expenses of $1.8 million ($0.01 per share); and other non-recurring and non-cash charges of $1.6 million ($0.01).
For the three months ended September 30, 2011, Magnum Hunter's 'Adjusted Earnings Before Interest, Income Taxes, Depreciation and Amortization' ("Adjusted EBITDA") was $10.4 million or $0.08 per basic and diluted common shares outstanding compared to $0.3 million for the similar period in 2010.
Financial Results for the Nine Months Ended September 30, 2011
Magnum Hunter reported an increase in revenues of 249% for the nine months ended September 30, 2011 compared to the nine months ended September 30, 2010. Total revenues were $80.1 million for the nine months ended September 30, 2011 compared to $23.0 million during the nine months ended September 30, 2010. This increase in revenues was driven principally by the significant increase in production from the Company's recent acquisitions and the successful drilling programs in its three unconventional resource plays. Operating margins also improved substantially as lease operating expenses per Boe declined from $22.56 per Boe to $14.60 per Boe; and recurring cash general and administrative costs per Boe also declined significantly from $32.86 per Boe to $14.98 per Boe.
The Company reported a net loss of $29.7 million or ($0.28) per basic and diluted common shares outstanding for the nine months ended September 30, 2011, compared to a net loss of $14.4 million, or ($0.23) per basic and diluted common shares outstanding during the nine months ended September 30, 2010. The Company's net loss for the nine months ended September 30, 2011 would have been ($0.10) per basic and diluted common shares outstanding when adjusted for non-recurring and non-cash charges of $19.5 million including: unrealized gain on derivatives of $17.2 million (-$0.16 per share); non-cash compensation expense of $22.5 million ($0.21 per share); acquisition-related and non-recurring expenses of $10.4 million ($0.10 per share); and other non-recurring and non-cash charges of $3.8 million ($0.04).
For the nine months ended September 30, 2011, Magnum Hunter's Adjusted EBITDA was $30.3 million or $0.28 per basic and diluted common shares outstanding. Adjusted EBITDA was $3.3 million for the nine months ended September 30, 2010.
Capital Expenditures and Liquidity
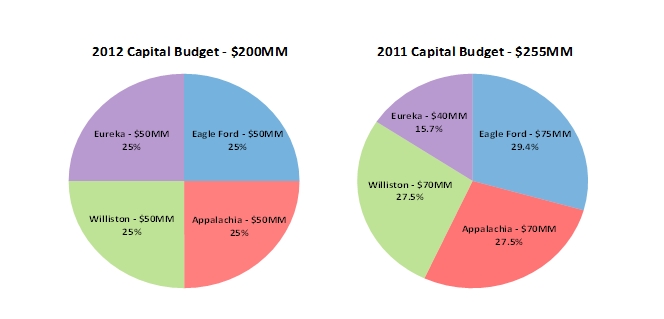
Total capital expenditures incurred during the third quarter of 2011 were $74.2 million, excluding acquisitions. Magnum Hunter's fiscal year 2011 total capital expenditure budget remains at $255 million, with $170.4 million having been expended through September 30, 2011. The Company intends to fund its remaining fiscal year 2011 capital expenditure program through a combination of existing liquidity, increasing internally generated cash flows and availability from the recently announced expansion of the Company's Senior Bank Credit Facilities. Capital expenditures associated with the Eureka Hunter Pipeline will be 100% funded from the $150 million project financing facility (non-recourse to Magnum Hunter, as parent) announced during the third quarter of 2011.
As a result of the Company's internally generated cash flows and available liquidity under its expanded credit facilities, Magnum Hunter has sufficient resources to fund its remaining capital expenditure budget for 2011, as well as the previously announced capital expenditure budget of $200 million for fiscal year 2012. As of September 30, 2011, Magnum Hunter had approximately $117 million available under the Company's existing credit facilities. In addition, as a result of proved reserve additions during the third quarter of 2011, the Company anticipates an additional increase in its current borrowing base of $167.5 million. Furthermore, Magnum Hunter directly controls the operations and timing on approximately 80% of the projects identified in the fiscal year 2012 capital expenditure budget so it retains flexibility to adjust its capital expenditure plan as it deems appropriate.
Production Results for the Three Months Ended September 30, 2011
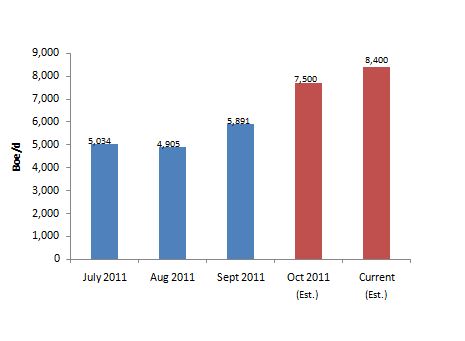
Average daily production during the third quarter ended September 30, 2011 was 5,270 barrels of oil equivalent per day ("Boepd") (47% crude oil) which represents a 303% increase over the 1,308 Boepd reported during the third quarter of 2010 and a 7% increase over the production rate of 4,947 Boepd reported during the second quarter of 2011. The increase in the Company's production rate was a result of both the NGAS and NuLoch acquisitions and the Company's ongoing success in its drilling programs in its three unconventional resource plays. Although the Company realized a significant production increase over prior periods, the third quarter September 30, 2011 production rate was significantly impacted by shut-in production in the Williston Basin due to adverse weather related issues and the installation of new artificial lift in its Eagle Ford properties. These two factors impacted production negatively by approximately 750 Boepd for the third quarter of 2011. The Company was able to fully restore this production by the end of the third quarter and also added substantial production in the second half of September through the completion of new wells in the Eagle Ford (2 gross, 0.8 net), the Marcellus (3 gross, 3 net) and the Williston Basin/Tableland Field of Saskatchewan, Canada (1 gross, 1 net). Much of this new production is 100% working interest to Magnum Hunter's ownership and therefore the incremental impact of these new wells is material to daily production numbers. As a result, the Company's production rate increased in October to approximately 7,500 Boepd. The Company's current daily production is approximately 8,400 Boepd with a number of new wells located in all three divisions currently being fracture stimulated. Magnum Hunter remains on target to achieve its previously stated goal of a daily production exit rate for fiscal year 2011 in excess 10,000 Boepd.
Proved Reserve Overview
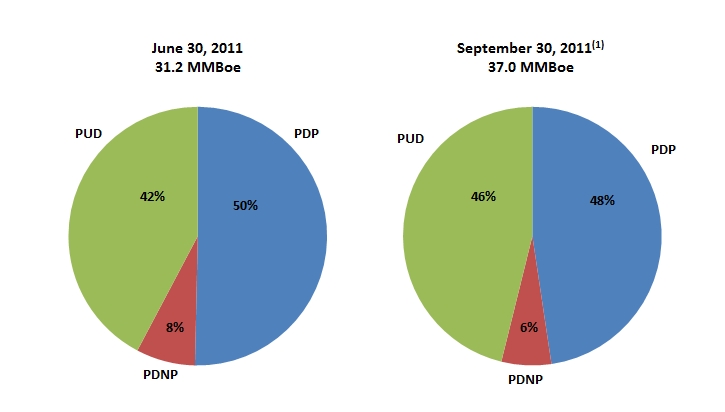
The Company's total proved reserves increased by 5.8 million Boe or 19% to 37.0 million Boe (52% crude oil and ngls; 48% proved developed producing) as of September 30, 2011 as compared to 31.2 million Boe (55% crude oil & ngls; 50% proved developed producing) at June 30, 2011. The increase in total proved reserves is all attributable to new wells completed in the three unconventional resource plays.
Eagle Ford Shale Update
Magnum Hunter has allocated approximately $75 million (29.4% of the total fiscal year 2011 capex budget) to drill 16 gross wells (8.4 net wells) during the year in the oil window of the Eagle Ford Shale play, with the focus predominately in Gonzales and Lavaca Counties, Texas. To-date, Magnum Hunter has drilled and completed 11 gross wells (6.3 net wells) in the Eagle Ford Shale. The Company's 50.0% working interest and operated Furrh #2H well located in Lavaca County, Texas has been drilled to a total measured depth of 15,876 feet (5,945 feet vertically). Fracture stimulation operations for the Furrh #2H were recently completed with 20 frac stages. First production is anticipated on or about November 15th. The Kudu Hunter #1H operated well (40% W.I.) located in Lavaca County, Texas has been drilled to a total measured depth of 16,584 feet (5,500 feet vertically) with casing currently being run. Fracture stimulation operations with 20 stages are expected to begin next week with first production expected prior to the end of November. Magnum Hunter anticipates spudding an additional 5.0 gross wells (2.8 net wells) and completing 2.0 (0.8 net) of these wells by year end 2011. The Company expects a total of 15.0 gross wells (7.5 net wells) on line and flowing to sales by December 31, 2011.
Highlights for the third quarter of 2011 for our Eagle Ford activities include the Oryx Hunter #1H well which posted a 24-hour initial production (IP) rate of 2,044 Boepd, and the Sable Hunter #1H which posted a 24-hour IP rate of 1,017 Boepd. Both wells were completed in late September 2011. Additionally, all producing wells in this region have been tied into a new gas gathering system as of August 1, 2011. The associated natural gas from these producing oil wells had previously been flared since initial production operations began last year. Several wells in the area were required to be shut-in in order to install new ESP (down hole submersible pumps) which the Company believes is resulting in a significant improvement in the IRR for its Eagle Ford wells.
Appalachian/Marcellus Update
In the Appalachian Basin, Magnum Hunter has allocated approximately $70 million (27.5% of the total capital budget) to drill 37 gross wells (22 net wells) during fiscal year 2011. The 2011 capital budget includes approximately $65 million for 17 gross wells (15.5 net wells) targeting the liquids rich Marcellus Shale play of Northwestern West Virginia and Southeastern Ohio and approximately $5 million primarily for 20 gross wells (6.5 net wells) targeting the Huron Shale and Weir Oil Sands located in Kentucky.
Marcellus Shale - Magnum Hunter has drilled 12 gross wells (10.5 net wells) in the liquids-rich Marcellus Shale play in Northwest West Virginia since December of last year. Of these new wells, 10 gross wells (8.5 net wells) are currently producing and 2 gross wells (2.0 net wells), Everett Weese #1107 and #1108, are awaiting fracture stimulation and one gross well (1.0 net), Everett Weese #1109, is currently being drilled. All three of the Everett Weese wells will be completed in sequence during December 2011, and are expected to be on production by December 31, 2011. During September 2011, Triad Hunter successfully completed 3 gross wells (3 net wells); the WVDNR #1102, the WVDNR #1103 and the WVDNR #1104 in Wetzel County, West Virginia with IP rates of 10.0 MMcfed, 10.5 MMcfed, and 10.4 MMcfed, respectively. During October 2011, Triad Hunter completed one vertical Marcellus well, the Roger Weese #1002, and one horizontal Marcellus well, the Roger Weese #1110, with IP rates of 0.4 MMcfed and 9.7 MMcfed, respectively. It should be noted that these wells were tested and remain on restricted production rates until additional pipeline meter expansion has been complete which is expected by November 11, 2011. Magnum Hunter currently anticipates spudding an additional 2 gross wells (2 net wells) in its Marcellus Shale region prior to year-end 2011.
Huron Shale and Weir Oil Sands - Triad Hunter has drilled and completed 10 gross wells (10.0 net wells) on lease acreage acquired earlier this year in the NGAS acquisition, targeting the Huron Shale and Weir Oil Sands. Magnum Hunter currently anticipates spudding an additional 10 gross wells (6.5 net wells), primarily on Huron Shale acreage prior to year-end 2011. Since acquiring NGAS earlier this year, we have drilled 4 gross (4.0 net) Weir wells in Kentucky. We continue to improve our drilling and completion techniques as evidenced by our last Weir well which is still flowing 1,450 Mcfe per day.
Williston/Bakken Update
Williston Hunter's highlights include its successful efforts to restore weather related lost production volumes, complete previously drilled wells and commence production on newly completed wells. Williston Hunter has restored production which was previously shut-in during most of the third quarter. Williston Hunter has an additional 29.0 gross (8.8 net) wells which are currently either in active completion operations or awaiting completion operations. Williston Hunter expects 87% of this production to be light oil.
Magnum Hunter has allocated approximately $70 million, or 27.5%, of the total Company capital budget to this region. This includes the drilling of 52 gross (11.3 net) Middle Bakken/Three Forks Sanish wells, acquiring land, installing production facilities and the completion of 18 gross (4.1 net) wells previously drilled but not completed in 2010. Williston Hunter has identified approximately $25 million in capital projects for the balance of fiscal year 2011, continuing with six drilling rigs active in North Dakota and one active drilling rig in Canada.
As of November 8, 2011, Williston Hunter had drilled 35 gross (6.2 net) wells year-to-date. In North Dakota, 32 gross (3.2 net) wells were spud or in the process of being spudded and 3 gross (3.0 net) wells were drilled in Saskatchewan. Significant progress has been made in reducing the completion backlog of the 18 gross (4.1 net) wells in Williston Hunter's inventory at December 31, 2010. There have been 16 gross (3.9 net) wells now completed and on production. Additionally, 17 gross (3.3 net) wells of the total wells drilled in 2011 have now been completed.
In Divide County, North Dakota, we have experienced higher IP rates on the recently drilled wells due to improved fracture stimulation techniques and down hole pump design, including the Almos Farms well (0.1 net), which was brought on production at a peak rate of 1,236 Boepd. Average IP 24 hour rates at Williston Hunter have been 700 Boepd in North Dakota (two mile laterals) and 425 Boepd for our two most recent wells (one mile laterals) completed in Tableland, Saskatchewan. Our rates of return in Tableland are comparable to North Dakota primarily due to substantially reduced government royalties, improved completion techniques and lower service costs.
Eureka Hunter Appalachian Pipeline System
Magnum Hunter has allocated approximately $40 million (15.7% of the total capital budget) for fiscal year 2011 capex requirements associated with its Eureka Hunter Pipeline ("Eureka Hunter") system in northwest West Virginia. The Company has completed approximately 42 miles of 20 inch high pressure pipe installation. Eureka Hunter believes its actual construction costs have been averaging approximately 50% below that of its competitors. Projects completed during 2011 have included: (i) 8 miles of 20-inch mainline pipe westward to interconnect with our Pursley Lateral; (ii) 14.35 miles of 20-inch pipe known as the "Pursley Lateral" in Tyler County, West Virginia; (iii) acquisition of rights-of-way and commencement of construction of 3.5 miles of 16 inch pipe from the Eureka mainline headed south into Doddridge County, West Virginia; (iv) began clearing rights-of-way to commence construction in the first quarter of 2012 of approximately 10 miles of 20-inch pipe to be known as the "Wetzel DNR Lateral"; and (v) began acquiring rights-of-way in preparation of building approximately 8 miles of 20-inch pipe to be known as the "Mobley Lateral." The Mobley Lateral will connect Eureka Hunter to the MarkWest Mobley processing facility (the "Mobley Plant") by the end of the second quarter of 2012. Eureka Hunter also recently announced a processing agreement with MarkWest to provide a "full liquids solution" both to Magnum Hunter on its equity gas from the Marcellus as well as provides a solution to third party producers through the Mobley Plant. The Eureka Hunter Pipeline system has a total of approximately 182 miles of pipeline/existing rights-of-way that will ultimately have capacity to gather 200-300 MMcf per day in northwest West Virginia.
Management Comments
Mr. Gary C. Evans, Chairman of the Board and Chief Executive Officer of Magnum Hunter Resources, commented, "Our business plan remains on track and our results in all of our three unconventional plays continue to improve. Additionally, our midstream activities with respect to new pipe installation in West Virginia and Ohio is growing rapidly and staying significantly ahead of our competition. Daily production is accelerating in each region with new successful well completions. Our division heads have taken the lead in trying new completion techniques which include different frac sand designs, new fracture stimulation tools, chemicals, submersible pumps, etc., that are giving us some outstanding production results from newly drilled wells. Our goal is to become best in our class when compared to other industry competitors active in our area of operations. At the same time production volumes are being added, we are driving down our lifting costs which will enable us to continue to deliver an improving expansion in our net profit margins. With a combination of new production from recently completed wells and wells being currently fraced, Magnum Hunter remains on target to exit 2011 above our stated goal of 10,000 barrels of oil equivalent per day."
Non-GAAP Financial Measures and Reconciliations
Note: Adjusted EBITDA is a non-GAAP financial accounting measure and as such, a full reconciliation of the above exhibited Adjusted EBITDA numbers to the Company's reported net income for the three and nine months ended September 30, 2010 and 2011 using standardized GAAP financial accounting methodology and as reported to and filed with the Securities and Exchange Commission can be found and is exhibited in the footnotes of this press release below. Also, a reconciliation of the recurring loss per common share to the reported loss per common share and a reconciliation to recurring cash G&A for the three and nine months ended September 30, 2011 are provided in the footnotes of this press release below. These non-GAAP financial measures should be considered in addition to, but not as a substitute for, measures for financial performance prepared in accordance with GAAP that are presented in this release. We believe these non-GAAP financial measures to be important measures for evaluating the relative significance of our financial information used by equity analysts and investors.
| Production and Commodity Pricing | ||||||||||||||
| Three Months Ended | Nine Months Ended | |||||||||||||
| September 30, | September 30, | |||||||||||||
| 2011 | 2010 | 2011 | 2010 | |||||||||||
| Production | ||||||||||||||
| Oil (MBbls) | 198 | 77 | 497 | 225 | ||||||||||
| Gas (MMcfs) | 1,535 | 260 | 3,706 | 719 | ||||||||||
| NGL (MBbls) | 31 | 0 | 57 | 0 | ||||||||||
| Total (MBoe) | 485 | 120 | 1,172 | 345 | ||||||||||
| Total (Boe/d) | 5,270 | 1,308 | 4,292 | 1,264 | ||||||||||
| Average prices | ||||||||||||||
| Oil (per Bbl) | $ | 84.03 | $ | 68.95 | $ | 89.12 | $ | 70.61 | ||||||
| Gas (per Mcf) | $ | 4.52 | $ | 4.90 | $ | 4.93 | $ | 5.21 | ||||||
| NGL (per Bbl) | $ | 63.73 | N/A | $ | 52.84 | N/A | ||||||||
| Total average price (per Boe) | $ | 52.69 | $ | 54.68 | $ | 55.95 | $ | 56.94 | ||||||
| LOE - $/Boe | $ | 15.69 | $ | 22.32 | $ | 14.60 | $ | 22.56 | ||||||
| Recurring Cash G&A - $/Boe | $ | 15.83 | $ | 29.81 | $ | 14.98 | $ | 32.86 | ||||||
| MAGNUM HUNTER RESOURCES CORPORATION | |||||||||
| UNAUDITED CONDENSED CONSOLIDATED BALANCE SHEETS | |||||||||
| (In thousands, except shares and per-share data) | |||||||||
| September 30, | December 31, | ||||||||
| 2011 | 2010 | ||||||||
| ASSETS | |||||||||
| CURRENT ASSETS: | |||||||||
| Cash and cash equivalents | $ | 8,175 | $ | 554 | |||||
| Accounts receivable | 37,178 | 11,705 | |||||||
| Derivatives | 7,677 | - | |||||||
| Prepaids and other current assets | 5,848 | 867 | |||||||
| Total current assets | 58,878 | 13,126 | |||||||
| PROPERTY AND EQUIPMENT (Net of Accumulated Depletion and Depreciation): | |||||||||
| Oil and natural gas properties, successful efforts accounting | 888,219 | 189,912 | |||||||
| Gas gathering and other equipment | 109,888 | 42,689 | |||||||
| Total property and equipment, net | 998,107 | 232,601 | |||||||
| OTHER ASSETS: | |||||||||
| Deferred financing costs, net of amortization of $408 and $1,237 respectively | 10,967 | 2,678 | |||||||
| Derivatives and other long-term assets | 9,612 | 562 | |||||||
| Total assets | $ | 1,077,564 | $ | 248,967 | |||||
| LIABILITIES AND SHAREHOLDERS' EQUITY | |||||||||
| CURRENT LIABILITIES: | |||||||||
| Current portion of notes payable | $ | 4,344 | $ | 7,132 | |||||
| Accounts payable | 91,797 | 33,319 | |||||||
| Accrued liabilities | 12,329 | 435 | |||||||
| Revenue payable | 5,745 | 2,630 | |||||||
| Derivatives and other current liabilities | 1,357 | 719 | |||||||
| Total current liabilities | 115,572 | 44,235 | |||||||
| OTHER LIABILITIES: | |||||||||
| Notes payable, less current portion | 209,507 | 26,019 | |||||||
| Asset retirement obligation | 14,707 | 4,455 | |||||||
| Deferred tax liability | 94,763 | - | |||||||
| Derivatives and other long term liabilities | 2,769 | 700 | |||||||
| Total liabilities | 437,318 | 75,409 | |||||||
| COMMITMENTS AND CONTINGENCIES (Note 13) | |||||||||
| REDEEMABLE PREFERRED STOCK: | |||||||||
| Series C Cumulative Perpetual Preferred Stock, cumulative dividend rate 10.25% per annum, 4,000,000 authorized, 4,000,000 and 2,809,456 issued & outstanding as of September 30, 2011 and December 31, 2010, respectively, with liquidation preference of $25.00 per share | 100,000 | 70,236 | |||||||
| SHAREHOLDERS' EQUITY: | |||||||||
| Preferred Stock, 10,000,000 shares authorized | - | - | |||||||
| Series D Cumulative Perpetual Preferred Stock, cumulative dividend rate 8.0% per annum, 5,750,000 authorized, 1,421,237 and none issued & outstanding as of September 30, 2011 and December 31, 2010, respectively, with liquidation preference of $50.00 per share | 71,062 | - | |||||||
| Common stock, $0.01 par value, 250,000,000 shares authorized, 129,983,781 and 74,863,135 shares issued and 129,516,860 and 74,863,135 outstanding as of September 30, 2011 and December 31, 2010, respectively | 1,295 |
749 |
|||||||
| Exchangeable common stock, par value $0.01 per share, 3,778,245 and none issued & outstanding as of September 30, 2011 and December 31, 2010, respectively | 38 | - | |||||||
| Additional paid in capital | 564,255 | 152,439 | |||||||
| Accumulated deficit | (79,149 | ) | (49,402 | ) | |||||
| Accumulated other comprehensive income | (17,460 | ) | - | ||||||
| Treasury stock at cost, 761,652 shares | (1,310 | ) | (1,310 | ) | |||||
| Unearned common stock in KSOP at cost, 153,300 shares | (604 | ) | (604 | ) | |||||
| Total Magnum Hunter Resources Corporation shareholders' equity | 538,127 | 101,872 | |||||||
| Non-controlling interest | 2,119 | 1,450 | |||||||
| Total shareholders' equity | 540,246 | 103,322 | |||||||
| Total liabilities and shareholders' equity | $ | 1,077,564 | $ | 248,967 | |||||
| MAGNUM HUNTER RESOURCES CORPORATION | |||||||||||||||||
| UNAUDITED CONDENSED CONSOLIDATED STATEMENTS OF OPERATIONS | |||||||||||||||||
| (In thousands, except shares and per-share data) | |||||||||||||||||
| Three Months Ended | Nine Months Ended | ||||||||||||||||
| September 30, | September 30, | ||||||||||||||||
| 2011 | 2010 | 2011 | 2010 | ||||||||||||||
| REVENUE: | |||||||||||||||||
| Oil and gas sales | $ | 25,547 | $ | 6,578 | $ | 65,555 | $ | 19,647 | |||||||||
| Field operations and other | 6,892 | 1,342 | 14,545 | 3,330 | |||||||||||||
| Total revenue | 32,439 | 7,920 | 80,100 | 22,977 | |||||||||||||
| EXPENSES: | |||||||||||||||||
| Lease operating expenses | 7,606 | 2,686 | 17,101 | 7,785 | |||||||||||||
| Severance taxes and marketing | 1,933 | 648 | 4,729 | 1,878 | |||||||||||||
| Exploration | 403 | 241 | 1,140 | 697 | |||||||||||||
| Field operations | 5,954 | 1,300 | 10,184 | 3,143 | |||||||||||||
| Impairment of oil & gas properties | - | 20 | - | 20 | |||||||||||||
| Depreciation, depletion and accretion | 12,485 | 1,786 | 28,829 | 5,888 | |||||||||||||
| General and administrative | 17,378 | 4,634 | 47,949 | 17,903 | |||||||||||||
| Total expenses | 45,759 | 11,315 | 109,932 | 37,314 | |||||||||||||
| OPERATING LOSS | (13,320 | ) | (3,395 | ) | (29,832 | ) | (14,337 | ) | |||||||||
| OTHER INCOME AND (EXPENSE): | |||||||||||||||||
| Interest income | 10 | 50 | 14 | 55 | |||||||||||||
| Interest expense | (2,272 | ) | (982 | ) | (6,988 | ) | (2,675 | ) | |||||||||
| Gain (loss) on derivative contracts | 17,341 | (62 | ) | 16,667 | 2,348 | ||||||||||||
| Other income and (expense) | 24 | - | 112 | - | |||||||||||||
| Total other income & expense | 15,103 | (994 | ) | 9,804 | (272 | ) | |||||||||||
| Gain (loss) from continuing operations before income taxes and non-controlling interest | 1,783 | (4,389 | ) | (20,027 | ) | (14,609 | ) | ||||||||||
| Income tax benefit | 272 | - | 470 | - | |||||||||||||
| Net income attributable to non-controlling interest | (55 | ) | (26 | ) | (172 | ) | (91 | ) | |||||||||
| Net income (loss) attributable to Magnum Hunter Resources Corporation from continuing operations | 2,000 | (4,415 | ) | (19,729 | ) | (14,700 | ) | ||||||||||
| Income from discontinued operations | - | 690 | - | 1,645 | |||||||||||||
| Net income (loss) | 2,000 | (3,725 | ) | (19,729 | ) | (13,055 | ) | ||||||||||
| Dividend on Preferred Stock | (3,952 | ) | (601 | ) | (10,017 | ) | (1,310 | ) | |||||||||
| Net loss attributable to common shareholders | $ | (1,952 | ) | $ | (4,326 | ) | $ | (29,746 | ) | $ | (14,365 | ) | |||||
| Weighted average number of common shares | |||||||||||||||||
| Basic | 131,082,854 | 67,996,180 | 106,651,326 | 62,010,895 | |||||||||||||
| Basic | |||||||||||||||||
| Net loss from continuing operations | $ | (0.01 | ) | $ | (0.07 | ) | $ | (0.28 | ) | $ | (0.26 | ) | |||||
| Net income from discontinued operations | $ | - | $ | 0.01 | $ | - | $ | 0.03 | |||||||||
| Net loss per common share | $ | (0.01 | ) | $ | (0.06 | ) | $ | (0.28 | ) | $ | (0.23 | ) | |||||
| MAGNUM HUNTER RESOURCES CORPORATION | ||||||||||||||||
| UNAUDITED CONSOLIDATED STATEMENTS OF OTHER COMPREHENSIVE INCOME | ||||||||||||||||
| (In thousands, except shares and per-share data) | ||||||||||||||||
| For the Three Months Ended September 30, | For the Nine Months Ended September 30, |
|||||||||||||||
| 2011 | 2010 | 2011 | 2010 | |||||||||||||
| Net income (loss) | $ | 2,000 | $ | (3,725 | ) | $ | (19,730 | ) | $ | (13,055 | ) | |||||
| Foreign currency translation | (14,320 | ) | - | (17,542 | ) | - | ||||||||||
| Unrealized gain (loss) on available for sale investments | 74 | - | 82 | - | ||||||||||||
| Total comprehensive loss | $ | (12,246 | ) | $ | (3,725 | ) | $ | (37,190 | ) | $ | (13,055 | ) | ||||
| MAGNUM HUNTER RESOURCES CORPORATION | |||||||||
| UNAUDITED CONDENSED CONSOLIDATED STATEMENTS OF CASH FLOWS | |||||||||
| (In thousands) | |||||||||
| Nine Months Ended | |||||||||
| September 30, | |||||||||
| 2011 | 2010 | ||||||||
| Cash flows from operating activities | |||||||||
| Net loss | $ | (19,729 | ) | $ | (13,055 | ) | |||
| Adjustments to reconcile net loss to net cash provided by operating activities: | |||||||||
| Noncontrolling Interest | 172 | 91 | |||||||
| Depletion, depreciation, and accretion | 28,829 | 7,138 | |||||||
| Amortization of deferred financing costs included in interest expense | 3,045 | 861 | |||||||
| Gain on sale of assets | (589 | ) | (47 | ) | |||||
| Cash paid for plugging wells | (8 | ) | - | ||||||
| Share-based compensation | 19,922 | 5,151 | |||||||
| Unrealized (gain) loss on derivative contracts | (17,221 | ) | 1,181 | ||||||
| Asset impairment | - | 20 | |||||||
| Deferred taxes | (470 | ) | - | ||||||
| Changes in operating assets and liabilities: | |||||||||
| Accounts receivable and accrued revenue | (9,054 | ) | 1,158 | ||||||
| Inventory | (3,006 | ) | 70 | ||||||
| Prepaid expenses and other current assets | (675 | ) | (502 | ) | |||||
| Accounts payable | 6,596 | (1,577 | ) | ||||||
| Revenue payable | 1,943 | 138 | |||||||
| Accrued Liabilities | 553 | 3,018 | |||||||
| Net cash provided by operating activities | 10,308 | 3,645 | |||||||
| Cash flows from investing activities | |||||||||
| Capital expenditures and advances | (201,618 | ) | (26,690 | ) | |||||
| Cash paid in acquisitions, net of cash received of $2.5 million | (78,523 | ) | (59,500 | ) | |||||
| Change in restricted cash and deposits | (2,837 | ) | (980 | ) | |||||
| Proceeds from sales of assets | 9,408 | 50 | |||||||
| Net cash used in investing activities | (273,570 | ) | (87,120 | ) | |||||
| Cash flows from financing activities | |||||||||
| Net proceeds from sale of common stock and warrants | 13,892 | 24,423 | |||||||
| Net proceeds from sale of preferred shares | 94,042 | 22,879 | |||||||
| Proceeds from exercise of warrants and options | 7,126 | 13,799 | |||||||
| Purchase of company shares and loan to KSOP | - | (541 | ) | ||||||
| Options surrendered for cash | - | (116 | ) | ||||||
| Preferred stock dividend paid | (10,017 | ) | (1,335 | ) | |||||
| Cash paid upon conversion of Series B Preferred Stock | - | (11,250 | ) | ||||||
| Proceeds from borrowings on debt | 408,587 | 72,580 | |||||||
| Principal repayment of debt | (234,047 | ) | (35,779 | ) | |||||
| Payment of deferred financing costs | (8,528 | ) | (2,630 | ) | |||||
| Change in other long-term liabilities | 59 | - | |||||||
| Net cash provided by financing activities | 271,114 | 82,030 | |||||||
| Effect of exchange rate changes on cash | (231 | ) | - | ||||||
| Net increase (decrease) in cash and cash equivalents | 7,621 | (1,445 | ) | ||||||
| Cash and cash equivalents, beginning of period | 554 | 2,282 | |||||||
| Cash and cash equivalents, end of period | $ | 8,175 | $ | 837 | |||||
| Supplemental disclosure of cash flow information | |||||||||
| Cash paid for interest | $ | 3,867 | $ | 1,966 | |||||
| Non-cash transactions | |||||||||
| Series B Preferred stock issued for acquisition of Triad | $ | - | $ | 14,982 | |||||
| Debt assumed in acquisition | $ | 71,895 | $ | 3,411 | |||||
| Common stock issued for payment of services | $ | 779 | $ | 165 | |||||
| Common stock issued in conversion of Series C stock | $ | - | $ | 3,732 | |||||
| Accrued capital expenditures | $ | (12,412 | ) | $ | 10,253 | ||||
| Common stock issued for acquisition | $ | 345,537 | $ | - | |||||
| Exchangeable common stock issued for acquisition of NuLoch Resources | $ | 31,642 | $ | - | |||||
| Warrants issued for payment of common stock dividends | $ | 6,695 | $ | - | |||||
| Warrants issued for payment of dividends on MHR Exchangeco exchangeable shares | $ | 197 | $ | - | |||||
| Recurring Loss per Common Share Reconciliation | |||||||||
| Three Months Ended | Nine Months Ended | ||||||||
| September 30, 2011 | September 30, 2011 | ||||||||
| Net loss attributable to common shareholders - reported | $ | (1,951 | ) | $ | (29,746 | ) | |||
| Non-recurring and non-cash items: | |||||||||
| Exploration expense | $ | 403 | $ | 1,140 | |||||
| Non-Cash: write-off of deferred financing costs | $ | 0 | $ | 2,300 | |||||
| Non-Cash: compensation expense | $ | 8,779 | $ | 22,519 | |||||
| Non-recurring acquisition and other expense | $ | 1,760 | $ | 10,377 | |||||
| Unrealized (gain) loss on derivatives | $ | (17,386 | ) | $ | (17,221 | ) | |||
| (Gain) Loss on Sale of Assets | $ | 908 | (651 | ) | |||||
| Non-recurring LOE | $ | 316 | $ | 1,044 | |||||
| Total non-recurring and non-cash items | $ | (5,222 | ) | $ | 19,508 | ||||
| Net loss attributable to common shareholders - recurring | $ | (7,173 | ) | $ | (10,238 | ) | |||
| Recurring loss per common share - basic and diluted | $ | (0.05 | ) | $ | (0.10 | ) | |||
| Recurring G&A Reconciliation | |||||||||||||
| Three Months Ended | Nine Months Ended | ||||||||||||
| September 30, | September 30, | ||||||||||||
| 2011 | 2010 | 2011 | 2010 | ||||||||||
| Total G&A | $ | 17,378 | $ | 4,634 | $ | 47,949 | $ | 17,903 | |||||
| Adjustments: | |||||||||||||
| Non-cash stock compensation | 7,945 | 1,028 | 20,019 | 5,151 | |||||||||
| Acquisition and other non-recurring expense | 1,760 | 20 | 10,377 | 1,415 | |||||||||
| Recurring G&A | $ | 7,673 | $ | 3,586 | $ | 17,553 | $ | 11,337 | |||||
| Recurring G&A/BOE | $ | 15.83 | $ | 29.81 | $ | 14.98 | $ | 32.86 | |||||
| Adjusted EBITDA Reconciliation | ||||||||||||||||
| Three Months Ended | Nine Months Ended | |||||||||||||||
| September 30, | September 30, | |||||||||||||||
| 2011 | 2010 | 2011 | 2010 | |||||||||||||
| Net income (loss) from continuing operations | $ | 2,000 | $ | (4,413 | ) | $ | (19,730 | ) | $ | (14,700 | ) | |||||
| Net interest expense | $ | 2,272 | $ | 982 | $ | 6,988 | $ | 2,675 | ||||||||
| Loss (Gain) on sale of assets | $ | 908 | $ | 0 | $ | (651 | ) | $ | 0 | |||||||
| Depletion, Depreciation & Amortization | $ | 12,485 | $ | 1,786 | $ | 28,829 | $ | 5,888 | ||||||||
| Exploration expense | $ | 403 | $ | 241 | $ | 1,140 | $ | 697 | ||||||||
| Non-Cash Stock Comp. expense | $ | 7,945 | $ | 1,028 | $ | 20,019 | $ | 5,151 | ||||||||
| Non-recurring acquisition and other expense | $ | 1,760 | $ | 20 | $ | 10,377 | $ | 1,415 | ||||||||
| Non-recurring LOE | $ | 316 | $ | 194 | $ | 1,044 | $ | 1,030 | ||||||||
| Income tax benefit | $ | (272 | ) | $ | 0 | $ | (470 | ) | $ | 0 | ||||||
| Unrealized loss (gain) on derivatives | $ | (17,386 | ) | $ | 481 | $ | (17,221 | ) | $ | 1,181 | ||||||
| Total EBITDAX | $ | 10,430 | $ | 319 | $ | 30,326 | $ | 3,338 | ||||||||
About Magnum Hunter Resources Corporation
Magnum Hunter Resources Corporation is an independent oil and gas company engaged in the acquisition, development and production of oil and natural gas, primarily in West Virginia, Kentucky, Ohio, Texas, North Dakota and Saskatchewan, Canada. The Company is presently active in three of the most prolific shale resource plays in the United States, namely the Marcellus Shale, Eagle Ford Shale and Williston Basin/Bakken Shale.
For more information, please view our website at http://www.magnumhunterresources.com
Forward-Looking Statements
The statements and information contained in this press release that are not statements of historical fact, including all estimates and assumptions contained herein, are "forward looking statements" as defined in Section 27A of the Securities Act of 1933, as amended, and Section 21E of the Securities Exchange Act of 1934, as amended. These forward looking statements include, among others, statements, estimates and assumptions relating to our business and growth strategies, our oil and gas reserve estimates, our ability to successfully and economically explore for and develop oil and gas resources, our exploration and development prospects, future inventories, projects and programs, expectations relating to availability and costs of drilling rigs and field services, anticipated trends in our business or industry, our future results of operations, our liquidity and ability to finance our exploration and development activities, market conditions in the oil and gas industry and the impact of environmental and other governmental regulation. Forward-looking statements generally can be identified by the use of forward-looking terminology such as "may", "will", "could", "should", "expect", "intend", "estimate", "anticipate", "believe", "project", "pursue", "plan" or "continue" or the negative thereof or variations thereon or similar terminology. These forward-looking statements are subject to numerous assumptions, risks, and uncertainties. Factors that may cause our actual results, performance, or achievements to be materially different from those anticipated in forward-looking statements include, among other, the following: adverse economic conditions in the United States and globally; difficult and adverse conditions in the domestic and global capital and credit markets; changes in domestic and global demand for oil and natural gas; volatility in the prices we receive for our oil and natural gas; the effects of government regulation, permitting, and other legal requirements; future developments with respect to the quality of our properties, including, among other things, the existence of reserves in economic quantities; uncertainties about the estimates of our oil and natural gas reserves; our ability to increase our production and oil and natural gas income through exploration and development; our ability to successfully apply horizontal drilling techniques and tertiary recovery methods; the number of well locations to be drilled, the cost to drill, and the time frame within which they will be drilled; drilling and operating risks; the availability of equipment, such as drilling rigs and transportation pipelines; changes in our drilling plans and related budgets; and the adequacy of our capital resources and liquidity including, but not limited to, access to additional borrowing capacity. Because forward-looking statements are subject to risks and uncertainties, actual results may differ materially from those expressed or implied by such statements. Readers are cautioned not to place undue reliance on forward-looking statements, contained herein, which speak only as of the date of this document. Other unknown or unpredictable factors may cause actual results to differ materially from those projected by the forward-looking statements. Unless otherwise required by law, we undertake no obligation to publicly update or revise any forward-looking statements, including estimates, whether as a result of new information, future events, or otherwise. We urge readers to review and consider disclosures we make in our public filings made from time to time with the Securities and Exchange Commission that discuss factors germane to our business, including our Annual Report on Form 10-K, as amended, for the year ended December 31, 2010 and our Quarterly Reports on Form 10-Q for the quarters ended March 31, 2011, June 30, 2011, and September 30, 2011. All forward-looking statements attributable to us are expressly qualified in their entirety by these cautionary statements.
The U.S. Securities and Exchange Commission ("SEC") requires oil and natural gas companies, in filings made with the SEC, to disclose proved reserves, which are those quantities of oil and natural gas that by analysis of geoscience and engineering data can be estimated with reasonable certainty to be economically producible from a given date forward, from known reservoirs, and under existing economic conditions, operating methods, and government regulations. References to reserves in this press release have been determined in accordance with the SEC guidelines ("U.S. Rules") and not in accordance with Canadian National Instrument 51-101 - Standards of Disclosure for Oil and Gas Activities ("NI 51-101"). The practice of preparing production and reserve quantities data under NI 51-101 differs from the U.S. Rules. The primary differences between the two reporting requirements include: (i) NI 51-101 requires disclosure of proved and probable reserves; the U.S. Rules require disclosure of only proved reserves; (ii) NI 51-101 requires the use of forecast prices in the estimation of reserves; the U.S. Rules require the use of 12-month average prices which are held constant; (iii) NI 51-101 requires disclosure of reserves on a gross (before royalties) and net (after royalties) basis; the U.S Rules require disclosure on a net (after royalties) basis; (iv) the Canadian standards require disclosure of production on a gross (before royalties) basis; the U.S. Rules require disclosure on a net (after royalties) basis; and (v) NI 51-101 requires that reserves and other data be reported on a more granular product type basis than required by the U.S. Rules.
Contact Information:
Magnum Hunter Contact:
M. Bradley Davis
Senior Vice President of Capital Markets
bdavis@magnumhunterresources.com
(832) 203-4545