TORONTO, ONTARIO--(Marketwired - March 21, 2014) - North American Palladium Ltd. ("NAP" or the "Company") (TSX:PDL)(NYSE MKT:PAL) is pleased to provide an update on its mineral reserve and resource estimates and life of mine plan for its Lac des Iles mine property in northwestern Ontario. An update of current 2014 operations and production at LDI is also provided.
"We are pleased with the overall increase in contained palladium ounces in our reserves and resources and the improved economics of our updated life of mine plan for LDI," said Phil du Toit, President and CEO. "Our operations are performing well year to date and the fundamentals for the palladium market remain favorable. As we continue through 2014 we will focus on continued operational improvements, lowering unit costs and further diamond drilling to potentially convert our large mineral resource to reserves."
Due to the material increase in reserves and resources, the Company is required by regulatory legislation to file a revised NI 43-101 technical report and intends to do so on or before March 31, 2014.
Highlights:
- Palladium production and operating costs in January and February were ahead of guidance with positive variances in both months.
- Total reserves and resources of 5.2 million ounces of contained Pd is an increase of 24% above the January 2013 technical report.
- Of the total reserve, underground reserve accounts for 9.2 million tonnes at a diluted grade of 3.9 g/t Pd. Total reserve is 15.0 million tonnes at a grade of 2.8 grams per tonne ("g/t") palladium ("Pd") which now includes salvage mining in the open pit and a portion of the low grade stockpile on surface.
- Total reserves increased by 140,000 of contained Pd to 1.3 million ounces. This is an increase of 12% compared to the previous technical report.
- Total resources increased by 860,000 ounces of contained Pd to a total of 3.9 million ounces. This is an increase of 28% compared to the previous technical report.
- Utilizing only proven and probable reserves, the current Life of Mine ("LOM") increases by one year to 2019 with annual production peaking over 200,000 payable ounces and a total mined reserve of 1.1 million payable Pd ounces, an increase of approximately 34% from the 2013 technical report. This plan does not include the potential shaft extension to access the lower Offset zone. Management will focus on advancing work to potentially extend the LOM through the future successful conversion of resources into reserves.
- A life of mine plan has been completed as part of an updated pre-feasibility study ("PFS") report that is expected to be filed on SEDAR on or before March 31, 2014.
- Addition of large tonnage footwall zone resources in both the Roby and Offset Zone deposits.
- The base case net present value ("NPV") at a 5% discount rate is $173 million (using three year average pricing of US$700 per ounce Pd and a CDN$0.95 foreign exchange rate). Current price scenario using US$770 Pd and CDN$0.90 foreign exchange rate results in an NPV (5%) of $299 million an increase of $161 million from the previous NPV in the January 2013 technical report.
- Cash costs of the base case averages US$440 per ounce of payable Pd.
- Additional exploration funds are expected to be allocated in 2014 to conduct conversion and extension drilling below the 1000 metre level in the lower part of the Offset Zone in support of a potential shaft expansion and future LOM extension.
"Mine operations continue to perform well with several large stopes in the production cycle and significant broken ore inventory underground. Tonnage mined is as per plan and grade has been above guidance year to date due partly to some strategic stope sequencing decisions made late last year," said Jim Gallagher, Chief Operating Officer. "Performance at the concentrator has been above guidance with recoveries in the first two months averaging 84.5%, reflecting positive results from the process improvements implemented in December 2013. We have also taken short-term measures to improve throughput of the ore handling system feeding the shaft and are on track to complete permanent solutions in the second half of 2014, which are expected to allow us to achieve higher production rates at lower unit costs."
Update to Mineral Resources and Mineral Reserves for the Lac des Iles Mine Property
The Company has completed an update to its LDI mineral reserves and resources. The effective date for the new reserve and resource estimates, shown in Table 1, is December 31, 2013. The new estimates exclude material mined up until the effective date. The resource estimates provided in Table 1 were prepared by NAP Qualified Persons in accordance with NI 43-101 guidelines. The reserve estimates provided in Table 1 were prepared by qualified persons from Tetra Tech, also in accordance with NI 43-101 guidelines. A detailed discussion of the resource and reserve estimates presented in Table 1 will be contained in a NI 43-101 technical report containing an updated pre-feasibility study for the Lac des Iles mine. This report is expected to be filed on SEDAR on or before March 31, 2014. The following discussion provides summary information for the new resource and reserve estimates for LDI with reference to Table 1. Table 2 provides a comparison of tonnage, Pd grade and contained Pd for selected zones and reserve/resource categories between the previous published reserve and resource estimates (see Technical Report entitled "Technical Report Lac des Iles Mine, Ontario, Incorporating Prefeasibility Study Offset Zone Phase I" dated January 31, 2013 and filed on SEDAR February 19, 2013) and the current, updated estimates.
Mineral Resources
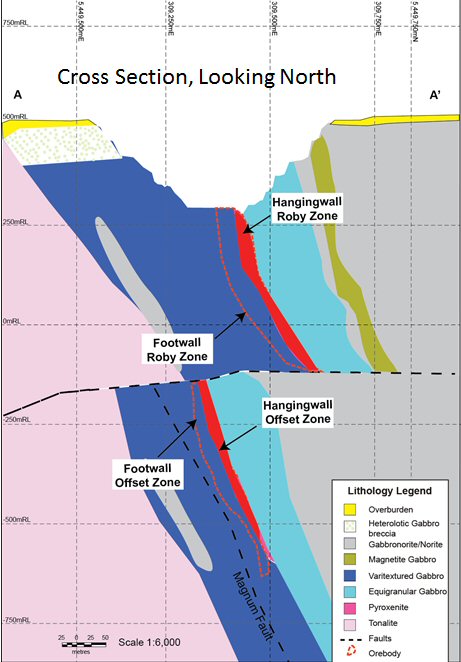
The updated mineral resource estimates presented in Table 1 represent a change to the previous, published mineral resources for the LDI mine property (the "Property"). The known mineralized zones on the Property are shown in Figure 1. For the first time the Company is reporting separate hangingwall and footwall zones for the Offset and Roby zone deposits (Figure 2). This change in reporting structure was motivated by the need to better align resource estimates to the geology of these deposits, current and potential, future mining methods and observed Pd grade distribution patterns. The resources reported in Table 1 include the first estimates of footwall zone resources for both the Roby and Offset zone deposits. The former Cowboy and Outlaw zones are now included in the Offset footwall zone. The Offset and Roby hangingwall zones are characterized by higher average grades than their respective, underlying footwall zones. The hangingwall zones are typically hosted by a sheared melanorite unit (also referred to as the 'pyroxenite unit"). The footwall zones are typically hosted by a more massive varitextured gabbro unit (Figure 2).
In addition to the reporting of separate hangingwall and footwall zones, the LDI resources have been subdivided into three major categories: (i) near surface sources; (ii) underground hangingwall zone resources; and (iii) underground footwall zone resources.
The Company believes that separate listing of these three resource categories is a better representation of the distinctive geology, grade distributions and past, present and future mining methods than the previously published estimates for the Property.
The most significant differences between the currently reported resource estimates (Table 1) and the previously published resource estimates (see January 2013 NI 43-101 Technical Report) are highlighted in Table 2. In summary, the major differences between these two mineral resource estimates include:
- Addition of a large footwall zone resource for both the Roby and Offset zone deposits
- Addition of a pit expansion resource principally located in the southern and western part of the Roby Zone deposit and outside of the limits of the current Roby Zone pit shell
- Conversion of Offset Zone resources between the 990 level and 1065 level to reserves
- Conversion of a portion of the low-grade stockpile to reserves
- Reduction in Offset hangingwall zone resources, largely associated with conversion to reserves and re-assignment of formerly combined Offset Zone higher-grade (>2.5 g/t Pd cut-off grade) resources into separate footwall and hangingwall zones
- Reduction in Offset Zone inferred resources based on negative conversion drilling results in 2012 and 2013 primarily in the area immediately south of the current shaft
- Addition of Offset Zone inferred resources from the newly reported Offset footwall zone resource
The net change to the LDI resource inventory in terms of contained Pd is an increase of 858,000 ounces, bringing the total measured and indicated resource to 3.86 million ounces of contained Pd, comprising:
- Near-surface measured and indicated resources of 25.8 million tonnes having a Pd grade of 1.44 g/t (1.2 million ounces of contained Pd)
- Underground hangingwall zone measured and indicated resources of 5.7 million tonnes having a Pd grade of 4.25 g/t (0.8 million ounces of contained Pd)
- Underground footwall zone measured and indicated resources of 26.3 million tonnes having a Pd grade of 2.24 g/t (1.9 million ounces of contained Pd)
Although the overall mineral resource on the Property has increased, internal technical studies will be required to assess the potential for profitable mining of the large footwall zone resources shown in Table 1 by considering a range of bulk underground mining methods. Similarly, the Company intends to investigate incentive prices for the recently added near-surface mineral resources (Table 1) through future pit optimization studies and associated financial modeling.
Mineral Reserves
The updated mineral reserve estimates presented in Table 1 are also divided into the three main categories cited above for the LDI resources. Major changes in the Property reserves compared to the most recent, prior estimate (see NI 43-101 Technical report dated January 31, 2013) include:
- Depletion from mining activities in 2012 and 2013 to previously reported Roby pit and Roby underground reserves (largely mined out)
- Net gain in total proven and probable reserves of 141,000 ounces of contained Pd, largely reflecting the conversion of low-grade surface stockpile resources and despite significant depletion from mining activities in 2013, which resulted in the extraction of 817,000 tonnes of higher-grade underground ore (116,000 ounces of contained Pd) from both the Offset and Roby hangingwall zones
- Addition of a small reserve (pit salvage reserve) from the bottom-west portion of the current Roby pit and containing 1.01 million tonnes having an average grade of 1.33 g/t Pd
- Slight reduction in the average Pd grade for the Offset Zone reserves (hangingwall zone) based on refinements to the life of mine plan (see below) and the addition of new reserves at deeper levels (1065 level)
Underground proven and probable reserves are currently restricted to the Roby and Offset hangingwall zones and total 9.16 million tonnes having an average diluted Pd grade of 3.89 g/t (1.15 million ounces of contained Pd). New reserves for the Roby hangingwall zone incorporate sill pillars and remnant mineralization located at both the northern end of the Roby underground mining developments (Roby 6 Block reserves) and beneath the lowermost development level.
Near surface proven and probable reserves total 5.89 million tonnes with an average grade of 1.03 g/t Pd (0.195 million ounces of contained Pd).
2014 Exploration and Conversion Drilling Plans
The Company plans to continue investing in surface and underground exploration and conversion drilling with the 2014 campaign scheduled to begin at the end of this month. Drilling will initially focus on converting inferred resources to indicated resources in the lower part of the Offset Zone and adding inferred resources in both the upper and lower parts of the Offset Zone to aid in defining the along strike and down dip extent of the deposit to depths ranging from within surface to approximately 1500 m below surface. The scope of the 2014 exploration and conversion drilling program will be determined pursuant to the results of ongoing financing activities.
Update to Life of Mine Plan
An updated Life of Mine Plan has been completed by Tetra Tech with significant contributions from NAP qualified persons. The updated Life of Mine Plan will be included in a technical report that the Company plans to file on SEDAR on or before March 31, 2014. Whereas the 43-101 report issued in January 2013 looked at the lower Offset zone project only, the updated plan looks at all mineable reserves from all sources to form a complete Life of Mine plan. It also includes an updated accounting of all resources at the Lac Des Iles site.
Changes to the Life of Mine Plan include:
- Mining of the Offset zone down to the 1065 level (previously to 990 level only).
- Inclusion of sill pillar recovery and remnant stopes in the upper Roby zone.
- Inclusion of part of the low grade surface stockpile into reserves as a blended feed with the underground ore.
- A final open pit salvage operation at the end of mine life.
This plan does not require significant capital expenditures other than ongoing capital development of the lower Offset zone and ongoing expansion of the tailings management facility.
The underground mine plan continues with large sublevel blast hole open stopes with waste fill as has been the practice to date at LDI. Ore is hauled to the 645 metre level ore handling system and is hoisted via the shaft. Some of the remnant ore from the upper Roby zone will continue to be trucked to surface due to the relatively short haulage distance. The average production rate from underground from all sources is expected to be 5000 tonnes per day. The underground ore will be blended on surface with the low grade stockpile with an expected rate of approximately 12,000 tonnes per day for the two week mill run each month. For this reason the portion of the low grade stockpile that will be mined has now been moved into the reserve category.
A final, low cost salvage of remaining open pit reserves will be taken at the end of mine life to avoid impacting active underground infrastructure.
Opportunities
During the course of the study several high potential opportunities were identified that require either higher metal prices than the base case (US$700/oz Pd), additional resource definition drilling or detailed engineering studies before they could be included in the LOM. These include:
- The extension of the mine to the known depth with a deepened mine shaft. A significant inferred resource has already been identified in the lower Offset zone. Additional diamond drilling is required to expand the total resource and upgrade portions to measured and indicated resources so that PFS level engineering studies can be completed and potentially prove the economic viability of the shaft deepening project. This opportunity has the potential to increase total shaft throughput and extend the life of mine plan ("LOM") by several years. The Company intends to commence definition and conversion drilling in the lower Offset zone later this month.
- Open pit mine life. The currently planned salvage operation in the pit has a life of approximately one year. The new reserve and resource estimate include a pit expansion resource that could potentially be developed near the end of the current mine plan, depending on metals prices and economic factors at that time
- Mining of the Roby and Offset footwall zones. A measured and indicated resource of 26.3 million tonnes at 2.2 g/t Pd (undiluted) exists as the contiguous footwall of the existing Roby and Offset zone deposits. As part of the current mine plan, the necessary mine infrastructure will already be in place to extract this resource. The potential to mine this exists as a relatively low cost operation at end of mine life and with better than base case metal prices. Further evaluation is required.
- Several near surface exploration targets will be assessed as part of the Company's future surface exploration programs.
Economic Analysis
As per 43-101 guidelines the LOM economics were based on the lesser of the three year average pricing or the current spot price. Standard sensitivities were run and will be contained in the report. Current pricing as of March 17, 2014 was also run and is reflected in the table below. Pd price and the exchange rate of the Canadian dollar relative to the US dollar both have a significant impact of the mines cash flow.
| Lac Des Iles LOM Economics | Current Prices (US$770 Pd) |
Study Prices (US$700 Pd) |
||
| Gross Revenue | $ | 1,387 M | $ | 1,220 M |
| Operating Margin | $ | 476 M | $ | 336 M |
| Post Tax Cash Flow | $ | 335 M | $ | 195 M |
| NPV @ 5% | $ | 299 M | $ | 173 M |
| Cash Cost US$/oz | $ | 450 | $ | 441 |
| Foreign Exchange Rate | C$0.90 | C$0.95 | ||
Technical Information and Qualified Persons
The content of this press release has been reviewed and approved by Jim Gallagher, P. Eng., Chief Operating Officer for North American Palladium Ltd. and an employee of the Company, and David C. Peck, P. Geo., Head of Exploration for North American Palladium Ltd. and a consultant to the Company, both of whom are Qualified Persons within the meaning of National Instrument 43-101.
Additional information can be found in NAP's Form 40-F/Annual Information Form on file with the US Securities and Exchange Commission and Canadian provincial securities regulatory authorities, available at www.sec.gov and www.sedar.com, respectively. Mineral resources that are not mineral reserves do not have demonstrated economic viability.
| Conference Call & Webcast Details | |
| Date: | Friday, March 17, 2014 |
| Time: | 10:00 a.m. ET |
| Webcast: | http://www.nap.com/ |
| Live Call: | 1-866-229-4144 or 1-416-216-4169 (PIN: 5550208, followed by # sign) |
| Replay: | 1-888-843-7419 or 1-630-652-3042 (PIN: 5550208, followed by # sign) |
| The conference call replay will be available for 30 days after the live event. An archived audio webcast of the call will also be posted to NAP's website. | |
About North American Palladium
NAP is an established precious metals producer that has been operating its Lac des Iles mine ("LDI") located in Ontario, Canada since 1993. LDI is one of only two primary producers of palladium in the world, offering investors leverage to the rising price of palladium. The Company's shares trade on the NYSE MKT under the symbol PAL and on the TSX under the symbol PDL.
Cautionary Note to US Investors Concerning Estimates of Measured, Indicated and Inferred Resources
This press release uses the terms "Measured", "Indicated" and "Inferred" Resources. United States investors are advised that while such terms are recognized and required by Canadian regulations, the United States Securities and Exchange Commission does not recognize them. "Inferred Mineral Resources" have a great amount of uncertainty as to their existence, and as to their economic and legal feasibility. It cannot be assumed that all or any part of an Inferred Mineral Resource will ever be upgraded to a higher category. Under Canadian rules, estimates of Inferred Mineral Resources may not form the basis of feasibility or other economic studies. United States investors are cautioned not to assume that all or any part of Measured or Indicated Mineral Resources will ever be converted into Mineral Reserves. United States investors are also cautioned not to assume that all or any part of an Inferred Mineral Resource exists, or is economically or legally mineable.
Cautionary Statement on Forward-Looking Information
Certain information included in this news release constitutes 'forward-looking statements' within the meaning of the 'safe harbor' provisions of the United States Private Securities Litigation Reform Act of 1995 and Canadian securities laws. The words 'expect', 'believe', 'will', 'intend', 'estimate', 'forecast', and similar expressions identify forward-looking statements. Such statements include, without limitation, any information as to our future exploration results, financial or operating performance, including: the Company's forward-looking guidance, projected production rates, projected exploration expenditures, timelines, the methods by which ore will be extracted, statements with respect to the exploration potential of the LDI or greenfields properties, projected grades, mill recoveriesand other statements that express management's expectations or estimates of future performance. Forward-looking statements are necessarily based upon a number of factors and assumptions that, while considered reasonable by management, are inherently subject to significant business, economic and competitive uncertainties and contingencies. The factors and assumptions contained in this news release, which may prove to be incorrect, include, but are not limited to: that metal prices will be consistent with the Company's expectations, that the exchange rate between the Canadian dollar and the United States dollar will be consistent with the Company's expectations, that the Company's interpretations of the ore body are accurate, that prices for key mining, exploration, and development supplies, including labour, will remain consistent with the Company's expectations, that the Company's current estimates of mineral reserves and resources are accurate, and that there are no material delays affecting operations or in the timing of ongoing projects.
The forward-looking statements are not guarantees of future performance. The Company cautions the reader that such forward-looking statements involve known and unknown risks that may cause the actual results to be materially different from those expressed or implied by the forward-looking statements. Such risks include, but are not limited to: the possibility that metal prices, foreign exchange rates or operating costs may differ from management's expectations, the possibility that new exploration targets may not meet management's expectations, uncertainty of mineral reserves and resources, inherent risks associated with mining, exploration and development, the risk that the Lac des Iles mine may not perform as planned and that the Offset Zone and other zones may not be successfully developed, and uncertainty of the ability of the Company to obtain financing. For more details on the factors, assumptions and risks see the Company's most recent Form 40-F/Annual Information Form on file with the U.S. Securities and Exchange Commission and Canadian provincial securities regulatory authorities. The Company disclaims any obligation to update or revise any forward-looking statements, whether as a result of new information, events or otherwise, except as expressly required by law. Readers are cautioned not to put undue reliance on these forward-looking statements.
To view "FIGURE 1: Geological map of the Lac des Iles mine block intrusion showing the location of the currently defined mineralized zones on the Lac des Iles mine property," please visit the following link: http://media3.marketwire.com/docs/eps1.jpg.
To view "FIGURE 2: Geological cross section referenced to Section line A-A' shown in Figure 1," please visit the following link: http://media3.marketwire.com/docs/eps2.jpg. The Roby and Offset zone deposits have been subdivided into higher-grade hangingwall zones and lower-grade footwall zones. This subdivision is reflected in the updated reserve and resource estimates and is consistent with current mining methods, geology and Pd grade distributions.
TABLE 1: Mineral reserve and mineral resource estimates for the Lac des Iles mine property effective December 31st, 2013.
| NEAR SURFACE RESERVES | ||||||||
| Category/Source | Pd Cut-Off |
Tonnes | Pd | Pt | Au | Ni | Cu | Pd Contained |
| Proven | (g/t) | (000's) | (g/t) | (g/t) | (g/t) | (%) | (%) | (000's oz) |
| Low-Grade Stockpile (RGO) | 0.95 | 4,876 | 0.97 | 0.12 | 0.08 | 0.06 | 0.03 | 152 |
| Roby Zone Open Pit | 1.09 | 716 | 1.31 | 0.16 | 0.13 | 0.07 | 0.06 | 30 |
| Total Proven | - | 5,592 | 1.01 | 0.13 | 0.09 | 0.06 | 0.03 | 182 |
| Probable | ||||||||
| Roby Zone Open Pit | 1.09 | 293 | 1.39 | 0.18 | 0.15 | 0.08 | 0.07 | 13 |
| Total Reserve | - | 5,885 | 1.03 | 0.13 | 0.09 | 0.06 | 0.04 | 195 |
| NEAR-SURFACE RESOURCES | ||||||||
| Category/Source | Pd Cut-Off |
Tonnes | Pd | Pt | Au | Ni | Cu | Pd Contained |
| Measured | (g/t) | (000's) | (g/t) | (g/t) | (g/t) | (%) | (%) | (000's oz) |
| Low-Grade Stockpile (RGO) | 0.95 | 7,679 | 0.97 | 0.12 | 0.08 | 0.06 | 0.03 | 239 |
| Roby Zone Pit Expansion | 1.00 | 10,476 | 1.60 | 0.21 | 0.12 | 0.07 | 0.05 | 539 |
| Sheriff Zone | 1.50 | 1,725 | 2.06 | 0.21 | 0.11 | 0.06 | 0.07 | 114 |
| North VT Rim | 1.00 | 437 | 2.03 | 0.12 | 0.03 | 0.03 | 0.01 | 28 |
| Total Measured | - | 20,317 | 1.41 | 0.17 | 0.10 | 0.07 | 0.04 | 921 |
| Indicated | ||||||||
| Roby Zone Pit Expansion | 1.00 | 5,393 | 1.53 | 0.21 | 0.11 | 0.07 | 0.05 | 265 |
| Sheriff Zone | 1.50 | 35 | 1.74 | 0.20 | 0.14 | 0.07 | 0.09 | 2 |
| North VT Rim | 1.00 | 14 | 1.75 | 0.12 | 0.03 | 0.03 | 0.01 | 1 |
| Total Indicated | 5,442 | 1.53 | 0.21 | 0.11 | 0.07 | 0.05 | 268 | |
| Total Measured + Indicated | - | 25,759 | 1.44 | 0.18 | 0.10 | 0.07 | 0.04 | 1,189 |
| UNDERGROUND RESERVES - HANGINGWALL ZONES | ||||||||
| Category/Source | Pd Cut-Off |
Tonnes | Pd | Pt | Au | Ni | Cu | Pd Contained |
| Proven | (g/t) | (000's) | (g/t) | (g/t) | (g/t) | (%) | (%) | (000's oz) |
| Offset Hangingwall Zone | 2.60 | 4,499 | 4.06 | 0.28 | 0.28 | 0.11 | 0.08 | 587 |
| Roby Hangingwall Zone | 2.40 | 847 | 3.51 | 0.23 | 0.20 | 0.05 | 0.04 | 96 |
| Total Proven | - | 5,346 | 3.97 | 0.27 | 0.27 | 0.10 | 0.07 | 683 |
| Probable | ||||||||
| Offset Hangingwall Zone | 2.60 | 3,564 | 3.82 | 0.27 | 0.27 | 0.10 | 0.09 | 438 |
| Roby Hangingwall Zone | 2.40 | 251 | 3.17 | 0.22 | 0.18 | 0.05 | 0.04 | 26 |
| Total Probable | 3,815 | 3.78 | 0.27 | 0.26 | 0.10 | 0.09 | 463 | |
| Total Reserve | - | 9,161 | 3.89 | 0.27 | 0.27 | 0.10 | 0.08 | 1,146 |
| UNDERGROUND RESOURCES - HANGINGWALL ZONES | ||||||||
| Category/Source | Pd Cut-Off |
Tonnes | Pd | Pt | Au | Ni | Cu | Pd Contained |
| Measured | (g/t) | (000's) | (g/t) | (g/t) | (g/t) | (%) | (%) | (000's oz) |
| Offset Hangingwall Zone | 2.50 | 2,418 | 4.34 | 0.31 | 0.28 | 0.11 | 0.08 | 337 |
| Indicated | ||||||||
| Offset Hangingwall Zone | 2.50 | 3,234 | 4.19 | 0.30 | 0.29 | 0.12 | 0.10 | 436 |
| Total Measured + Indicated | 2.50 | 5,652 | 4.25 | 0.30 | 0.29 | 0.12 | 0.09 | 773 |
| Inferred | ||||||||
| Offset Hangingwall Zone | 2.50 | 5,942 | 3.75 | 0.23 | 0.23 | 0.10 | 0.09 | |
| UNDERGROUND RESOURCES - FOOTWALL ZONES | ||||||||
| Category/Source | Pd Cut-Off |
Tonnes | Pd | Pt | Au | Ni | Cu | Pd Contained |
| Measured | (g/t) | (000's) | (g/t) | (g/t) | (g/t) | (%) | (%) | (000's oz) |
| Offset Footwall Zone | 1.50 | 11,011 | 2.24 | 0.23 | 0.16 | 0.08 | 0.06 | 793 |
| Roby Footwall Zone | 1.50 | 4,159 | 2.43 | 0.21 | 0.18 | 0.06 | 0.05 | 325 |
| Total Measured | 1.50 | 15,170 | 2.29 | 0.22 | 0.17 | 0.07 | 0.06 | 1,118 |
| Indicated | ||||||||
| Offset Footwall Zone | 1.50 | 8,810 | 2.12 | 0.22 | 0.16 | 0.08 | 0.07 | 600 |
| Roby Footwall Zone | 1.50 | 2,341 | 2.34 | 0.20 | 0.17 | 0.06 | 0.05 | 176 |
| Total Indicated | 1.50 | 11,151 | 2.17 | 0.22 | 0.16 | 0.08 | 0.07 | 777 |
| Total Measured + Indicated | 1.50 | 26,321 | 2.24 | 0.22 | 0.16 | 0.08 | 0.07 | 1,895 |
| Inferred | ||||||||
| Offset Footwall Zone | 1.50 | 9,530 | 2.16 | 0.15 | 0.12 | 0.06 | 0.05 | |
| Roby Footwall Zone | 1.50 | 248 | 2.43 | 0.18 | 0.08 | 0.03 | 0.02 | |
| Total Inferred | 1.50 | 9,778 | 2.17 | 0.15 | 0.12 | 0.06 | 0.06 | |
| COMBINED RESERVES AND RESOURCES - ALL SOURCES | ||||||||
| Category/Source | Tonnes | Pd | Pt | Au | Ni | Cu | Pd Contained |
|
| Sub-Category | (000's) | (g/t) | (g/t) | (g/t) | (%) | (%) | (000's oz) |
|
| Total Proven + Probable | 15,046 | 2.77 | 0.21 | 0.20 | 0.08 | 0.06 | 1,341 | |
| Total Measured + Indicated | 57,732 | 2.08 | 0.21 | 0.15 | 0.08 | 0.06 | 3,857 | |
| Total Inferred | 15,720 | 2.77 | 0.18 | 0.16 | 0.07 | 0.07 | ||
Notes
- Mineral resources which are not mineral reserves do not have demonstrated economic viability. The estimate of mineral resources may be materially affected by environmental, permitting, legal, title, taxation, sociopolitical, marketing, or other relevant issues.
- Palladium ounces are stated as contained ounces. Disclosure of contained ounces is permitted under Canadian regulations; however, the SEC generally permits resources to be reported only as in place tonnage and grade.
- Resources listed in Table 1 are exclusive of reserves. Resources and reserves reflect depletion from mining activities to December 31st, 2013.
- Tonnages are rounded to nearest '000 tonnes. Pd, Pt and Au grades are rounded to nearest .01 g/t. Ni and Cu grades are rounded to nearest .01%. Rounded numbers used to calculate contained Pd (oz) and average resource and reserve tonnage and grades.
- All reserve and resource estimates were prepared in accordance with National Instrument 43-101 - Standards of Disclosure for Mineral Projects (NI 43-101) and the Canadian Institute of Mining, Metallurgy and Petroleum classification system. US investors should refer to the Annual Information Form for an overview on how Canadian Standards differ significantly from US requirements.
- The mineral resource for the Offset hangingwall and footwall zones was estimated as of December 31, 2013 by Denis Decharte P.Eng, an employee of North American Palladium Ltd. (NAP) and a qualified person (QP) under NI 43-101. The mineral resource calculation uses a minimum 2.5 g/t palladium resource block cut-off for the hangingwall zone and a minimum 1.5 g/t palladium resource block cut-off for the footwall zone. The mineral resource estimate is based on the combination of geological modeling, geostatistics and conventional block modelling (5m by 5m by 5m blocks). 1m composite intervals were used with a grade capping at 30 g/t for palladium and 3 g/t for gold. Grade capping was determined not to be necessary for others metals. The Offset Zone resource models used the ordinary kriging (OK) grade interpolation method within a 3DI block model with mineralized zones defined by wireframe solids. The mineral resource is exclusive of mineral reserve and mined-out material as of December 31, 2013.
- The mineral resource for the Roby footwall zone was estimated as of December 31, 2013 by Denis Decharte P.Eng, an employee of North American Palladium Ltd. (NAP) and a qualified person (QP) under NI 43-101. The mineral resource calculation uses a minimum 1.5 g/t palladium resource block cut-off. The mineral resource estimate is based on the combination of geological modeling, geostatistics and conventional block modelling (5m by 5m by 5m blocks). Grade capping was determined not to be necessary, however influence of composite intervals with palladium grade higher than 50 g/t were limited in space. The Roby zone resource models used the ordinary kriging (OK) grade interpolation method within a 3DI block model with mineralized zones defined by wireframe solids. The mineral resource is exclusive of mineral reserve and mined-out material as of December 31, 2013.
- Mineral resource estimates for the near-surface portion of the western part of the North VT Rim zone (west and East-deep zones) at the LDI mine property was prepared by Chris Roney, P.Geo., a Qualified Person and a private consultant to the Company. This resource estimate was based on a 1.0 g/t Pd cut-off grade. The North VT Rim zone mineral resources were estimated from drilling completed to April 15, 2013. The mineral resource uses a minimum 1.0 g/t Pd resource block cut-off. The mineral resource estimate is based on the combination of geological modeling, geostatistics and conventional block modeling (5m x 5m x 5m blocks). The North VT Rim resource models used the inverse distance squared (ID 2) grade interpolation method.
- Mineral resource estimates for the low-grade stockpile (RGO) was prepared by David N. Penna, P.Geo., an employee of Lac des Iles Mines Ltd. and a qualified person within the meaning of NI 43-101.
- As with mineral resources, the estimate of mineral reserves may be materially affected by environmental, permitting, legal, title, taxation, socio-political, marketing, or other relevant issues. The mineral reserves were estimated from geological block models provided by Denis Decharte P.Eng. and from RGO stockpile resource information provided by Dave Penna, P. Eng., employees of North American Palladium (NAP) and qualified persons (QP) under NI 43-101. The geological block models reflect updates that are based upon diamond drilling completed after March 31, 2012 and before December 31st, 2013.
- Mineral resources for the Sheriff Zone are based on estimates originally provided in the Company's September 5, 2013 press release.
- The mineral reserves were estimated by William Richard McBride, P.Eng. of Tetra Tech and Wenchang Ni, P.Eng. of Tetra Tech; with input by Dave Penna, P. Eng., an employee of North American Palladium (NAP) and qualified persons (QP) under NI 43-101 on allocation of indirect mining costs and John Cooney, P. Eng., an employee of North American Palladium (NAP) and qualified persons (QP) under NI 43-101 on the use of the Lac Des Isle Mine 2014 budget for unit cost determinations; and with additional input by Cam McKinnon, P.Eng. of Tetra Tech on recoveries; and Philip Bridson, P.Eng. of Tetra Tech on metal prices and exchange rate, independent QPs within the meaning of NI 43-101.
- Reserves were estimated to the 1065 Mine Level (4,435 metre elevation), a maximum depth of 1,072.5 metres.
- The following metal price assumptions were used for reserves estimation: US$700/oz palladium, US$1,453/oz platinum, US$1,320/oz gold, US$6.47/lb nickel, and US$3.26/lb copper. A CDN$/US$ exchange rate of CDN$1.00 = US$0.95 was also applied.
- An average production rate of 5,272 t/d was used to determine the reserves. The following recoveries were used in the assumptions to determine the reserves: 86.3% palladium, 80.3% platinum, 80.4% gold, 38.8% nickel, and 88.7% copper. The effective date of NAP's LDI Mine resource models for the Offset Zone and for the Roby Zone, as prepared by NAP's Denis Decharte P.Eng., is December 31, 2013 and as a result of "mining depletion" the user of this reserve information should ensure that this is based upon the most recent resource estimate for the property.
- It should also be noted that the mineral reserve estimate for the Offset Zone as provided in 2013 as part of the technical report labeled "Technical Report Lac des Iles Mine, Ontario, Incorporating Prefeasibility Study Offset Zone Phase I, effective January 31, 2013" reflected a different mining method with a different set of economic circumstances that thereby lead to that January 2013 reserve estimate in that prior report to be non-applicable to the unconsolidated fill mining method demonstrated as being viable by this prefeasibility study work. It should be further noted that "mining depletion" during 2013 is not accounted for in the reserves, as in place underground mining developments were removed from the resource model prepared by NAP's Denis Decharte P.Eng., and thereby from the reserve numbers; and a 0% mining recovery was applied to known mined-out stopes. The projected top down, long-hole with unconsolidated fill mining method, its potential production profile and the plans referred to in this prefeasibility study are preliminary in nature and additional technical studies will need to be completed in order to prove out their viability. There is no certainty that this mining method will be realized or that the production capabilities as represented will be realized. A mine production decision that is made without a feasibility study carries additional potential risks which include but are not limited to the lack of details pertaining to geotechnical and ventilation field study inputs for mine design, ore handling upgrades and their impact on mining schedules, metallurgical flow sheets and process plant designs that in themselves may require additional economic analysis and internal studies to ensure satisfactory operational conditions and decisions regarding future targeted production. Numbers may not add due to rounding.
Table 2. Comparison Between 2012 and 2014 Near-Surface and Underground Reserve and Resource Estimates for the Lac des Iles Mine Property.
| Near-Surface Reserves and Resources | 2012 | 2014 | Change - Contained Pd | ||||||||
| Tonnes | Pd | Pd | Tonnes | Pd | Pd | Pd | Pd (oz) | ||||
| Source/Zone | Category | (000's) | (g/t) | (000's oz) | (000's) | (g/t) | (000's oz) | (000's oz) | % difference | ||
| Low-Grade Stockpile (RGO) | P&P Reserve | - | - | - | 4,876 | 0.97 | 152 | 152 | n/a | ||
| Low-Grade Stockpile (RGO) | M&IND Resource | 13,188 | 0.97 | 411 | 7,679 | 0.97 | 239 | -172 | -42% | ||
| Roby Zone Open Pit | P&P Reserve | 722 | 1.99 | 46 | 1,009 | 1.33 | 43 | -3 | -6% | ||
| Roby Zone Open Pit | M&IND Resource | 4,536 | 2.11 | 308 | 15,869 | 1.58 | 804 | 496 | 161% | ||
| Sheriff Zone | M&IND Resource | - | - | - | 1,760 | 2.05 | 116 | 116 | n/a | ||
| North VT Rim | M&IND Resource | - | - | - | 451 | 2.02 | 29 | 29 | n/a | ||
| Total Near-Surface Reserves | 2P Reserve | 722 | 1.99 | 46 | 5,885 | 1.03 | 195 | 149 | 325% | ||
| Total Near-Surface Resources | M&IND Resource | 17,724 | 1.26 | 719 | 25,759 | 1.44 | 1,189 | 470 | 65% | ||
| Underground Reserves and Resources | 2012 | 2014 | Change - Contained Pd | ||||||||
| Tonnes | Pd | Pd | Tonnes | Pd | Pd | Pd | Pd (oz) | ||||
| Source/Zone | Category | (000's) | (g/t) | (000's oz) | (000's) | (g/t) | (000's oz) | (000's oz) | % difference | ||
| Roby Zone - Hangingwall | P&P Reserve | 420 | 6.38 | 86 | 1,098 | 3.43 | 121 | 35 | 41% | ||
| Roby Zone - Hangingwall | M&IND Resource | 1,269 | 7.16 | 292 | - | - | - | -292 | -100% | ||
| Roby Zone - Footwall | M&IND Resource | - | - | - | 6,500 | 2.40 | 501 | 501 | n/a | ||
| Offset Zone - Hangingwall | P&P Reserve | 7,741 | 4.29 | 1,068 | 8,063 | 3.95 | 1,025 | -43 | -4% | ||
| Offset Zone - Hangingwall | M&IND Resource | 14,499 | 4.26 | 1,987 | 5,652 | 4.25 | 773 | -1,214 | -61% | ||
| Offset Zone - Footwall | M&IND Resource | - | - | - | 19,821 | 2.19 | 1,393 | 1,393 | n/a | ||
| Total Underground Reserves | P&P | 8,161 | 4.40 | 1,154 | 9,161 | 3.89 | 1,146 | -8 | -1% | ||
| Total U/ground Resources | M&IND | 15,768 | 4.50 | 2,280 | 31,973 | 2.60 | 2,668 | 388 | 17% | ||
| Total Inferred Resources | Inferred | 13,669 | 3.59 | - | 15,720 | 2.77 | - | - | - | ||
Contact Information:
John Vincic
Investor Relations Advisor
416-360-7374
jvincic@nap.com
www.nap.com