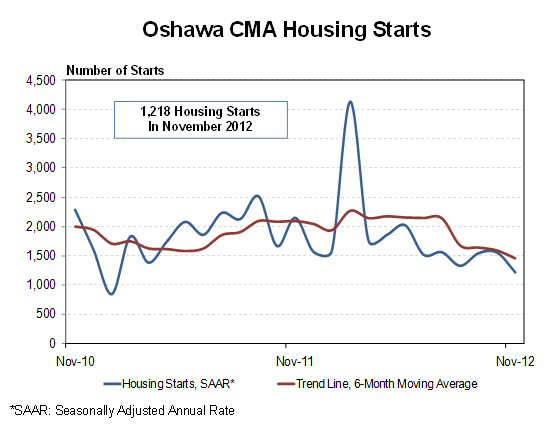
TORONTO, ONTARIO--(Marketwire - Dec. 10, 2012) - Housing starts in Oshawa Census Metropolitan Area (CMA) were trending at 1,453 units in November, according to Canada Mortgage and Housing Corporation (CMHC). The trend is a six month moving average of the monthly seasonally adjusted annual rates (SAAR) 1 of housing starts. The standalone monthly SAAR was 1,218 units in November, down from 1,556 in October.
"New home construction activity in Oshawa has been losing speed over the past months. A reduced supply of new low-rise homes available for sale, particularly in Whitby and Oshawa City, has been one of the key factors," said Inna Breidburg, CMHC's Market Analyst for Oshawa CMA.
CMHC uses the trend measure as a complement to the monthly SAAR of housing starts to account for considerable swings in monthly estimates and obtain a more complete picture of the state of the housing market. In some situations, analysing only SAAR data can be misleading in some markets, as they are largely driven by the multiples segment of the markets which can be quite variable from one month to the next.
Due to a slowdown in the single-detached segment, total November starts in Oshawa CMA were down by more than 50 per cent compared to the same period last year. Thanks to stronger new home construction activity earlier this year, year-to-date starts totalled 1,671 units, only four per cent lower than in 2011. The highest number of housing starts in the CMA this year was recorded in Clarington.
Preliminary Housing Starts data is also available in English and French at the following link:
Preliminary Housing Starts Tables
As Canada's national housing agency, CMHC draws on more than 65 years of experience to help Canadians access a variety of quality, environmentally sustainable and affordable housing solutions. CMHC also provides reliable, impartial and up-to-date housing market reports, analysis and knowledge to support and assist consumers and the housing industry in making informed decisions.
[1] All starts figures in this release, other than actual starts and the trend estimate, are seasonally adjusted annual rates (SAAR) - that is, monthly figures adjusted to remove normal seasonal variation and multiplied by 12 to reflect annual levels. By removing seasonal ups and downs, seasonal adjustment allows for a comparison from one season to the next and from one month to the next. Reporting monthly figures at annual rates indicates the annual level of starts that would be obtained if the monthly pace was maintained for 12 months. This facilitates comparison of the current pace of activity to annual forecasts as well as to historical annual levels.
Additional data is available upon request.
(Ce document existe également en français)
A graph is available at the following address: http://media3.marketwire.com/docs/e1210cmhc_oshawa.jpg
| Preliminary Housing Start Data | ||||
| November / 2011-2012 | ||||
| Oshawa, CMA1 | 2011 | 2012 | ||
| Actual | ||||
| November - Single-Detached | 210 | 88 | ||
| November - Multiples | 22 | 32 | ||
| November -Total | 232 | 120 | ||
| January to November - Single-Detached | 1,297 | 1,059 | ||
| January to November - Multiples | 445 | 612 | ||
| January to November -Total | 1,742 | 1,671 | ||
| October 2012 | November 2012 | |||
| SAAR2 | ||||
| Total | 1,556 | 1,218 | ||
| Source: CMHC | ||||
| 1 Census Metropolitan Area | ||||
| 2 Seasonally Adjusted at Annual Rates | ||||
| Detailed data available upon request. | ||||
| Durham Region Preliminary Actual Housing Start Data by Type | ||||||||||
| November / 2011-2012 | ||||||||||
| Single | Semi | Row | Apt | Total | ||||||
| 2011 | 2012 | 2011 | 2012 | 2011 | 2012 | 2011 | 2012 | 2011 | 2012 | |
| Whitby | 79 | 29 | 0 | 2 | 10 | 0 | 0 | 0 | 89 | 31 |
| Oshawa City | 47 | 38 | 0 | 0 | 0 | 0 | 12 | 9 | 59 | 47 |
| Clarington | 84 | 21 | 0 | 8 | 0 | 13 | 0 | 0 | 84 | 42 |
| Total Oshawa CMA1 | 210 | 88 | 0 | 10 | 10 | 13 | 12 | 9 | 232 | 120 |
| Pickering | 152 | 6 | 0 | 0 | 0 | 0 | 0 | 0 | 152 | 6 |
| Ajax | 43 | 26 | 10 | 0 | 0 | 16 | 0 | 0 | 53 | 42 |
| Uxbridge | 4 | 1 | 0 | 0 | 0 | 0 | 0 | 0 | 4 | 1 |
| Brock | 1 | 0 | 0 | 0 | 0 | 0 | 0 | 0 | 1 | 0 |
| Scugog | 1 | 2 | 0 | 0 | 0 | 0 | 0 | 0 | 1 | 2 |
| Total Durham Region Starts | 411 | 123 | 10 | 10 | 10 | 29 | 12 | 9 | 443 | 171 |
| Durham Region Preliminary Actual Housing Start Data by Type | ||||||||||
| Year to Date / 2011-2012 | ||||||||||
| Single | Semi | Row | Apt | Total | ||||||
| 2011 | 2012 | 2011 | 2012 | 2011 | 2012 | 2011 | 2012 | 2011 | 2012 | |
| Whitby | 474 | 268 | 0 | 2 | 159 | 133 | 0 | 211 | 633 | 614 |
| Oshawa City | 321 | 260 | 40 | 26 | 77 | 57 | 44 | 9 | 482 | 352 |
| Clarington | 502 | 531 | 0 | 14 | 125 | 78 | 0 | 82 | 627 | 705 |
| Total Oshawa CMA1 | 1,297 | 1,059 | 40 | 42 | 361 | 268 | 44 | 302 | 1,742 | 1,671 |
| Pickering | 277 | 247 | 0 | 0 | 76 | 46 | 235 | 0 | 588 | 293 |
| Ajax | 345 | 310 | 88 | 42 | 249 | 200 | 0 | 0 | 682 | 552 |
| Uxbridge | 48 | 41 | 0 | 0 | 0 | 0 | 0 | 0 | 48 | 41 |
| Brock | 16 | 8 | 0 | 0 | 0 | 0 | 0 | 0 | 16 | 8 |
| Scugog | 16 | 17 | 0 | 0 | 0 | 0 | 0 | 0 | 16 | 17 |
| Total Durham Region Starts | 1,999 | 1,682 | 128 | 84 | 686 | 514 | 279 | 302 | 3,092 | 2,582 |
| 1Census Metropolitan Area | ||||||||||
Contact Information:
Market Analysis Contact:
Shaun Hildebrand
416 218-3466
shildebr@cmhc.ca
CMHC
Media Contact:
Beth Bailey
416 218-3355
bbailey@cmhc.ca