GREENWICH, CT--(Marketwire - Aug 6, 2012) - Oxford Lane Capital Corp. ("Oxford Lane" or "Company") (
Oxford Lane issued 2,508,270 shares in connection with its rights offering in April 2012, bringing the total shares outstanding to 5,002,289 as of June 30, 2012. The Company also announced that its net asset value per share as of June 30, 2012 was $14.60.
The Company does not anticipate at this time that any portion of the second quarter dividend will constitute a tax return of capital. As previously discussed in the Company's annual report, it should also be noted that, while the Company's net investment income under generally accepted accounting principles is expected to be lower than taxable income, the Company's dividend distributions are based upon taxable income, as is required for a regulated investment company.
The Company's quarterly report on Form N-Q is on file with the Securities and Exchange Commission. Attached is the Company's schedule of investments as of June 30, 2012. Following the Company's schedule of investments is its presentation of certain financial information of the investment portfolio.
About Oxford Lane Capital Corp.
Oxford Lane Capital Corp. is a publicly-traded registered closed-end management investment company. It seeks to achieve its investment objective of maximizing total return by investing primarily in senior secured loans made to companies whose debt is unrated or is rated below investment grade, with an emphasis on current income. Those investments may take a variety of forms, including the direct purchases of such loans (either in the primary or secondary markets) or through investments in entities that in turn own a pool of such loans.
Forward-Looking Statements
This press release contains forward-looking statements subject to the inherent uncertainties in predicting future results and conditions. Any statements that are not statements of historical fact (including statements containing the words "believes," "plans," "anticipates," "expects," "estimates" and similar expressions) should also be considered to be forward-looking statements. Certain factors could cause actual results and conditions to differ materially from those projected in these forward-looking statements. These factors are identified from time to time in our filings with the Securities and Exchange Commission. We undertake no obligation to update such statements to reflect subsequent events.
| OXFORD LANE CAPITAL CORP. | |||||||||||||||
| SCHEDULE OF INVESTMENTS | |||||||||||||||
| JUNE 30, 2012 | |||||||||||||||
| (unaudited) | |||||||||||||||
| COMPANY(1) | INDUSTRY | INVESTMENT | PRINCIPAL AMOUNT | COST | FAIR VALUE(2) | % of Net Assets | |||||||||
| Collateralized Loan Obligation - Debt Investments | |||||||||||||||
| ACA CLO 2007-1A, Limited | structured finance | CLO secured notes - Class E(3)(4)(5) | $ | 5,090,786 | $ | 3,628,181 | $ | 3,306,465 | |||||||
| (5.22%, due June 15, 2022) | |||||||||||||||
| Bridgeport CLO II | structured finance | CLO secured notes - Class D(3)(4)(5) | 3,391,502 | 2,444,382 | 2,222,112 | ||||||||||
| (4.72%, due June 18, 2021) | |||||||||||||||
| Canaras Summit CLO 2007-1A | structured finance | CLO secured notes - Class E(3)(4)(5) | 750,000 | 518,595 | 511,500 | ||||||||||
| (4.82%, due June 19, 2021) | |||||||||||||||
| Cent CDO 15 | structured finance | CLO secured notes - Class D(3)(4)(5) | 1,625,000 | 1,247,172 | 1,157,325 | ||||||||||
| (4.62%, due March 11, 2021) | |||||||||||||||
| CIFC Funding 2006-1X | structured finance | CLO secured notes - Class B2L(3)(4)(5) | 5,730,501 | 4,149,320 | 3,795,884 | ||||||||||
| (4.47%, due October 20, 2020) | |||||||||||||||
| Colts 2007-1X | structured finance | CLO secured notes - Class E(3)(4)(5) | 3,000,000 | 1,943,199 | 1,950,000 | ||||||||||
| (4.12%, due March 20, 2021) | |||||||||||||||
| Emporia III, Ltd. 2007-3A | structured finance | CLO secured notes - Class E(3)(4)(5) | 3,594,000 | 2,791,459 | 2,316,692 | ||||||||||
| (4.17%, due April 23, 2021) | |||||||||||||||
| GSC VIII | structured finance | CLO secured notes - Class D(3)(4)(5) | 2,112,137 | 1,370,752 | 1,203,918 | ||||||||||
| (3.87%, due April 18, 2021) | |||||||||||||||
| Hewett's Island CLO III | structured finance | CLO secured notes - Class D(3)(4)(5) | 3,499,927 | 2,824,180 | 2,891,290 | ||||||||||
| (6.22%, due August 09, 2017) | |||||||||||||||
| Hewett's Island CLO IV | structured finance | CLO secured notes - Class E(3)(4)(5) | 1,500,000 | 1,321,357 | 1,127,100 | ||||||||||
| (5.02%, due May 09, 2018) | |||||||||||||||
| Kingsland V, Ltd. 2007-5X | structured finance | CLO secured notes - Class E(3)(4)(5) | 4,000,000 | 2,852,382 | 2,459,600 | ||||||||||
| (4.72%, due July 14, 2021) | |||||||||||||||
| Mountain Capital CLO IV, Ltd 2005-4X | structured finance | CLO secured notes - Class B2L(3)(4)(5) | 4,230,373 | 3,111,063 | 3,203,661 | ||||||||||
| (5.22%, due March 15, 2018) | |||||||||||||||
| PPM Grayhawk CLO 2007 | structured finance | CLO secured notes - Class D(3)(4)(5) | 1,869,138 | 1,404,734 | 1,161,482 | ||||||||||
| (4.07%, due April 18, 2021) | |||||||||||||||
| Sargas CLO I Ltd | structured finance | CLO secured notes - Class D(3)(4)(5) | 4,500,000 | 3,232,050 | 2,984,850 | ||||||||||
| (4.47%, due August 27, 2020) | |||||||||||||||
| Waterfront CLO 2007 | structured finance | CLO secured notes - Class D(3)(4)(5) | 7,500,000 | 5,649,976 | 5,450,250 | ||||||||||
| (5.22%, due August 02, 2020) | |||||||||||||||
| Total Collateralized Loan Obligation - Debt Investments | $ | 38,488,802 | $ | 35,742,129 | 48.93% | ||||||||||
| (Continued on next page) | |||||||||||||||
| OXFORD LANE CAPITAL CORP. | ||||||||||||||
| SCHEDULE OF INVESTMENTS - (continued) | ||||||||||||||
| JUNE 30, 2012 | ||||||||||||||
| (unaudited) | ||||||||||||||
| COMPANY(1) | INDUSTRY | INVESTMENT | PRINCIPAL AMOUNT | COST | FAIR VALUE(2) | % of Net Assets | ||||||||
| Collateralized Loan Obligation - Equity Investments | ||||||||||||||
| ACA CLO 2007-1A | structured finance | CLO subordinated notes(4)(6) | 12,212,500 | 9,832,754 | 10,258,500 | |||||||||
| (Estimated yield 15.50%, maturity June 15, 2022) | ||||||||||||||
| Canaras Summit CLO 2007-1X | structured finance | CLO income notes(4)(6) | 1,500,000 | 989,442 | 1,350,000 | |||||||||
| (Estimated yield 22.95%, maturity June 19, 2021) | ||||||||||||||
| Carlyle Global Market Strategies CLO 2011-1X | structured finance | CLO subordinated notes(4)(6) | 6,000,000 | 5,467,589 | 5,340,000 | |||||||||
| (Estimated yield 15.30%, maturity August 10, 2021) | ||||||||||||||
| Gale Force 4 CLO 2007-4A | structured finance | CLO income notes(4)(6) | 1,500,000 | 882,616 | 1,125,000 | |||||||||
| (Estimated yield 16.30%, maturity August 20, 2021) | ||||||||||||||
| Harbourview CLO 2006-1 | structured finance | CLO subordinated notes(4)(6) | 4,380,000 | 2,591,461 | 3,635,400 | |||||||||
| (Estimated yield 22.30%, maturity December 27, 2019) | ||||||||||||||
| Hillmark Funding Ltd. 2006-1A | structured finance | CLO subordinated notes(4)(6) | 2,000,000 | 1,338,605 | 1,680,000 | |||||||||
| (Estimated yield 18.90%, maturity May 21, 2021) | ||||||||||||||
| Jersey Street CLO 2007-1A | structured finance | CLO income notes(4)(6) | 3,185,000 | 2,128,188 | 2,388,750 | |||||||||
| (Estimated yield 20.00%, maturity October 20, 2018) | ||||||||||||||
| Kingsland IV, Ltd. 2007-4A | structured finance | CLO subordinated notes(4)(6) | 2,350,000 | 1,800,630 | 2,303,000 | |||||||||
| (Estimated yield 16.70%, maturity April 16, 2021) | ||||||||||||||
| Lightpoint CLO VII, Ltd. 2007-7X | structured finance | CLO subordinated notes(4)(6) | 2,000,000 | 1,194,830 | 1,650,000 | |||||||||
| (Estimated yield 22.38%, maturity May 15, 2021) | ||||||||||||||
| Octagon XI CLO 2007-1A | structured finance | CLO income notes(4)(6) | 2,025,000 | 1,511,691 | 1,873,125 | |||||||||
| (Estimated yield 19.76%, maturity August 25, 2021) | ||||||||||||||
| Rampart CLO 2007-1A | structured finance | CLO subordinated notes(4)(6) | 1,500,000 | 1,098,778 | 1,260,000 | |||||||||
| (Estimated yield 15.30%, maturity October 25, 2021) | ||||||||||||||
| Total Collateralized Loan Obligation - Equity Investments | $ | 28,836,584 | $ | 32,863,775 | 44.99% | |||||||||
| Total Investments | $ | 67,325,386 | $ | 68,605,904 | 93.92% | |||||||||
| Other Assets in Excess of Liabilities | 4,437,892 | |||||||||||||
| Net Assets (equivalent to $14.60 per share based on 5,002,289 shares of common stock outstanding) | $ | 73,043,796 | ||||||||||||
| (1) We do not "control" and are not an "affiliate" of any of our portfolio companies, each as defined in the Investment Company Act of 1940 (the "1940 Act"). In general, under the 1940 Act, we would be presumed to "control" a portfolio company if we owned 25% or more of its voting securities and would be an "affiliate" of a portfolio company if we owned 5% or more of its voting securities. |
| (2) Fair value is determined in good faith by the Board of Directors of the Company. |
| (3) Notes bear interest at variable rates. |
| (4) Cost value reflects accretion of original issue discount or market discount, and amortization of premium. |
| (5) The CLO secured notes generally bear interest at a rate determined by reference to LIBOR which resets quarterly. For each CLO debt investment, the rate provided is as of June 30, 2012. |
| (6) The CLO subordinated notes and income notes are considered equity positions in the CLO funds. Equity investments are entitled to recurring distributions which are generally equal to the remaining cash flow of the payments made by the underlying fund's securities less contractual payments to debt holders and fund expenses. The estimated yield indicated is based upon a current projection of the amount and timing of these recurring distributions and the estimated amount of repayment of principal upon termination. Such projections are periodically reviewed and adjusted, and the estimated yield may not ultimately be realized. |
Oxford Lane is providing below certain financial information about the Company's investment portfolio as of June 30, 2012. On that date, the Company held 26 investments in Collateralized Loan Obligation ("CLO") vehicles, consisting of 15 junior debt investments and 11 equity investments (presented in the table below with the percentage of each CLO investment shown as a percentage of the Company's Net Asset Value - "NAV").
| Investment | S&P / Moody's Original Ratings | S&P / Moody's Current Ratings* | Stated Maturity | Manager | NAV %** |
| ACA CLO 2007-1 - Sub Notes | NR/NR | NR/NR | 6/15/2022 | Apidos Capital Management | 14.0% |
| Waterfront CLO 2007 - Class D Notes | BB/Ba2 | BB/Ba3 | 8/2/2020 | Grandview Capital Management | 7.5% |
| Carlyle GMS CLO 2011-1 - Sub Notes | NR/NR | NR/NR | 8/10/2021 | Carlyle Investment Management | 7.3% |
| CIFC Funding 2006-1X Class B2L Notes | BB/Ba2 | BB/Ba3 | 10/20/2020 | Commercial Industrial Finance Corp. | 5.2% |
| Harbourview CLO 2006-1 Sub Notes | NR/NR | NR/NR | 12/27/2019 | Harbourview Asset Management | 5.0% |
| ACA CLO 2007-1 - Class E Notes | BB/Ba2 | B+/B1 | 6/15/2022 | Apidos Capital Management | 4.5% |
| Mountain Capital 2005-4X Class B2L Notes | BB/Ba2 | BB+/Ba3 | 3/15/2018 | Mountain Capital Advisors | 4.4% |
| Sargas CLO I Ltd - Class D Notes | BB/Ba2 | BB/Ba2 | 8/27/2020 | Sargas Asset Management | 4.1% |
| Hewett Island CLO III - Class D Notes | BB/Ba2 | CCC- /B2 | 8/9/2017 | CypressTree Investment Management | 4.0% |
| Kingsland V, Ltd. 2007-5X Class E Notes | BB/Ba2 | B/Ba3 | 7/14/2021 | Kingsland Capital Management | 3.4% |
| Jersey Street CLO Income Notes | NR/NR | NR/NR | 10/20/2018 | MFS Investment Management | 3.3% |
| Emporia III, Ltd. 2007-3A Class E Notes | BB/Ba2 | B+/B1 | 4/23/2021 | Emporia Capital Management | 3.2% |
| Kingsland IV, Ltd. 2007-4A Sub Notes | NR/NR | NR/NR | 4/16/2021 | Kingsland Capital Management | 3.2% |
| Bridgeport CLO II - Class D Notes | BB/Ba2 | BB/Ba3 | 6/18/2021 | Deerfield Capital Management | 3.0% |
| Colts 2007-1 - Class E Notes | BB/Ba2 | B+/Ba2 | 3/20/2021 | Structured Asset Investors | 2.7% |
| Octagon XI CLO 2007-1A Income Notes | NR/NR | NR/NR | 8/25/2021 | Octagon Credit Investors | 2.6% |
| Hillmark Funding Ltd. 2006-1A Sub Notes | NR/NR | NR/NR | 5/21/2021 | HillMark Capital Management | 2.3% |
| Lightpoint CLO VII, Ltd. 2007-7X Sub Notes | NR/NR | NR/NR | 5/15/2021 | LightPoint Capital Management | 2.3% |
| Canaras Summit CLO 2007-1 - Income Notes | NR/NR | NR/NR | 6/19/2021 | Canaras Management | 1.8% |
| Rampart CLO 2007-1A Sub Notes | NR/NR | NR/NR | 10/25/2021 | Stone Tower Debt Advisors | 1.7% |
| GSC VIII - Class D Notes | BB/Ba2 | B+/B1 | 4/17/2021 | Black Diamond Capital Management | 1.6% |
| PPM Grayhawk CLO 2007 - Class D Notes | BB/Ba2 | CCC+/Ba3 | 4/18/2021 | PPM America | 1.6% |
| Cent CDO 15 - Class D Notes | BB/Ba2 | BB/Ba3 | 3/11/2021 | RiverSource Investments | 1.6% |
| Hewett's Island CLO IV - Class E Notes | BB/Ba2 | CCC+/Ba3 | 5/9/2018 | LCM Asset Management | 1.5% |
| Gale Force 4 CLO 2007-4A Income Notes | NR/NR | NR/NR | 8/20/2021 | GSO/Blackstone Debt Funds Management | 1.5% |
| Canaras Summit CLO 2007-1 - Class E Notes | BB/Ba2 | B+/Ba3 | 6/19/2021 | Canaras Management | 0.7% |
| Cash | 5.2% | ||||
| Source: Bloomberg L.P. ("Bloomberg"), Standard & Poor's Ratings Services ("S&P"), and Moody's Investors Service, Inc. ("Moody's") |
| NR - Not Rated. |
| * Ratings are current as of August 1, 2012 |
| ** NAV% adds up to less than 100% due to other assets on the balance sheet. |
Investment Composition
The investments held by the CLO vehicles were primarily in companies domiciled in the United States (approximately 94%1). The top 10 aggregate industry exposures of the CLO vehicles accounted for approximately 57%1 of combined investments while the top 10 aggregate single obligor investments accounted for approximately 4%1 (please refer to the following two tables). This results in a weighted average diversity score of 68(2) for our portfolio (which we believe is broadly comparable to industry diversity scores for other similar CLO vehicles).
| Top Ten Industry Exposures*3 | Ten Largest U.S. Debt Securities3 | |||
| Healthcare, Education & Childcare | 11.5% | Univision Communications Inc - TL | 0.63% | |
| Broadcasting and Entertainment | 8.4% | Asurion LLC - TL | 0.42% | |
| Diversified/Conglomerate Services | 5.5% | HCA - TL B3 | 0.36% | |
| Telecommunications | 5.2% | Cequel Communications - TL | 0.34% | |
| Chemicals, Plastics & Rubber | 5.0% | Charter Communications - TL C | 0.34% | |
| Retail Stores | 4.6% | Onex Carestream Finance LP - TL | 0.32% | |
| Electronics | 4.5% | Del Monte Foods Company - TL | 0.30% | |
| Finance | 4.5% | KAR Auction Services - TL | 0.30% | |
| Automobile | 3.9% | Harland Clarke Holdings - TL | 0.30% | |
| Personal, Food & Misc. Services | 3.5% | Transdigm Inc - TL | 0.29% | |
| Total | 56.7% | Total | 3.60% | |
| Source: Intex | Source: Intex | |||
| * Reflects industry classifications established by Moody's. | ||||
CLO Compliance
As of June 30, 2012, each of the CLO vehicles was in material compliance with all of its respective collateral and coverage tests that were necessary for full payments to be made to the Company by each CLO vehicle.4 The current weighted average over-collateralization ("OC") cushion for the Company's CLO equity and debt investments was approximately 2.4% and 5.5%, respectively, as of June 30, 2012 (compared to 2.0% and 4.5%, respectively as of March 31, 2012). As long as each CLO vehicle maintains a positive OC cushion with respect to the OC test associated with that CLO investment, a full payment is expected to be made to the Company.5
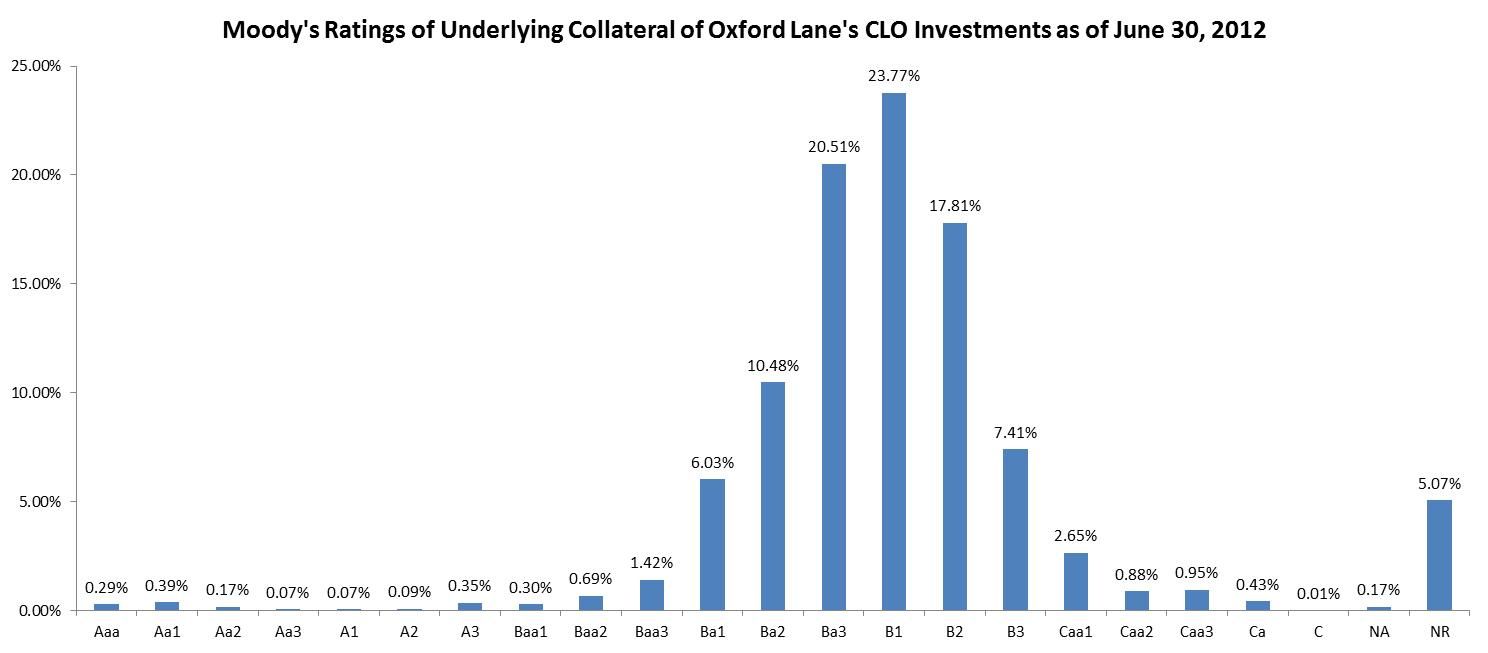
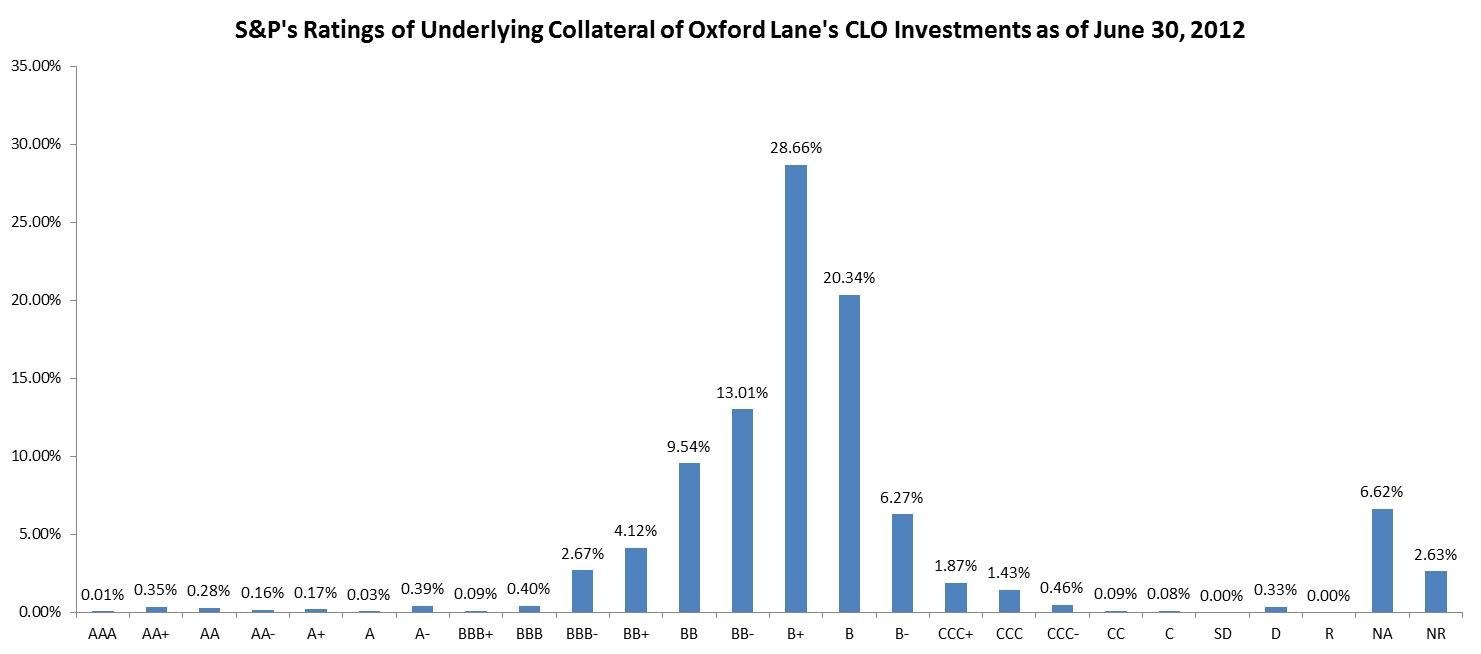
CLO Credit Quality
The current weighted average percentage of defaulted securities held by the CLOs (as reported by each CLO) was approximately 1.0% as of June 30, 2012 (compared to 1.0% as of March 31, 2012). The CLO vehicles which the Company has invested in have a weighted average WARF score (Weighted Average Rating Factor) of 2509 (compared to 2503 as of March 31, 2012) which is equivalent to a Moody's credit rating of between B1 and B2 (see ratings charts on the next page), based on a ratings factor scale provided by Moody's. We believe the weighted average WARF score of our portfolio is broadly comparable to industry WARF scores for other similar CLO vehicles.
Note: Ratings charts above are based on the amount of CLO vehicles' underlying assets on a weighted average basis, without regard to the amount of the Company's investments in these CLO vehicles.
Company Profitability
The Company received or was entitled to receive cash interest payments of $598,897 and equity distributions of $2,715,747 from its junior debt and equity tranche investments, respectively, for the quarter ending June 30, 2012. These payments represented a quarterly cash return of approximately 1.7% and 8.3% of the junior debt and equity tranche investments at market value (as of June 30, 2012), respectively, and on a combined basis, represented a quarterly cash return of approximately 4.8% of the Company's total portfolio at market value (as of June 30, 2012). For the quarter ending June 30, 2012 the Company received a full payment from each CLO vehicle (see table below).
| % NAV | |
| Distributions paid by the CLOs for the 3-months ending 6/30/12 | 100.0% |
| Distributions diverted for 3-months ending 6/30/12 | 0.0% |
The approximate weighted average WAS (Weighted Average Spread above LIBOR) for the CLO vehicles in which the Company has an equity investment was 3.8% and the approximate weighted averaged WACC (Weighted Average Cost of Capital above LIBOR) was 0.7% resulting in approximately a 3.1% margin (before CLO vehicle expenses) as of June 30, 2012 (compared to a weighted average WAS and WACC of 3.6% and 0.5%, respectively, as of March 31, 2012). The weighted average reinvestment end date for the Company's equity positions was 6/2/14 (with a final legal weighted average maturity date of 6/3/21) which potentially allows on a weighted average basis for 2 more years of full equity distribution payments followed by up to 7 years of decreasing distribution payments to the Company, subject to CLO covenant compliance. During the quarter ending June 30, 2012, the Company received a weighted average cash distribution payment on its equity portfolio of approximately 7.0% (of par) with a price markdown of approximately 0.64% (of par) from the prior quarter-end valuations (see table below).
| Equity Investments | Stated Maturity | Payments in Q1 as a % of par |
Price Change from 3/31/12 Mark or Purchase Price |
| ACA CLO 2007-1 - Sub Notes | 6/15/2022 | 8.4% | -2.75 |
| Canaras Summit CLO 2007-1 - Income Notes | 6/19/2021 | 10.6% | -5.00 |
| Carlyle GMS CLO 2011-1 - Sub Notes6 | 8/10/2021 | 0.0% | 0.00 |
| Gale Force 4 CLO 2007-4A Income Notes | 8/20/2021 | 7.2% | -7.00 |
| Harbourview CLO 2006-1 Sub Notes | 12/27/2019 | 7.7% | 4.00 |
| Hillmark Funding Ltd. 2006-1A Sub Notes | 5/21/2021 | 8.3% | 11.00 |
| Jersey Street CLO Income Notes | 10/20/2018 | 7.7% | -2.00 |
| Kingsland IV, Ltd. 2007-4A Sub Notes | 4/16/2021 | 6.3% | 3.00 |
| Lightpoint CLO VII, Ltd. 2007-7X Sub Notes | 5/15/2021 | 8.8% | 1.00 |
| Octagon XI CLO 2007-1A Income Notes | 8/25/2021 | 9.8% | -7.50 |
| Rampart CLO 2007-1A Sub Notes | 10/25/2021 | 9.7% | 0.00 |
| Weighted Average | 6/3/2021 | 7.0% | -0.64 |
| Source: Bloomberg | |||
Disclaimer
This document has been prepared by Oxford Lane Capital Corp. and is the sole responsibility of the Company. No liability whatsoever (whether in negligence or otherwise) arising directly or indirectly from the use of this document is accepted and no representation, warranty or undertaking, express or implied, is or will be made by the Company or any of their respective directors, officers, employees, advisers, representatives or other agents ("Agents") for any information or any of the opinions contained herein or for any errors, omissions or misstatements. The Company has relied on certain information provided from Intex, Bloomberg, S&P and Moody's but makes no representation with respect to the accuracy of such information provided by Intex, Bloomberg, S&P or Moody's. Neither the Company nor any of its respective Agents makes or has been authorized to make any representation or warranties (express or implied) in relation to the Company or as to the truth, accuracy or completeness of this document, or any other written or oral statement provided. In particular, no representation or warranty is given as to the achievement or reasonableness of, and no reliance should be placed on any projections, targets, estimates or forecasts contained in this document and nothing in this document is or should be relied on as a promise or representation as to the future.
1 These percentages are based on the amount of CLO vehicles' underlying assets on a weighted average basis, without regard to the amount of the Company's investments in these CLO vehicles.
2 Source: Intex Solutions, Inc. ("Intex").
3 These percentages for each of the respective tables above are calculated by taking the aggregate amount invested in the industries or debt securities and dividing by the aggregate amount of all of the CLO vehicles' underlying assets (excluding cash), without regard to the amount of the Company's investments in each of these CLO vehicles.
4 The CLO vehicles' indentures have a variety of covenant tests which those CLO vehicles may not be in compliance with in the future should credit markets deteriorate, the loans held by the CLO vehicles fail to make expected payments or otherwise not perform, or for a variety of other reasons. If those covenants are violated, it could result in principal paydowns of the CLO vehicles' higher-rated notes and/or interest diversion which may result in partial or non-payment of the quarterly amounts otherwise due to the Company.
5 Although we expect each of our current CLO equity and debt investments to maintain a positive OC cushion through maturity, there can be no assurance that such OC cushions will not be reduced to zero (or the CLO vehicle will not be in violation of the OC tests), either as a result of a deterioration in general economic conditions or other factors specific to the industries or specific companies in which such CLOs have invested. If that were to occur, our ability to receive payments on such CLO investments could be impaired, and we may lose a portion or all of our investment in such CLOs.
6 Given the timing of the Company's purchase of this investment, the first equity payment is not due until the quarter ending September 30, 2012.
Contact Information:
Contact:
Bruce Rubin
203-983-5280