BOSTON, MA--(Marketwired - Nov 7, 2017) - Private equity (PE) and venture capital (VC) managers in developed markets outside the US returned 4.2% in first quarter of 2017, while PE and VC managers in emerging markets posted 4.0% returns in the same quarter, according to benchmarks of the alternative asset classes published by global investment firm Cambridge Associates.
The Cambridge Associates LLC Global ex US Developed Markets PE/VC Index underperformed comparable public market indexes in Q1 2017. The MSCI EAFE index, which measures public equity performance in developed markets outside the US, returned 7.2% for the quarter, 300 basis points (bps) higher than the Cambridge Associates benchmark.
"Distributions to private equity and venture capital investors in developed markets outside the US in the first quarter of 2017 outpaced capital calls by over 2.5 times," says Andrea Auerbach, Head of Global Private Investments at Cambridge Associates.
The Cambridge Associates LLC Emerging Markets PE/VC Index also produced lower returns than the comparable public market index, the MSCI Emerging Markets Index, which returned 11.5% in Q1 2017, over 700 bps higher than private investment managers in the region. Over longer timeframes, both private investment benchmarks outperformed the public indexes. (See table below.)
"Private investment managers in emerging markets underperformed comparable public markets in Q1 of 2017, but over longer time periods, emerging market private equity and venture capital have far outperformed public markets in the region," says Vish Ramaswami, Managing Director at Cambridge Associates.
Cambridge Associates derives its Global ex US PE/VC Indexes from the financial information contained in its proprietary database of 873 PE and VC funds in developed markets outside the US and 629 PE and VC funds in emerging markets, with a combined value of roughly $435 billion.
Table 1. Returns for the Global ex US Developed and Emerging Markets PE/VC Indexes vs Public Counterparts
Periods Ending March 31, 2017 • Percent (%)
| Qtr | 1 Yr | 3 Yr | 5 Yr | 10 Yr | 15 Yr | 20 Yr | 25 Yr | ||||||||||
| CA Global ex US Dev Mkts PE/VC (US$) | 4.2 | 11.1 | 6.9 | 10.0 | 7.2 | 13.7 | 13.2 | 13.2 | |||||||||
| CA Global ex US Dev Mkts PE/VC (EUR) | 2.8 | 18.5 | 17.3 | 14.8 | 9.7 | 13.0 | 13.5 | 13.6 | |||||||||
| MSCI EAFE (US$) mPME | 7.2 | 11.5 | 0.0 | 6.1 | 2.3 | 5.0 | 4.4 | 4.5 | |||||||||
| MSCI EAFE (EUR) mPME | 5.8 | 18.8 | 9.5 | 10.8 | 5.1 | 6.0 | 5.7 | 5.8 | |||||||||
| S&P 500 (US$) mPME | 6.1 | 17.0 | 10.1 | 13.6 | 8.9 | 8.9 | 8.5 | 8.8 | |||||||||
| CA Emerging Markets PE/VC (US$) | 4.0 | 8.6 | 9.7 | 9.9 | 10.0 | 10.7 | 9.2 | 9.2 | |||||||||
| MSCI Emerging Markets* (US$) mPME | 11.5 | 17.8 | 2.0 | 1.5 | 3.0 | 6.5 | 5.6 | 5.7 | |||||||||
| S&P 500 (US$) mPME | 6.1 | 17.2 | 10.4 | 13.4 | 9.7 | 9.3 | 8.8 | 9.1 | |||||||||
| MSCI EAFE (US$) AACR | 7.2 | 11.7 | 0.5 | 5.8 | 1.1 | 5.7 | 4.6 | 5.8 | |||||||||
| MSCI EAFE (EUR) AACR | 5.8 | 19.0 | 9.4 | 10.6 | 3.3 | 4.3 | 5.1 | 6.6 | |||||||||
| MSCI Emerging Markets* (US$) AACR | 11.5 | 17.7 | 1.5 | 1.2 | 3.0 | 9.9 | 5.9 | 6.7 | |||||||||
| S&P 500 (US$) AACR | 6.1 | 17.2 | 10.4 | 13.3 | 7.5 | 7.1 | 7.9 | 9.5 | |||||||||
Sources: Cambridge Associates LLC, MSCI Inc., Standard & Poor's, and Thomson Reuters Datastream. MSCI data provided "as is" without any express or implied warranties.
Notes: The PE/VC indexes are pooled horizon internal rates of return and are based on limited partners' fund-level performance; the returns are net of fees, expenses, and carried interest. Because the indexes are capital weighted, performance is mainly driven by the largest vintage years. Public index returns are shown as both time-weighted returns (average annual compound returns) and dollar-weighted returns (modified public market equivalent). The Cambridge Associates mPME replicates private investment performance under public market conditions. The public index's shares are purchases and sold according to the private fund cash flow schedule, with distributions calculated in the same proportion as the private fund, and mPME net asset value is a function of mPME cash flows and public index returns.
*Returns for the MSCI Emerging Markets Index began 1/1/1988; to match the 1986 inception of the Emerging Markets PE/VC Index, price returns from Global Financial Data are used for the period 1/1/1986 to 12/31/1987.
A few highlights from the Global ex US Developed Markets PE/VC Index in Q1 2017:
- Contributions to and Distributions from PE/VC Investors in non-US Developed Markets Were Above Average in Q1 2017. Managers in the ex US Developed Markets Index called $5.4 billion from investors in the first quarter of the year, and distributed $14.3 billion to investors. Both contributions and distributions were above average.
- PE- and VC-Backed Companies in non-US Developed Markets Based in the Netherlands Generated Strongest Returns in Q1 2017. Dutch companies in the ex US Developed Markets Index returned 6.8% in Q1 2017. Companies based in Sweden returned 2.5%, lower than the other countries in the index.
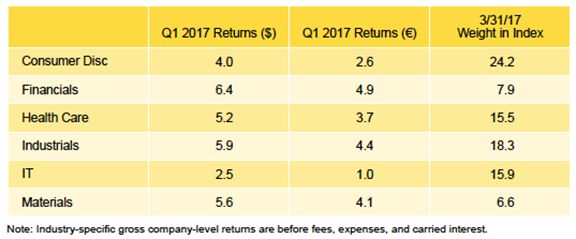
- Financial Companies Generated Strongest Returns in non-US Developed Market PE/VC in Q1 2017. Among the key sectors in the ex US Developed Markets Index, financials companies earned the highest return (6.4%) in Q1 2017, while IT companies generated the lowest (2.5%). Industrials and consumer discretionary companies attracted the most capital during the quarter, together collecting 45.0% of the capital invested during Q1 2017.
- Non-US Developed Market PE/VC Funds Raised in 2014 Were Strongest Performers in Q1 2017. During the first quarter of Q1, funds in the ex US Developed Markets Index raised in 2014 returned 7.9%, higher than the other vintage years in the index.
Some highlights from the Emerging Markets PE/VC Index in Q1 2016:
- Distributions to and Contributions from Investors in Emerging Markets Index Were Lower in Q1 2017 than Q4 2016. During the first quarter of Q1, managers in the Emerging Markets PE/VC Index called $5.9 billion from investors and distributed $4.4 billion, decreases of 16.0% and 24.0%, respectively.
- Companies Based in China and India Continued to Represent Over Half of Emerging Markets Index in Q1 2017. Chinese and Indian firms, which account for 53.5% of the Emerging Markets PE/VC Index, returned 4.1% and 8.5%, respectively, in Q1 2017.
- Financial Firms Were Top Performers in Emerging Markets Index in Q1 2017. Of the key sectors in the Emerging Markets PE/VC Index, financial firms generated the strongest returns in Q1 2017 (8.3%). Health care firms generated the weakest return: 2.8%.
- Emerging Markets PE/VC Funds Raised in 2010 Generated Strongest Returns in Q1 2017. In Q1 2017, funds in the Emerging Markets PE/VC Index raised in 2010 generated a 6.5% return, higher than any other vintage year that represented at least 5% of the index. Funds raised in 2012 generated the lowest return (1.4%).
For additional details on the performance of the Cambridge Associates global private equity and venture capital benchmarks in the first quarter of 2017, please contact Eric Mosher of Sommerfield Communications at +1 (212) 255-8386 or eric@sommerfield.com, or visit https://www.cambridgeassociates.com/benchmark/global-ex-us-pevc-benchmark-commentary-first-quarter-2017/
About the Indexes
Cambridge Associates derives its Global ex US Developed Markets Private Equity and Venture Capital Index from the financial information contained in its proprietary database of global ex US private equity and venture capital funds. As of March 31, 2017, the database comprised 873 global ex US developed markets private equity and venture capital funds formed from 1986 to 2017, with a value of about $251 billion. Ten years ago, as of March 31, 2007, the benchmark index included 491 global ex US developed markets funds, whose value was roughly $144 billion. The funds in this index invest primarily in developed markets in Australia, Canada, Israel, Japan, New Zealand, Singapore and Western Europe.
Cambridge Associates derives its Emerging Markets Private Equity and Venture Capital Index from the financial information contained in its proprietary database of global ex US private equity and venture capital funds. As of March 31, 2017, the database comprised 629 emerging markets funds formed from 1986 to 2016, with a value of about $184 billion. Ten years ago, as of March 31, 2007, the benchmark index included 296 emerging markets funds, whose value was over $30 billion. The funds in this index invest primarily in Africa, emerging Asia, emerging Europe, Latin America & Caribbean, and the Middle East ex Israel.
The pooled returns represent the net periodic rates of return calculated on the aggregate of all cash flows and market values as reported to Cambridge Associates by the funds' general partners in their quarterly and annual audited financial reports. These returns are net of management fees, expenses and performance fees that take the form of carried interest.
About Cambridge Associates
Cambridge Associates is a global investment firm founded in 1973 that builds customized investment portfolios for institutional investors and private clients around the world. Working alongside its early clients, among them several leading universities, the firm pioneered the strategy of high equity orientation and broad diversification, which since the 1980s has been a primary driver of performance for these leading fiduciary investors. Cambridge Associates serves over 1,100 global investors -- primarily foundations and endowments, pensions and family offices -- and delivers a range of services, including outsourced investment (OCIO) solutions; investment consulting services; and access to investment research and tools across global asset classes. With every client, the firm aims to generate outperformance so they can maximize their impact on the world.
Cambridge Associates has more than 1,200 employees serving its client base globally. The firm maintains offices in Arlington, VA; New York; Boston; Dallas; Menlo Park and San Francisco, CA; Toronto; London, UK; Singapore; Sydney; and Beijing. Cambridge Associates consists of five global investment consulting affiliates that are all under common ownership and control. For more information about Cambridge Associates, please visit www.cambridgeassociates.com.
The information presented is not intended to be investment advice. Any references to specific investments are for illustrative purposes only. The information herein does not constitute a personal recommendation or take into account the particular investment objectives, financial situations, or needs of individual clients. This research is not an offer to sell or the solicitation of an offer to buy any security in any jurisdiction. Some of the data contained herein or on which the research is based is current public information that CA considers reliable, but CA does not represent it as accurate or complete, and it should not be relied on as such. Nothing contained in this report should be construed as the provision of tax or legal advice. Past performance is not indicative of future performance. Broad-based securities indexes are unmanaged and are not subject to fees and expenses typically associated with managed accounts or investment funds. Investments cannot be made directly in an index. Any information or opinions provided in this report are as of the date of the report, and CA is under no obligation to update the information or communicate that any updates have been made. Information contained herein may have been provided by third parties, including investment firms providing information on returns and assets under management, and may not have been independently verified.
Contact Information:
Contact
Eric Mosher
Sommerfield Communications
+1 (212) 255-8386
eric@sommerfield.com