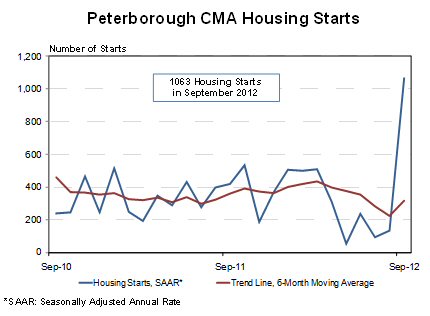
TORONTO, ONTARIO--(Marketwire - Oct. 9, 2012) - Housing starts in Peterborough Census Metropolitan Area (CMA) were trending at 316 units in September, according to Canada Mortgage and Housing Corporation (CMHC). The trend is a six month moving average of the monthly seasonally adjusted annual rates (SAAR)(1) of housing starts. The standalone monthly SAAR was 1063 units in September, up from 134 in August.
"Overall housing starts had been trending down over the past two quarters prior to an irregular month for apartment starts in September. Apartment starts tend to be uneven in smaller markets, with no starts in most months and a significant number concentrated in one month. While most of the 65 apartment starts occurred in Peterborough City, there were also apartment starts in Otonabee-South Monaghan for the first time. Consistent with the demographic and economic trends in Peterborough CMA there is greater demand for lower maintenance, high density housing," said Anthony Passarelli, CMHC's Market Analyst for Peterborough.
CMHC uses the trend measure as a complement to the monthly SAAR of housing starts to account for considerable swings in monthly estimates and obtain a more complete picture of the state of the housing market. In some situations, analysing only SAAR data can be misleading in some markets, as they are largely driven by the multiples segment of the markets which can be quite variable from one month to the next. The multiples segment includes apartments, rows and semi-detached homes.
Single-detached starts added 21 actual units in September 2012. Multiple starts totalled 65 actual units in September, up from 16 units reported in September of last year. Year to date total starts have reached 216 actual units with activity more evenly split between both singles and multiple starts than in 2011. Overall, across the sub-markets in the CMA, total starts this year were lower than they were last year.
Preliminary Housing Starts data is also available in English and French at the following link: Preliminary Housing Starts Tables.
As Canada's national housing agency, CMHC draws on more than 65 years of experience to help Canadians access a variety of quality, environmentally sustainable and affordable housing solutions. CMHC also provides reliable, impartial and up-to-date housing market reports, analysis and knowledge to support and assist consumers and the housing industry in making informed decisions.
| (1) | All starts figures in this release, other than actual starts and the trend estimate, are seasonally adjusted annual rates (SAAR) - that is, monthly figures adjusted to remove normal seasonal variation and multiplied by 12 to reflect annual levels. By removing seasonal ups and downs, seasonal adjustment allows for a comparison from one season to the next and from one month to the next. Reporting monthly figures at annual rates indicates the annual level of starts that would be obtained if the monthly pace was maintained for 12 months. This facilitates comparison of the current pace of activity to annual forecasts as well as to historical annual levels. |
Additional data is available upon request.
(Ce document existe également en français)
To view the graph associated with this release, please visit the following link: http://media3.marketwire.com/docs/cmhc1009ptboge.jpg.
| Preliminary Housing Start Data | ||||
| September / 2011-2012 | ||||
| Peterborough, CMA(1) | September 2011 |
September 2012 |
||
| Actual | ||||
| September - Single-Detached | 15 | 21 | ||
| September - Multiples | 16 | 65 | ||
| September - Total | 31 | 86 | ||
| January to September - Single-Detached | 186 | 119 | ||
| January to September - Multiples | 70 | 97 | ||
| January to September - Total | 256 | 216 | ||
| August 2012 |
September 2012 |
|||
| SAAR(2) | ||||
| Total | 134 | 1063 | ||
| Source: CMHC | |
| (1) | Census Metropolitan Area |
| (2) | Seasonally Adjusted at Annual Rates |
| Detailed data available upon request. | |
| Peterborough Preliminary Actual Housing Start Data by Type | ||||||||||
| Current Month / 2011-2012 | ||||||||||
| Peterborough, CMA(1) | Single | Semi | Row | Apt | Total |
|||||
| 2011 | 2012 | 2011 | 2012 | 2011 | 2012 | 2011 | 2012 | 2011 | 2012 | |
| List of Sub-markets | ||||||||||
| 1 Peterborough City | 11 | 19 | 0 | 0 | 0 | 0 | 16 | 46 | 27 | 65 |
| 2 Cavan-Monaghan TP | 2 | 0 | 0 | 0 | 0 | 0 | 0 | 0 | 2 | 0 |
| 3 Douro-Drummer TP | 0 | 0 | 0 | 0 | 0 | 0 | 0 | 0 | 0 | 0 |
| 4 Otonabee-South Monaghan TP | 2 | 2 | 0 | 0 | 0 | 0 | 0 | 19 | 2 | 21 |
| 5 Smith-Ennismore-Lakefield TP | 0 | 0 | 0 | 0 | 0 | 0 | 0 | 0 | 0 | 0 |
| Total Peterborough Starts | 15 | 21 | 0 | 0 | 0 | 0 | 16 | 65 | 31 | 86 |
| Peterborough Preliminary Actual Housing Start Data by Type | ||||||||||
| Year to Date / 2011-2012 | ||||||||||
| Peterborough, CMA(1) | Single | Semi | Row | Apt | Total |
|||||
| 2011 | 2012 | 2011 | 2012 | 2011 | 2012 | 2011 | 2012 | 2011 | 2012 | |
| List of Sub-markets | ||||||||||
| 1 Peterborough City | 125 | 68 | 2 | 2 | 45 | 26 | 16 | 46 | 188 | 142 |
| 2 Cavan-Monaghan TP | 13 | 10 | 0 | 0 | 0 | 0 | 0 | 0 | 13 | 10 |
| 3 Douro-Drummer TP | 8 | 12 | 0 | 0 | 0 | 0 | 0 | 0 | 8 | 12 |
| 4 Otonabee-South Monaghan TP | 5 | 12 | 0 | 0 | 0 | 0 | 0 | 19 | 5 | 31 |
| 5 Smith-Ennismore-Lakefield TP | 35 | 17 | 0 | 0 | 7 | 4 | 0 | 0 | 42 | 21 |
| Total Peterborough Starts | 186 | 119 | 2 | 2 | 52 | 30 | 16 | 65 | 256 | 216 |
| (1) | Census Metropolitan Area |
Contact Information:
Market Analysis Contact:
Anthony Passarelli
416-250-3234
apassare@cmhc.ca
Media Contact:
Beth Bailey
416-218-3355
bbailey@cmhc.ca