TRUCKEE, CA--(Marketwire - Sep 8, 2011) - Clear Capital (www.clearcapital.com) has released its monthly Home Data Index™ (HDI) Market Report, with news of U.S. home price gains of 4.0 percent comparing the most recent rolling quarter to the previous one. Though quarter-over-quarter gains continue across the nation's four regions, the rate of growth has begun to slow as the summer buying season comes to an end and economic confidence shows signs of weakening.
This month's HDI Market Report provides the most current data available (through August 2011), and includes relevant analysis of how local markets perform compared to trend data at the national level. Clear Capital uses patent pending rolling quarter intervals to compare the most recent four months of home pricing data to the previous three months. Including the most recent month of pricing data in the average provides increased currency and insight into current quarter trends.
Report highlights include:
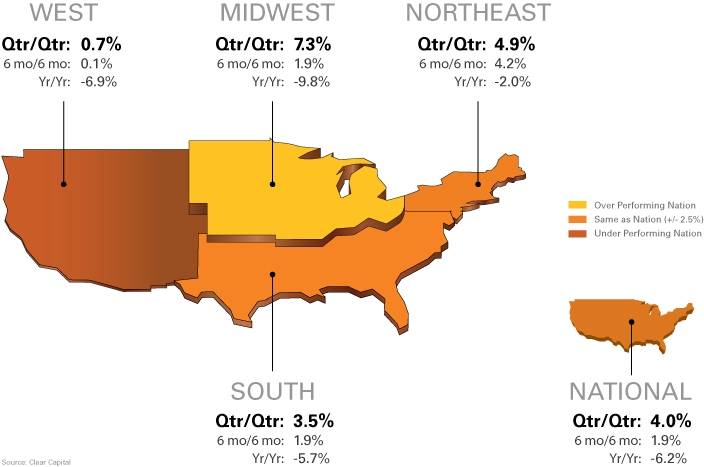
- The Midwest region leads the nation with a seasonal quarterly home price gain of 7.3%, followed by the Northeast at 4.9%, South at 3.5% and West at 0.7%.
- The gains of summer are not recouping the longer-term declines, and national yearly home prices are down -6.2% compared to last year's levels.
- Jacksonville replaces Detroit as the lowest performing major market, posting a -2.7% quarterly price change.
- Low economic confidence (as indicated by recent Gallup polls) and a continued high unemployment rate supports Clear Capital's projection of downward home price movement for the remainder of 2011.
"Although the summer gains appear to signal strong growth in home prices, it's important to keep in mind that these gains are off of the record lows of winter," said Dr. Alex Villacorta, director of research and analytics at Clear Capital. "With summer coming to a close and the price gains clearly starting to level off, the market is at a critical juncture as to whether it can avoid another significant downturn into the slower buying seasons of fall and winter.
"The latest readings on consumer confidence paint an ominous picture that at present, consumers are still not ready to risk jumping into the market despite very low mortgage rates and very affordable home prices," added Villacorta.
Regional Market Overview (Aug. 2010 - Sept. 2011)
| Qtr/Qtr % +/- | 6 mo/6 mo | Yr/Yr | ||||
| West | 0.7% | 0.1% | -6.9% | |||
| Midwest | 7.3% | 1.9% | -9.8% | |||
| Northeast | 4.9% | 4.2% | -2.0% | |||
| South | 3.5% | 1.9% | -5.7% | |||
| National | 4.0% | 1.9% | -6.2% |
Midwest Leads Summer's Uplift in Home Prices
- The Midwest led the nation with a quarterly home price gain of 7.3%.
- Previous momentum is softening in the Northeast and South regions, and the West's quarterly price movement is flat.
- National yearly prices are down -6.2% from 2010.
Quarter-over-quarter price gains continue across the nation's four regions, however, the rate of growth has begun to slow. This softening appears to be the result of pressure from a volatile stock market, high unemployment rates, elevated home sales inventory and slow home sales rates. These factors are signaling a potentially challenging fall and winter housing market.
The Midwest was the only region to increase quarterly price gains -- up 1.0 percentage point over last month's report to 7.3 percent, and was buoyed by solid improvement in Chicago and the Ohio markets in particular. However, the Midwest's noted vulnerability to significant seasonal price swings is likely to limit the duration of this trend. The Northeast and South regions saw quarterly gains soften to 4.9 percent and 3.5 percent respectively, which represents a slowdown of 0.3 and 0.7 percentage points from last month's report. Quarterly price gains in the West region were insignificant, even during the summer buying season, and mirrored last month's gains of 0.7 percent. With economic uncertainty and significant distressed sales activity affecting the West, this small gain may potentially represent peak price growth in the region for the rest of 2011.
With home price data through August, it has become clear the seasonal uplift in prices has most likely reached its peak, and has made up some of the severe losses from last winter. It is important to note however, this growth was moderated by the public's perception of the poor health of the economy, driven by several economic and political events during the season including the jobs outlook and political maneuvering over the U.S. debt ceiling.
Linking Economic Confidence to Home Price Change: A Bleak Outlook
One key indicator of public perception is the Gallup Economic Confidence Index (ECI) -- a survey of consumer opinions on current economic conditions, and if they perceive those conditions to be getting better or worse. The ECI as a measure of public perception of the overall economic health can provide key insight into whether consumers are likely to return to the housing market. ECI scores are positive or negative depending on the level of consumer confidence in a particular state or market -- a positive score means higher confidence; a negative score equates to lower confidence.
Through the first half of 2011, both consumers and the housing market have had little to feel confident about, and the statistically significant correlation between the ECI and the yearly change in home prices reflects this lack of enthusiasm about the current economic environment.
Those areas with higher "economic confidence" as measured by the ECI through June 2011, also tended to see an improvement in yearly real estate prices. For example, Washington, D.C. had an ECI value of 11 for the first half of 2011 (higher than all 50 states) and has a current year-over-year home price growth for the District of 5.8 percent, also one of the highest growth rates across the nation. Conversely Nevada, one of the hardest hit states in the country in terms of home price declines, had an ECI of -35, seventh worst of all states, and a current year-over-year price decline of -11.7 percent according to our HDI index, one of the largest drops across the nation.
For the first half of 2011, the nation's economic confidence as a whole was largely negative, averaging an ECI score of -28. With this pessimism, potential buyers tend to sit on the sidelines, despite record affordability levels in many markets, and are unwilling to make large purchases with long term commitments. Along with this hesitancy, there is a growing sentiment to stay agile to better pursue potential job opportunities, causing some consumers to postpone home purchases. This is shown in a decline of national homeownership rates over the past five years of 2.8 percent, while the rental sector has sustained its demand with a decline in rental vacancy rates of -0.4 over the same period.
Consumer confidence can be seasonally lifted, but the effects tend to fade over time in stagnant economic environments, such as our current condition. With the combination of slowing home price gains, combined with the current ECI reading of -49 nationally (through Sept. 4, 2011), it appears the recent summer price increases are extremely vulnerable, and the signs are that the coming months will be very challenging for home prices. If these indicators aren't enough, the recent announcement by the Bureau of Labor Statistics last week that reported the unemployment rate held steady at a high 9.1 percent, further supports Clear Capital's six month forecast published at the beginning of July, which projected 2.6 percent home price decline nationally by the end of 2011.
15 Highest and Lowest Performing Metro Markets (Aug. 2010 - Sept. 2011)
| Highest Performing Major Markets | ||||||||
| Qtr/Qtr Rank |
Metropolitan Statistical Area | Qtr/Qtr % +/- |
Yr/Yr | REO Saturation | ||||
| 1 | Cleveland, OH - Elyria, OH - Mentor, OH | 19.2% | -5.2% | 33.1% | ||||
| 2 | Chicago, IL - Naperville, IL - Joliet, IL | 13.6% | -6.2% | 29.1% | ||||
| 3 | Milwaukee, WI - Waukesha, WI - West Allis, WI | 13.3% | -13.3% | 22.9% | ||||
| 4 | Hartford, CT - West Hartford, CT - East Hartford, CT | 11.3% | -6.9% | 5.3% | ||||
| 5 | Boston, MA - Cambridge, MA - Quincy, MA | 9.7% | -0.1% | 7.5% | ||||
| 6 | Pittsburgh, PA | 9.5% | 3.9% | 6.3% | ||||
| 7 | Richmond, VA | 9.4% | -8.3% | 15.4% | ||||
| 8 | Cincinnati, OH - Middletown, OH | 9.1% | -7.5% | 20.8% | ||||
| 9 | Atlanta, GA - Sandy Springs, GA - Marietta, GA | 8.5% | -6.0% | 28.9% | ||||
| 10 | Minneapolis, MN - St. Paul, MN - Bloomington, MN | 8.0% | -11.3% | 39.8% | ||||
| 11 | Rochester, NY | 6.6% | 0.9% | 5.9% | ||||
| 12 | Orlando, FL | 6.5% | -1.2% | 39.2% | ||||
| 13 | New Orleans, LA - Metairie, LA - Kenner, LA | 6.3% | -8.0% | 17.0% | ||||
| 14 | Washington, DC - Arlington, VA - Alexandria, VA | 6.0% | 0.8% | 14.2% | ||||
| 15 | Memphis, TN | 5.7% | -4.4% | 33.0% | ||||
Highest Performing Markets: The Midwest Leads the Way
- Cleveland expands quarterly gains to take the top position on shifts in REO market composition.
- REO saturation continues to fall in most of the highest performing MSAs, but remains stubbornly elevated in six.
Cleveland supplants Milwaukee as the market with the largest quarter-over-quarter gains this month. Cleveland's large gains reflect vast differences in this housing market's REO composition between the winter, and the spring/summer home buying seasons. This difference is enhanced in Cleveland because of the high concentration of REO sales among lower-priced homes during the late winter and early spring (the previous rolling quarter). This seasonal variation is influencing today's quarterly price gains in Cleveland, and is not a true picture of overall home price recovery. Further, Cleveland's yearly price decline of 5.2 percent and high REO saturation calls out its susceptibility to ongoing volatility, and questions the viability of a prolonged recovery.
Year-over-year performance of the highest performing markets continues to represent a mixed-bag of market health. Washington, D.C., Rochester and Boston all show relatively flat yearly price change along with more manageable REO saturation levels.
All of our best performing MSAs, with the exception of Rochester, experienced declines in REO saturation rates from last month's report. Contrary to these positive results, nine of these markets maintained prices more than five percent below levels of a year ago, and six markets maintain REO saturation rates above the national rate of 26.3 percent. With quarterly price gains likely to subside into the fall and winter, even our highest performing markets remain susceptible to volatility in the months to come.
| Lowest Performing Major Markets | ||||||||
| Qtr/Qtr Rank |
Metropolitan Statistical Area | Qtr/Qtr % +/- |
Yr/Yr | REO Saturation | ||||
| 1 | Jacksonville, FL | -2.7% | -13.2% | 33.5% | ||||
| 2 | Las Vegas, NV - Paradise, NV | -2.0% | -11.0% | 48.7% | ||||
| 3 | Riverside, CA - San Bernardino, CA - Ontario, CA | -1.7% | -3.7% | 43.2% | ||||
| 4 | Detroit, MI - Warren, MI - Livonia, MI | -1.1% | -17.9% | 51.2% | ||||
| 5 | Los Angeles, CA - Long Beach, CA - Santa Ana, CA | -0.7% | -2.9% | 26.8% | ||||
| 6 | San Diego, CA - Carlsbad, CA - San Marcos, CA | -0.2% | -3.5% | 27.8% | ||||
| 7 | Tucson, AZ | -0.1% | -14.2% | 40.2% | ||||
| 8 | Seattle, WA - Tacoma, WA - Bellevue, WA | 0.1% | -15.8% | 21.9% | ||||
| 9 | Sacramento, CA - Arden, CA - Roseville, CA | 0.3% | -9.8% | 38.2% | ||||
| 10 | Philadelphia, PA - Camden, NJ - Wilmington, DE | 0.4% | -7.6% | 9.6% | ||||
| 11 | San Jose, CA - Sunnyvale, CA - Santa Clara, CA | 1.0% | -4.9% | 16.8% | ||||
| 12 | Fresno, CA | 1.2% | -10.6% | 42.0% | ||||
| 13 | Houston, TX - Baytown, TX - Sugar Land, TX | 1.4% | -5.6% | 33.2% | ||||
| 14 | San Francisco, CA - Oakland, CA - Fremont, CA | 1.5% | -6.7% | 25.4% | ||||
| 15 | Phoenix, AZ - Mesa, AZ - Scottsdale, AZ | 1.8% | -8.3% | 39.1% | ||||
Lowest Performing Markets: The West Fares the Worst
- 11 of the 15 lowest performing major markets reside in the West region.
- Negative quarterly price changes creep up in the lowest performing markets, expanding to seven markets compared to five in last month's report, and all 15 of the markets listed maintain yearly price declines.
- Jacksonville's -2.7% quarterly price decrease displaces Detroit as the lowest performing major market.
The West region largely missed out on seasonal gains experienced by the other regions, and as a result, the majority of the lowest performing major markets reside in the West, from the MSAs in Washington state, down the coast into California and Nevada, and then to the south to MSAs in Arizona. Negative quarterly numbers expanded their presence this month with seven of the 15 markets seeing price declines and all of the lowest performing markets showing yearly declines. REO saturation has been on the decline, but 11 of the bottom 15 markets remain well above the national rate.
After seven months as the lowest performing market on a quarter-over-quarter basis, Detroit was displaced by Jacksonville as the lowest performing major market. However, Detroit still maintains highest REO saturation and year-over-year price declines.
About the Clear Capital Home Data Index (HDI) Market Report
The Clear Capital HDI Market Report provides insights into market trends and other leading indices for the real estate market at the national and local levels. A critical difference in the value of the HDI Market Report is the capability of Clear Capital to provide more timely and granular reporting than other home price index providers.
The Clear Capital HDI Market Report:
- Offers the real estate industry (investors, lenders and servicers), government agencies and the public insight into the most recent pricing conditions, not only at the national and metropolitan level, but within local markets as well.
- Is built on the most recent information available from recorder/assessor offices, and then further enhanced by adding the company's proprietary streaming market data for the most comprehensive geographic coverage and local insights available.
- Reflects nationwide coverage of sales transactions and aggregates this comprehensive dataset at ten different geographic levels, including hundreds of metropolitan statistical areas (MSAs) and sub-ZIP code boundaries.
- Includes equally-weighted distressed bank owned sales (REOs) from around the country to give the most real world look of pricing dynamics across all sales types.
- Allows for the most current market data by providing more frequent updates with patent-pending rolling quarter technology. This ensures decisions are based on the most up-to-date information available.
Clear Capital Home Data Index™ Methodology
- Generates the timeliest indices in patent pending rolling quarter intervals that compare the most recent four months to the previous three months. The rolling quarters can start on any date, so the HDI can generate indices as data flows in, significantly reducing the multi-month lag time experienced with other indices.
- Includes both fair market and institutional (real estate owned) transactions, giving equal weight to all market transactions and identifying price tiers at a market specific level. By giving equal weight to all transactions the HDI is truly representative of each unique market.
- Results from an address-level cascade create an index with the most granular, statistically significant market area available.
- Provides weighted repeat sales, and price-per-square-foot index models that use multiple sale types, including single-family homes, multi-family homes and condominiums.
About Clear Capital
Clear Capital (www.clearcapital.com) is a premium provider of data and solutions for real estate asset valuation and risk assessment for large financial services companies. Our products include appraisals, broker-price opinions, property condition inspections, value reconciliations, and home data indices. Clear Capital's combination of progressive technology, high caliber in-house staff and a well-trained network of more than 40,000 field experts sets a new standard for accurate, up-to-date and well documented valuation data and assessments. The Company's customers include the largest U.S. banks, investment firms and other financial organizations.
Legend
Address Level Cascade -- Provides the most granular market data available. From the subject property, progressively steps out from the smallest market to larger markets until data density and statistical confidence are sufficient to return a market trend.
Gallup Economic Confidence Index (ECI) -- Combines the responses of Gallup's Economic Conditions and Economic Outlook measures. Results are based on telephone interviews with approximately 1,500 national adults. The margin of error is ±3 percentage points. More information about Gallup's Daily Economic Indexes can be found at: http://www.gallup.com/poll/122840/gallup-daily-economic-indexes.aspx.
Home Data Index (HDI) -- Powerful analytics tool that provides contextual data augmenting other, human-based valuation tools. Clear Capital's multi-model approach combines address-level accuracy with the most current proprietary home pricing data available.
Metropolitan Statistical Area (MSA) -- Geographic entities defined by the U.S. Office of Management and Budget (OMB) for use by Federal statistical agencies in collecting, tabulating, and publishing Federal statistics.
Repeat Sales Model -- Weighted linear model based on repeat sales of same property over time.
Price Per Square Foot (PPSF) Model -- Median price movement of sale prices divided by square footage over a period of time--most commonly a quarter.
Real Estate Owned (REO) Saturation -- Calculates the percentage of REOs sold as compared to all properties sold in the last rolling quarter.
Rolling Quarters -- Clear Capital uses patent pending rolling quarter intervals to compare the most recent four months of home pricing data to the previous three months. We include the most current fourth month of pricing data, because it often contains the most relevant information.
The information contained in this report is based on sources that are deemed to be reliable; however no representation or warranty is made as to the accuracy, completeness, or fitness for any particular purpose of any information contained herein. This report is not intended as investment advice, and should not be viewed as any guarantee of value, condition, or other attribute.
Contact Information:
Media Contact:
Michelle Sabolich
Atomic PR for Clear Capital
415.593.1400