NORFOLK, NE--(Marketwire - Nov 14, 2011) - Supertel Hospitality, Inc. (
Revenues from continuing operations for the 2011 third quarter decreased 0.4 percent to $23.4 million, compared to the same year-ago period. Net loss attributable to common shareholders was $(1.8) million, or $(0.08) per diluted share, for the 2011 third quarter, compared to a net loss of $(0.5) million, or $(0.02) per diluted share, in the 2010 same quarter. The 2011 third quarter loss includes an impairment charge of $2.7 million, taken against 14 held for sale properties. Of this, $0.7 million was taken on 13 of the hotels due to market changes, and $2.0 million was taken on one other hotel due to changes in its projected holding period. There also was a recovery of previously recorded impairment on two sold properties and one held for sale hotel in the amount of $0.1 million. Twenty hotels were classified as held for sale during the 2011 third quarter. The 2010 third quarter loss included a net $0.9 million impairment charge.
The company reported a loss of $(0.5) million, or $(0.02) per diluted share, in funds from operations (FFO) in the 2011 third quarter, compared to a gain of $2.4 million, or $0.10 per diluted share, in the same 2010 period. Funds from operations without impairment, a non-cash item (FFO without impairment) in the 2011 third quarter was $2.1 million, or $0.09 per diluted share, compared with $3.3 million, or $0.15 per diluted share in the same period of 2010. Of the $0.06 decrease, $0.04 was due to discontinued operations.
Earnings before interest, taxes, depreciation and amortization, non-controlling interest and preferred stock dividends (Adjusted EBITDA) decreased to $4.4 million, compared to $5.8 million for the third quarter of 2010. Of the $1.4 million decrease, $2.3 million was due to discontinued operations.
Third Quarter Highlights
- The company sold two hotels in July 2011: a Masters Inn in Charleston, S.C. (119 rooms) for $3.75 million and a Masters Inn in Marietta, Ga. (87 rooms) for $1.35 million with no gain or loss on either sale. The proceeds were used to pay down the company's GE Capital Corporation loan. A total of $0.6 million in prepayment penalties on the two loans was deferred until January 1, 2012.
- On September 20, 2011, the company refinanced its existing $0.86 million loan with Elkhorn Valley Bank and borrowed an additional $0.1 million, which was used to reduce the company's revolving line of credit with Great Western Bank. The new $0.96 million note matures on September 15, 2013 with annual interest of 5.75% and is secured by a hotel located in Watertown, South Dakota.
- On September 30, 2011, the company sold its corporate office building in Norfolk. Proceeds of $1.75 million were used to pay off the $0.8 million mortgage with Elkhorn Valley Bank, and the remaining balance was used to reduce the revolver with Great Western Bank. The company headquarters will move to leased office space in Norfolk and the company will also continue to maintain leased office space in Omaha.
- On September 30, 2011, the maturity date of the company's $2.2 million credit facility with Wells Fargo Bank was extended from September 30, 2011 to November 30, 2011.
"We continue to make steady progress in our transition from two to four management companies, including the sale of our corporate office building which was previously leased to the former management company," said Kelly A. Walters, Supertel president and CEO. "We anticipate that all of the major components of transition will be completed by year-end, and we will begin to see the positive fruits of this strategic decision. Most of the one-time fees and costs associated with the transition are behind us, and we are focused on fully ramping up the new management teams."
Third Quarter Results
The company reported a net loss of $(1.4) million for the 2011 third quarter, compared to a net loss of $(0.1) million for the same 2010 period. All income and expenses related to sold and held for sale hotels are classified as discontinued operations. "As we continue to divest our portfolio of the underperforming hotels shown in discontinued operations, we expect overall operations and cash flows will improve and will be reflected in improved measures such as earnings per share, FFO and EBITDA," said Connie Scarpello, the company's chief financial officer.
After non-controlling interest and recognition of dividends for preferred stock shareholders, the net loss attributable to common shareholders was $(1.8) million, or $(0.08) per diluted share, for the 2011 third quarter, compared with net loss attributable to common shareholders of $(0.5) million, or $(0.02) per diluted share, for the same 2010 period.
Third quarter 2011 revenues from continuing operations declined $0.1 million, or 0.4 percent, primarily due to lower occupancy, largely offset by a higher average daily rate (ADR).
The portfolio of 81 hotels in continuing operations in the 2011 third quarter reported a decrease of 4.2 percent in occupancy, and a 3.9 percent increase in ADR, compared with the same period a year earlier.
| Third Quarter 2011 vs Third Quarter 2010 | ||||||||||||||||||||
| Occupancy (%) | ADR ($) | RevPar ($) | ||||||||||||||||||
| 2011 | 2010 | Variance | 2011 | 2010 | Variance | 2011 | 2010 | Variance | ||||||||||||
| Industry - Total US Market | 66.5 | 63.9 | 4.1 | % | 102.96 | 99.19 | 3.8 | % | 68.44 | 63.40 | 7.9 | % | ||||||||
| Supertel - Continuing Operations Portfolio | 68.0 | 71.0 | -4.2 | % | 53.30 | 51.31 | 3.9 | % | 36.22 | 36.41 | -0.5 | % | ||||||||
| Chain Scale | ||||||||||||||||||||
| Industry - Midscale | 61.1 | 59.4 | 2.9 | % | 77.01 | 77.59 | -0.7 | % | 47.03 | 46.07 | 2.1 | % | ||||||||
| Supertel - Midscale | 67.8 | 69.5 | -2.4 | % | 70.39 | 68.71 | 2.4 | % | 47.69 | 47.72 | -0.1 | % | ||||||||
| Industry - Economy | 59.9 | 58.2 | 2.9 | % | 53.98 | 52.56 | 2.7 | % | 32.32 | 30.56 | 5.8 | % | ||||||||
| Supertel - Economy | 67.3 | 70.3 | -4.3 | % | 52.36 | 50.34 | 4.0 | % | 35.24 | 35.40 | -0.5 | % | ||||||||
| Industry - Extended Stay | N/A | N/A | N/A | N/A | N/A | N/A | N/A | N/A | N/A | |||||||||||
| Supertel - Extended Stay | 70.5 | 76.0 | -7.2 | % | 24.08 | 23.12 | 4.2 | % | 16.98 | 17.58 | -3.4 | % | ||||||||
| Industry Source: STR Monthly Review | ||||||||||||||||||||
Midscale Hotels
Third quarter revenue per available room (RevPAR) for the company's 28 continuing operations midscale hotels decreased 0.1 percent to $47.69. Occupancy declined 2.4 percent with an offsetting ADR increase of 2.4 percent to $70.39.
Economy Hotels
The company's 46 continuing operations economy hotels reported a 0.5 percent decrease in RevPAR to $35.24 in the 2011 third quarter, caused by a 4.0 percent increase in ADR and offset by a 4.3 percent decline in occupancy.
Extended Stay Hotels
The company's seven continuing operations extended stay hotels reported a 3.4 percent decrease in RevPAR to $16.98, reflecting a 7.2 percent drop in occupancy to 70.5 percent, and a 4.2 percent increase in ADR to $24.08.
"Industry-wide, many of the hotels in smaller, tertiary markets have not achieved the same robust growth as experienced in larger cities, and a substantial number of our markets remain soft," Walters said. "The Southern and Southeast regions continue to struggle economically, which has particularly impacted the construction and oil drilling industries, significant contributors to our business traveler occupancy in those markets. We are working closely with our operators to focus on rebuilding this lost occupancy, while optimizing room rate as much as possible. Each property is continuously adjusting to find the optimum mix between rate and occupancy.
"We have larger field sales efforts under way now than at any time in the past," he noted. "It will take a while to build momentum, but we are beginning to see improvements in a growing number of markets. Top-line revenue growth is a priority.
"Supertel continues to outperform the industry in occupancy and RevPAR in the midscale and economy segments," he added. "Our RevPAR index improved in every month of the quarter according to Smith Travel Research, and we believe there is continued opportunity."
Hotel and property operations expenses from continuing operations for the 2011 third quarter increased 1.7 percent to $17.0 million, compared with the like 2010 period. The major contributors to the increase were payroll expenses, breakfast costs and room supplies.
Interest expense from continuing operations for the quarter decreased by $0.1 million to $2.2 million. Depreciation and amortization expense from continuing operations decreased by $0.3 million from the 2010 third quarter to $2.3 million. General and administration expense from continuing operations for the 2011 third quarter increased $0.1 million, compared to the prior period.
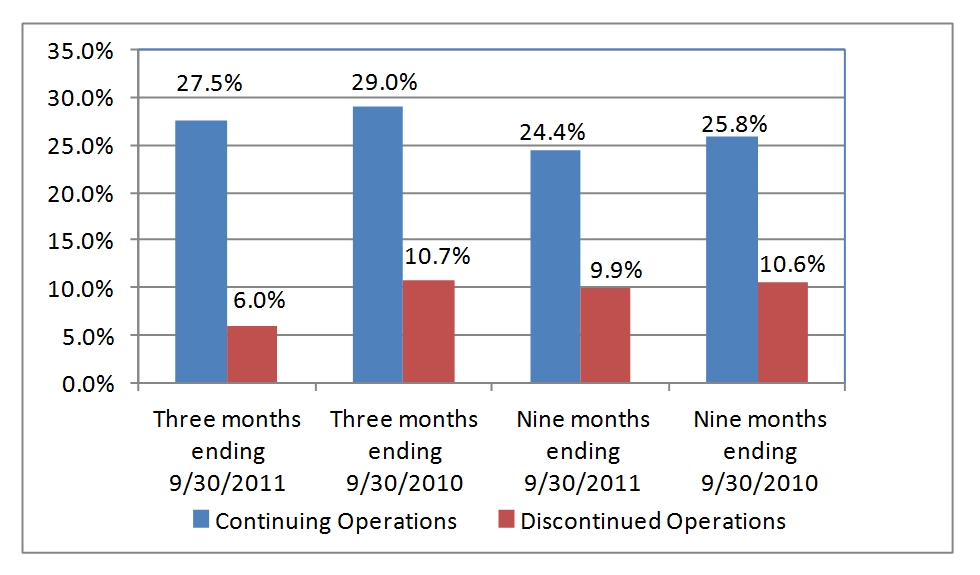
For the 2011 third quarter, POI from continuing operations decreased $0.4 million, or 5.6 percent, compared to the same year-ago period. POI is calculated as revenue from room rentals and other hotel services less hotel and property operations expenses. The decrease in POI over the prior year's third quarter is largely due to slightly lower revenues and higher operating expenses. See attached chart (Property Operating Income as a Percent of Sales).
Portfolio Update
"The low POI at our discontinued operations hotels further validates our decision to sell those properties," said Scarpello. "As we continue to rebalance our portfolio in an orderly fashion, concentrating on the lowest performing hotels first, the quality of our portfolio continues to improve."
The company listed four additional hotels as held for sale in the third quarter, including one which was purchased in 2007 that had an impairment loss of $2.0 million, bringing to 20 the number of properties in this category. "The vast majority of these assets were acquired at the peak of the market, between 2005 and 2008. They have not fared nearly as well as our core portfolio, which has resulted in approximately $37.9 million in impairment charges in the past three years," Scarpello added.
The company sold the 87-room Masters Inn in Marietta, Ga. and the 119-room Masters Inn in Charleston, S.C., for a total of approximately $5.1 million. Proceeds were used to pay down direct debt with GE Capital Corporation.
Balance Sheet
The company as of September 30, 2011 had total debt of $164.5 million, down from a peak of $221.2 million at the close of the 2008 first quarter. Outstanding debt on hotels in continuing operations totaled $136.4 million, and has an average term to maturity of 3.4 years and a weighted average annual interest rate of 6.1 percent. The company's current 20 held for sale properties have $28.2 million of associated debt.
"The Company has significant indebtedness maturing over the next seven months, including the following loans with Great Western Bank: a $9.9 million term loan maturing December 5, 2011, a $20 million revolving credit facility maturing February 22, 2012 and a $9.3 million term loan maturing May 5, 2012. If we are not successful in negotiating the refinancing of this debt, or finding alternate sources of financing in a difficult borrowing environment, we will be unable to meet the Company's near-term liquidity requirements," Walters said.
Dividends
The company did not declare a common stock dividend for the 2011 third quarter. Preferred dividends continue uninterrupted. The board of directors continues to monitor requirements to maintain the company's REIT status on a quarterly basis.
Outlook
"We continue to make progress and we are seeing momentum starting to build in our turn-around plan," Walters said. "We believe that it will take at least through the 2011 fourth quarter before we start seeing a noticeable positive impact from the new operators' influence on the portfolio, but we firmly believe that our transition to the new structure effectively places us on the path toward a solid recovery with a more aggressive growth trajectory.
"We have a much stronger sales and marketing emphasis. We have continued to improve our balance sheet and to evaluate financing options. We are in the process of reviewing proposed property level budgeting for 2012 and are encouraged by a notable increase in sales efforts to build revenues during this critical stage of our transition."
About Supertel Hospitality, Inc.
As of September 30, 2011, Supertel Hospitality, Inc. (
Certain matters within this press release are discussed using forward-looking language as specified in the Private Securities Litigation Reform Act of 1995, and, as such, may involve known and unknown risks, uncertainties and other factors that may cause the actual results or performance to differ from those projected in the forward-looking statement. These risks are discussed in the Company's filings with the Securities and Exchange Commission.
SELECTED FINANCIAL DATA:
The following table sets forth the Company's balance sheet as of September 30, 2011 and December 31, 2010. The Company owned 101 hotels at September 30, 2011 and 106 hotels as of December 31, 2010.
(in thousands, except share and per share data)
| As of | ||||||||||
| September 30, | December 31, | |||||||||
| 2011 | 2010 | |||||||||
| (unaudited) | ||||||||||
| ASSETS | ||||||||||
| Investments in hotel properties | $ | 277,027 | $ | 280,660 | ||||||
| Less accumulated depreciation | 87,182 | 83,417 | ||||||||
| 189,845 | 197,243 | |||||||||
| Cash and cash equivalents | 309 | 333 | ||||||||
| Accounts receivable, net of allowance for doubtful accounts of $139 and $133 | 2,580 | 1,717 | ||||||||
| Prepaid expenses and other assets | 8,502 | 13,372 | ||||||||
| Deferred financing costs, net | 688 | 988 | ||||||||
| Investment in hotel properties, held for sale, net | 28,081 | 42,991 | ||||||||
| $ | 230,005 | $ | 256,644 | |||||||
| LIABILITIES AND EQUITY | ||||||||||
| LIABILITIES | ||||||||||
| Accounts payable, accrued expenses and other liabilities | $ | 11,858 | $ | 17,732 | ||||||
| Debt related to hotel properties held for sale | 28,175 | 36,819 | ||||||||
| Long-term debt | 136,374 | 138,191 | ||||||||
| 176,407 | 192,742 | |||||||||
| Redeemable noncontrolling interest in consolidated partnership, at redemption value | 511 | 511 | ||||||||
| Redeemable preferred stock 10% Series B, 800,000 shares authorized; $.01 par value, 332,500 shares outstanding, liquidation preference of $8,312 | 7,662 | 7,662 | ||||||||
| EQUITY | ||||||||||
| Shareholders' equity | ||||||||||
| Preferred stock, 40,000,000 shares authorized; 8% Series A, 2,500,000 shares authorized, $.01 par value, 803,270 shares outstanding, liquidation preference of $8,033 | ||||||||||
| 8 | 8 | |||||||||
| Common stock, $.01 par value, 100,000,000 shares authorized; 23,005,387 and 22,917,509 shares outstanding | ||||||||||
| 230 | 229 | |||||||||
| Common stock warrants | 252 | 252 | ||||||||
| Additional paid-in capital | 121,572 | 121,384 | ||||||||
| Distributions in excess of retained earnings | (76,806 | ) | (66,479 | ) | ||||||
| Total shareholders' equity | 45,256 | 55,394 | ||||||||
| Noncontrolling interest | ||||||||||
| Noncontrolling interest in consolidated partnership, redemption value $73 and $250 | ||||||||||
| 169 | 335 | |||||||||
| Total equity | 45,425 | 55,729 | ||||||||
| COMMITMENTS AND CONTINGENCIES | ||||||||||
| $ | 230,005 | $ | 256,644 | |||||||
The following table sets forth the Company's results of operations for the three and nine months ended September 30, 2011 and 2010, respectively.
(Unaudited in thousands, except per share data)
| Three Months Ended | Nine Months Ended | ||||||||||||||||
| September 30, | September 30, | ||||||||||||||||
| 2011 | 2010 | 2011 | 2010 | ||||||||||||||
| REVENUES | |||||||||||||||||
| Room rentals and other hotel services | $ | 23,428 | $ | 23,533 | $ | 61,919 | $ | 61,804 | |||||||||
| EXPENSES | |||||||||||||||||
| Hotel and property operations | 16,983 | 16,706 | 46,816 | 45,886 | |||||||||||||
| Depreciation and amortization | 2,337 | 2,598 | 7,187 | 7,920 | |||||||||||||
| General and administrative | 906 | 782 | 3,011 | 2,582 | |||||||||||||
| Termination cost | - | - | 540 | - | |||||||||||||
| 20,226 | 20,086 | 57,554 | 56,388 | ||||||||||||||
| EARNINGS BEFORE NET GAIN (LOSS) ON DISPOSITIONS OF ASSETS, OTHER INCOME, INTEREST EXPENSE AND INCOME TAXES | 3,202 |
3,447 |
4,365 |
5,416 |
|||||||||||||
| Net gain (loss) on dispositions of assets | 1,139 | (13 | ) | 1,126 | (47 | ) | |||||||||||
| Other income | 2 | 31 | 107 | 92 | |||||||||||||
| Interest expense | (2,155 | ) | (2,290 | ) | (6,886 | ) | (6,926 | ) | |||||||||
| Impairment | - | (274 | ) | (2,801 | ) | (2,421 | ) | ||||||||||
| INCOME (LOSS) FROM CONTINUING OPERATIONS BEFORE INCOME TAXES | |||||||||||||||||
| 2,188 | 901 | (4,089 | ) | (3,886 | ) | ||||||||||||
| Income tax (expense) benefit | (173 | ) | (274 | ) | 486 | 184 | |||||||||||
| INCOME (LOSS) FROM CONTINUING OPERATIONS | 2,015 | 627 | (3,603 | ) | (3,702 | ) | |||||||||||
| Loss from discontinued operations, net of tax | (3,419 | ) | (718 | ) | (5,624 | ) | (3,081 | ) | |||||||||
| NET LOSS | (1,404 | ) | (91 | ) | (9,227 | ) | (6,783 | ) | |||||||||
| Noncontrolling interest | (8 | ) | (13 | ) | 5 | 5 | |||||||||||
| NET LOSS ATTRIBUTABLE TO CONTROLLING INTERESTS | (1,412 | ) | (104 | ) | (9,222 | ) | (6,778 | ) | |||||||||
| Preferred stock dividends | (369 | ) | (368 | ) | (1,105 | ) | (1,105 | ) | |||||||||
| NET LOSS ATTRIBUTABLE TO COMMON SHAREHOLDERS | $ (1,781 |
) | $ (472 |
) | $ (10,327 |
) | $ (7,883 |
) | |||||||||
| NET EARNINGS PER COMMON SHARE - BASIC AND DILUTED | |||||||||||||||||
| EPS from continuing operations | $ | 0.07 | $ | 0.01 | $ | (0.20 | ) | $ | (0.21 | ) | |||||||
| EPS from discontinued operations | $ | (0.15 | ) | $ | (0.03 | ) | $ | (0.25 | ) | $ | (0.14 | ) | |||||
| EPS Basic and Diluted | $ | (0.08 | ) | $ | (0.02 | ) | $ | (0.45 | ) | $ | (0.35 | ) | |||||
RECONCILIATION OF NON-GAAP FINANCIAL MEASURES
Unaudited-In thousands, except per share data:
| Three months | Nine Months | |||||||||||||||
| ended September 30, | ended September 30, | |||||||||||||||
| 2011 | 2010 | 2011 | 2010 | |||||||||||||
| Weighted average shares outstanding for: calculation of FFO per share - basic and diluted | 23,005 | 22,880 | 22,963 | 22,435 | ||||||||||||
| Reconciliation of net loss to FFO | ||||||||||||||||
| Net loss attributable to common shareholders | $ | (1,781 | ) | $ | (472 | ) | $ | (10,327 | ) | $ | (7,883 | ) | ||||
| Depreciation and amortization | 2,420 | 2,908 | 7,684 | 8,959 | ||||||||||||
| Net gain on disposition of assets | (1,126 | ) | (46 | ) | (1,461 | ) | (513 | ) | ||||||||
| FFO available to common shareholders | $ | (487 | ) | $ | 2,390 | $ | (4,104 | ) | $ | 563 | ||||||
| Impairment | 2,561 | 933 | 7,823 | 5,649 | ||||||||||||
| FFO without impairment, a non-cash item | $ | 2,074 | $ | 3,323 | $ | 3,719 | $ | 6,212 | ||||||||
| FFO per share - basic and diluted | $ | (0.02 | ) | $ | 0.10 | $ | (0.18 | ) | $ | 0.03 | ||||||
| FFO without impairment, a non-cash item, per share - basic and diluted | $ | 0.09 | $ | 0.15 | $ | 0.16 | $ | 0.28 | ||||||||
| Reconciliation of net loss to FFO without impairment - continuing operations | Three Months Ended September 30, |
Nine Months Ended September 30, |
||||||||||||||
| 2011 | 2010 | 2011 | 2010 | |||||||||||||
| Income (loss) from continuing operations | 2,015 | 627 | (3,603 | ) | (3,702 | ) | ||||||||||
| Preferred dividends | (369 | ) | (368 | ) | (1,105 | ) | (1,105 | ) | ||||||||
| Noncontrolling interest | (8 | ) | (13 | ) | 5 | 5 | ||||||||||
| Depreciation and amortization | 2,337 | 2,598 | 7,187 | 7,920 | ||||||||||||
| Net (gain) loss on disposition of assets | (1,139 | ) | 13 | (1,126 | ) | 47 | ||||||||||
| FFO available to common shareholders - continuing operations | 2,836 | 2,857 | 1,358 | 3,165 | ||||||||||||
| Impairment | - | 274 | 2,801 | 2,421 | ||||||||||||
| FFO without impairment, a non-cash item - continuing operations | $ | 2,836 | $ | 3,131 | $ | 4,159 | $ | 5,586 | ||||||||
| FFO without impairment, a non-cash item, per share, continuing - basic and diluted | $ | 0.12 | $ | 0.14 | $ | 0.18 | $ | 0.25 | ||||||||
| Reconciliation of loss from discontinued operations, net of tax to FFO without impairment - discontinued operations | Three Months Ended September 30, |
Nine Months Ended September 30, |
||||||||||||||
| 2011 | 2010 | 2011 | 2010 | |||||||||||||
| Loss from discontinued operations, net of tax | (3,419 | ) | (718 | ) | (5,624 | ) | (3,081 | ) | ||||||||
| Depreciation and amortization | 83 | 310 | 497 | 1,039 | ||||||||||||
| Net(gain) loss on disposition of assets | 13 | (59 | ) | (335 | ) | (560 | ) | |||||||||
| FFO available to common shareholders - discontinued operations | (3,323 | ) | (467 | ) | (5,462 | ) | (2,602 | ) | ||||||||
| Impairment | 2,561 | 659 | 5,022 | 3,228 | ||||||||||||
| FFO without impairment, a non-cash item - discontinued operations | $ | (762 | ) | $ | 192 | $ | (440 | ) | $ | 626 | ||||||
| FFO without impairment, a non-cash item, per share, discontinued - basic and diluted | $ | (0.03 | ) | $ | 0.01 | $ | (0.02 | ) | $ | 0.03 | ||||||
FFO is a non-GAAP financial measure. We consider FFO to be a market accepted measure of an equity REIT's operating performance, which is necessary, along with net earnings (loss), for an understanding of our operating results. FFO, as defined under the National Association of Real Estate Investment Trusts (NAREIT) standards, consists of net income computed in accordance with GAAP, excluding gains (or losses) from sales of real estate assets, plus depreciation and amortization of real estate assets. We believe our method of calculating FFO complies with the NAREIT definition. FFO does not represent amounts available for management's discretionary use because of needed capital replacement or expansion, debt service obligations, or other commitments and uncertainties. FFO should not be considered as an alternative to net income (loss) (computed in accordance with GAAP) as an indicator of our liquidity, nor is it indicative of funds available to fund our cash needs, including our ability to pay dividends or make distributions. All REITs do not calculate FFO in the same manner; therefore, our calculation may not be the same as the calculation of FFO for similar REITs.
We use FFO as a performance measure to facilitate a periodic evaluation of our operating results relative to those of our peers, who, like us, are typically members of NAREIT. We consider FFO a useful additional measure of performance for an equity REIT because it facilitates an understanding of the operating performance of our properties without giving effect to real estate depreciation and amortization, which assume that the value of real estate assets diminishes predictably over time. Since real estate values have historically risen or fallen with market conditions, we believe that FFO provides a meaningful indication of our performance.
FFO without impairment, a non-cash item, ("FFO without impairment") is a non-GAAP financial measure. As a result of a significant downturn in hotel and lodging fundamentals that took place in 2008 and 2009 and the related decrease in hotel and real estate valuations, we decided that FFO available to common shareholders did not provide all of the information that allows us to better evaluate our operating performance.
To arrive at FFO without impairment, we adjust FFO available to common shareholders, to exclude the following items:
- impairment losses on hotel properties that we have sold or expect to sell, included in discontinued operations; and
- impairment losses on hotel properties classified as held for use.
We believe that these items are driven by factors relating to the fundamental disruption in the global financial and real estate markets, rather than factors specific to the company or the performance of our properties or investments.
The impairment losses on hotel properties that were recognized in 2009 and 2010 were primarily based on valuations of hotels, which had declined due to market conditions that we no longer expected to hold for long-term investment, and/or for which we have reduced our prior expected holding periods. In order to enhance liquidity, we have declared certain properties as held for sale and may declare other properties held for sale. To the extent these properties are expected to be sold at a loss, we record an impairment loss when the loss is known. We have recognized certain of these impairment losses in several quarters in 2009 and 2010 and in the nine months ending September 30, 2011, and we believe it is reasonably likely that we will recognize similar charges and recovery in the near future.
However, we believe that as the financial markets stabilize, the potential for impairment losses on our hotel properties will diminish. We believe FFO without impairment provides investors with an additional measure to evaluate our operating performance as we emerge from this period of fundamental disruption in the global financial and real estate markets.
We analyze our operating performance primarily by revenues from our hotel properties, net of operating, administrative and financing expenses which are not directly impacted by short term fluctuations in the market value of our hotel properties. As a result, although these non-cash impairment losses have had a material impact on our financial results and are reflected in our financial statements, the removal of the effects of these items allows us to better understand the core operating performance of our properties.
| Unaudited-In thousands, except statistical data: | Three months | Nine months | |||||||||||||||
| ended September 30, | ended September 30, | ||||||||||||||||
| 2011 | 2010 | 2011 | 2010 | ||||||||||||||
| RECONCILIATION OF NET LOSS TO ADJUSTED EBITDA | |||||||||||||||||
| Net loss attributable to common shareholders | $ | (1,781 | ) | $ | (472 | ) | $ | (10,327 | ) | $ | (7,883 | ) | |||||
| Interest expense, including discontinued operations | 3,462 | 3,011 | 9,426 | 9,141 | |||||||||||||
| Income tax benefit, including discontinued operations | (111 | ) | (33 | ) | (1,238 | ) | (1,201 | ) | |||||||||
| Depreciation and amortization, including discontinued operations | 2,420 | 2,908 | 7,684 | 8,959 | |||||||||||||
| EBITDA | 3,990 | 5,414 | 5,545 | 9,016 | |||||||||||||
| Noncontrolling interest | 8 | 13 | (5 | ) | (5 | ) | |||||||||||
| Preferred stock dividend | 369 | 368 | 1,105 | 1,105 | |||||||||||||
| Adjusted EBITDA | $ | 4,367 | $ | 5,795 | $ | 6,645 | $ | 10,116 | |||||||||
| Reconciliation of income (loss) from continuing operations to Adjusted EBITDA - Continuing Operations | Three Months Ended September 30, |
Nine Months Ended September 30, |
||||||||||||
| 2011 | 2010 | 2011 | 2010 | |||||||||||
| Income (loss) from continuing operations | 2,015 | 627 | (3,603 | ) | (3,702 | ) | ||||||||
| Interest expense | 2,155 | 2,290 | 6,886 | 6,926 | ||||||||||
| Income tax expense (benefit) | 173 | 274 | (486 | ) | (184 | ) | ||||||||
| Depreciation and amortization | 2,337 | 2,598 | 7,187 | 7,920 | ||||||||||
| Adjusted EBITDA | $ | 6,680 | $ | 5,789 | $ | 9,984 | $ | 10,960 | ||||||
| Reconciliation of loss from discontinued operations, net of tax to Adjusted EBITDA - Discontinued Operations | Three Months Ended September 30, |
Nine Months Ended September 30, |
||||||||||||||
| 2011 | 2010 | 2011 | 2010 | |||||||||||||
| Loss from discontinued operations, net of tax | (3,419 | ) | (718 | ) | (5,624 | ) | (3,081 | ) | ||||||||
| Interest expense | 1,307 | 721 | 2,540 | 2,215 | ||||||||||||
| Income tax benefit | (284 | ) | (307 | ) | (752 | ) | (1,017 | ) | ||||||||
| Depreciation and amortization | 83 | 310 | 497 | 1,039 | ||||||||||||
| Adjusted EBITDA | $ | (2,313 | ) | $ | 6 | $ | (3,339 | ) | $ | (844 | ) | |||||
Adjusted EBITDA is a financial measure that is not calculated in accordance with accounting principles generally accepted in the United States of America ("GAAP"). We calculate Adjusted EBITDA by adding back to net earnings (loss) available to common shareholders certain non-operating expenses and non-cash charges which are based on historical cost accounting and we believe may be of limited significance in evaluating current performance. We believe these adjustments can help eliminate the accounting effects of depreciation and amortization and financing decisions and facilitate comparisons of core operating profitability between periods, even though Adjusted EBITDA also does not represent an amount that accrues directly to common shareholders. In calculating Adjusted EBITDA, we also add back preferred stock dividends and noncontrolling interests, which are cash charges.
Adjusted EBITDA doesn't represent cash generated from operating activities determined by GAAP and should not be considered as an alternative to net income, cash flow from operations or any other operating performance measure prescribed by GAAP. Adjusted EBITDA is not a measure of our liquidity, nor is Adjusted EBITDA indicative of funds available to fund our cash needs, including our ability to make cash distributions. Neither does the measurement reflect cash expenditures for long-term assets and other items that have been and will be incurred. Adjusted EBITDA may include funds that may not be available for management's discretionary use due to functional requirements to conserve funds for capital expenditures, property acquisitions, and other commitments and uncertainties. To compensate for this, management considers the impact of these excluded items to the extent they are material to operating decisions or the evaluation of our operating performance. Adjusted EBITDA, as presented, may not be comparable to similarly titled measures of other companies.
The following table sets forth the operations of the Company's same store hotel properties for the three and nine months ended September 30, 2011 and 2010, respectively.
| Unaudited | Three months | Nine months | |||||||||||||||||
| ended September 30, | ended September 30, | ||||||||||||||||||
| 2011 | 2010 | 2011 | 2010 | ||||||||||||||||
| Same Store: | |||||||||||||||||||
| Revenue per available room (RevPAR): | |||||||||||||||||||
| Midscale | $ | 47.69 | $ | 47.72 | $ | 41.62 | $ | 41.88 | |||||||||||
| Economy | $ | 35.24 | $ | 35.40 | $ | 31.15 | $ | 30.85 | |||||||||||
| Extended Stay | $ | 16.98 | $ | 17.58 | $ | 17.45 | $ | 17.52 | |||||||||||
| Total | $ | 36.22 | $ | 36.41 | $ | 32.24 | $ | 32.17 | |||||||||||
| Average daily room rate (ADR): | |||||||||||||||||||
| Midscale | $ | 70.39 | $ | 68.71 | $ | 67.98 | $ | 65.84 | |||||||||||
| Economy | $ | 52.36 | $ | 50.34 | $ | 50.18 | $ | 48.65 | |||||||||||
| Extended Stay | $ | 24.08 | $ | 23.12 | $ | 23.76 | $ | 23.31 | |||||||||||
| Total | $ | 53.30 | $ | 51.31 | $ | 50.67 | $ | 49.23 | |||||||||||
| Occupancy percentage: | |||||||||||||||||||
| Midscale | 67.8 | % | 69.5 | % | 61.2 | % | 63.6 | % | |||||||||||
| Economy | 67.3 | % | 70.3 | % | 62.1 | % | 63.4 | % | |||||||||||
| Extended Stay | 70.5 | % | 76.0 | % | 73.4 | % | 75.2 | % | |||||||||||
| Total | 68.0 | % | 71.0 | % | 63.6 | % | 65.4 | % | |||||||||||
This presentation includes non-GAAP financial measures. The Company believes that the presentation of hotel property operating income (POI) is helpful to investors, and represents a more useful description of its operations, as it better communicates the comparability of its hotels' operating results.
Same Store reflects 81 hotels in continuing operations for the three months and year to date ended September 30, 2011 and 2010.
| Unaudited-In thousands, except statistical data: | Three months | Nine months | ||||||||||||||||
| ended September 30, | ended September 30, | |||||||||||||||||
| Continuing Operations | 2011 | 2010 | 2011 | 2010 | ||||||||||||||
| Total Hotels: | ||||||||||||||||||
| Revenue per available room (RevPAR): | $ | 36.22 | $ | 36.41 | $ | 32.24 | $ | 32.17 | ||||||||||
| Average daily room rate (ADR): | $ | 53.30 | $ | 51.31 | $ | 50.67 | $ | 49.23 | ||||||||||
| Occupancy percentage: | 68.0 | % | 71.0 | % | 63.6 | % | 65.4 | % | ||||||||||
| Revenue from room rentals and other hotel services consists of: | ||||||||||||||||||
| Room rental revenue | $ | 22,736 | $ | 22,856 | $ | 60,052 | $ | 59,928 | ||||||||||
| Telephone revenue | 77 | 74 | 222 | 228 | ||||||||||||||
| Other hotel service revenues | 615 | 603 | 1,645 | 1,648 | ||||||||||||||
| Total revenue from room rentals and other hotel services | $ | 23,428 | $ | 23,533 | $ | 61,919 | $ | 61,804 | ||||||||||
| Hotel and property operations expense | ||||||||||||||||||
| Total hotel and property continuing operations expense | $ | 16,983 | $ | 16,706 | $ | 46,816 | $ | 45,886 | ||||||||||
| POI | ||||||||||||||||||
| Total property continuing operating income | $ | 6,445 | $ | 6,827 | $ | 15,103 | $ | 15,918 | ||||||||||
| POI as a percentage of revenue from room rentals and other hotel services - continuing operations | ||||||||||||||||||
| Total POI as a percentage of continuing operations revenue | 27.5 | % | 29.0 | % | 24.4 | % | 25.8 | % | ||||||||||
| Same Store reflects 81 hotels. | ||||||||||||||||||
| Discontinued Operations | ||||||||||||||||||
| Room rentals and other hotel services | ||||||||||||||||||
| Total room rental and other hotel services - discontinued operations | $ | 4,323 | $ | 5,927 | $ | 14,154 | $ | 17,699 | ||||||||||
| Hotel and property operations expense | ||||||||||||||||||
| Total hotel and property operations expense - discontinued operations | $ | 4,062 | $ | 5,294 | $ | 12,756 | $ | 15,826 | ||||||||||
| POI | ||||||||||||||||||
| Total property operating income - discontinued operations | $ | 261 | $ | 633 | $ | 1,398 | $ | 1,873 | ||||||||||
| POI as a percentage of revenue from room rentals | ||||||||||||||||||
| and other hotel services - discontinued operations | ||||||||||||||||||
| Total POI as a percentage of revenue | 6.0 | % | 10.7 | % | 9.9 | % | 10.6 | % | ||||||||||
| RECONCILIATION OF INCOME (LOSS) FROM | ||||||||||||||||||
| CONTINUING OPERATIONS TO POI | ||||||||||||||||||
| Net income (loss) | $ | 2,015 | $ | 627 | $ | (3,603 | ) | $ | (3,702 | ) | ||||||||
| Depreciation and amortization | 2,337 | 2,598 | 7,187 | 7,920 | ||||||||||||||
| Net (gain) loss on disposition of assets | (1,139 | ) | 13 | (1,126 | ) | 47 | ||||||||||||
| Other income | (2 | ) | (31 | ) | (107 | ) | (92 | ) | ||||||||||
| Interest expense | 2,155 | 2,290 | 6,886 | 6,926 | ||||||||||||||
| General and administrative expense | 906 | 782 | 3,011 | 2,582 | ||||||||||||||
| Termination cost | - | - | 540 | - | ||||||||||||||
| Income tax (benefit) expense | 173 | 274 | (486 | ) | (184 | ) | ||||||||||||
| Impairment | - | 274 | 2,801 | 2,421 | ||||||||||||||
| POI | $ | 6,445 | $ | 6,827 | $ | 15,103 | $ | 15,918 | ||||||||||
| Net income (loss) as a percentage of continuing operations revenue from room rentals and other hotel services | 8.6 | % | 2.7 | % | -5.8 | % | -6.0 | % | ||||||||||
| Reconciliation of loss from discontinued operations, net of tax to POI - discontinued operations: | Three months | Nine months | ||||||||||||||
| ended September 30, | ended September 30, | |||||||||||||||
| 2011 | 2010 | 2011 | 2010 | |||||||||||||
| Loss from discontinued operations, net of tax | $ | (3,419 | ) | $ | (718 | ) | $ | (5,624 | ) | $ | (3,081 | ) | ||||
| Depreciation and amortization from discontinued operations | 83 | 310 | 497 | 1,039 | ||||||||||||
| Net (gain) loss on disposition of assets from discontinued operations | 13 | (59 | ) | (335 | ) | (560 | ) | |||||||||
| Interest expense from discontinued operations | 1,307 | 721 | 2,540 | 2,215 | ||||||||||||
| General and administrative expense from discontinued operations | - | 27 | 50 | 49 | ||||||||||||
| Impairment losses from discontinued operations | 2,561 | 659 | 5,022 | 3,228 | ||||||||||||
| Income tax benefit from discontinued operations | (284 | ) | (307 | ) | (752 | ) | (1,017 | ) | ||||||||
| POI--discontinued operations | $ | 261 | $ | 633 | $ | 1,398 | $ | 1,873 | ||||||||
The following unaudited table presents our RevPAR, ADR and Occupancy, by region, for the three months ended September 30, 2011 and 2010, respectively. The comparisons of same store operations are for 81* hotels in continuing operations as of July 1, 2010.
| Three months ended September 30, 2011 | Three months ended September 30, 2010 | |||||||||||||||||||||
| Same Store | Room | Room | ||||||||||||||||||||
| Region | Count | RevPAR | Occupancy | ADR | Count | RevPAR | Occupancy | ADR | ||||||||||||||
| Mountain | 214 | $ | 44.27 | 80.9 | % | $ | 54.70 | 214 | $ | 42.56 | 82.0 | % | $ | 51.87 | ||||||||
| West North Central | 2,273 | 34.28 | 66.0 | % | 51.93 | 2,273 | 33.10 | 66.8 | % | 49.52 | ||||||||||||
| East North Central | 1,029 | 44.77 | 66.4 | % | 67.41 | 1,029 | 47.76 | 73.8 | % | 64.75 | ||||||||||||
| Middle Atlantic | 142 | 50.60 | 83.1 | % | 60.92 | 142 | 50.03 | 82.8 | % | 60.42 | ||||||||||||
| South Atlantic | 2,233 | 31.79 | 69.6 | % | 45.66 | 2,233 | 31.70 | 73.2 | % | 43.28 | ||||||||||||
| East South Central | 708 | 40.56 | 65.3 | % | 62.06 | 708 | 41.08 | 66.5 | % | 61.77 | ||||||||||||
| West South Central | 225 | 30.28 | 64.5 | % | 46.93 | 225 | 35.55 | 73.3 | % | 48.52 | ||||||||||||
| Total Same Store | 6,824 | $ | 36.22 | 68.0 | % | $ | 53.30 | 6,824 | $ | 36.41 | 71.0 | % | $ | 51.31 | ||||||||
| States included in the Regions | |
| Mountain | Idaho and Montana |
| West North Central | Iowa, Kansas, Missouri, Nebraska and South Dakota |
| East North Central | Indiana and Wisconsin |
| Middle Atlantic | Pennsylvania |
| South Atlantic | Delaware, Florida, Georgia, Maryland, North Carolina, South Carolina, Virginia and West Virginia |
| East South Central | Kentucky and Tennessee |
| West South Central | Arkansas and Louisiana |
The following unaudited table presents our RevPAR, ADR and Occupancy, by region, for the nine months ended September 30, 2011 and 2010, respectively. The comparisons of same store operations are for 81* hotels in continuing operations as of January 1, 2010.
| Nine months ended September 30, 2011 | Nine months ended September 30, 2010 | |||||||||||||||||||||
| Same Store | Room | Room | ||||||||||||||||||||
| Region | Count | RevPAR | Occupancy | ADR | Count | RevPAR | Occupancy | ADR | ||||||||||||||
| Mountain | 214 | $ | 34.29 | 67.6 | % | $ | 50.74 | 214 | $ | 34.71 | 70.5 | % | $ | 49.24 | ||||||||
| West North Central | 2,273 | 30.03 | 60.6 | % | 49.51 | 2,273 | 29.06 | 60.8 | % | 47.81 | ||||||||||||
| East North Central | 1,029 | 36.73 | 58.6 | % | 62.69 | 1,029 | 38.77 | 63.7 | % | 60.82 | ||||||||||||
| Middle Atlantic | 142 | 43.32 | 74.3 | % | 58.30 | 142 | 41.46 | 70.5 | % | 58.85 | ||||||||||||
| South Atlantic | 2,233 | 30.74 | 70.0 | % | 43.94 | 2,233 | 29.68 | 70.1 | % | 42.31 | ||||||||||||
| East South Central | 708 | 35.52 | 57.0 | % | 62.33 | 708 | 36.93 | 62.0 | % | 59.59 | ||||||||||||
| West South Central | 225 | 29.68 | 64.5 | % | 45.98 | 225 | 34.94 | 73.9 | % | 47.30 | ||||||||||||
| Total Same Store | 6,824 | $ | 32.24 | 63.6 | % | $ | 50.67 | 6,824 | $ | 32.17 | 65.4 | % | $ | 49.23 | ||||||||
| States included in the Regions | |
| Mountain | Idaho and Montana |
| West North Central | Iowa, Kansas, Missouri, Nebraska and South Dakota |
| East North Central | Indiana and Wisconsin |
| Middle Atlantic | Pennsylvania |
| South Atlantic | Delaware, Florida, Georgia, Maryland, North Carolina, South Carolina, Virginia and West Virginia |
| East South Central | Kentucky and Tennessee |
| West South Central | Arkansas and Louisiana |
* The following properties have been moved from the same store portfolio during the reporting period and classified as held for sale: Shreveport, LA, Days Inn; Omaha (Aksarben), NE, Super 8; Antigo, WI, Super 8; and Columbus, NE, Super 8.
Contact Information:
For Immediate Release
Contact:
Ms. Krista Arkfeld
Director of Corporate Communications
karkfeld@supertelinc.com
Jerry Daly, Carol McCune
Daly Gray
(Media Contact)
703.435.6293
jerry@dalygray.com