NORFOLK, NE--(Marketwire - Nov 14, 2012) - Supertel Hospitality, Inc. (
Third Quarter 2012 Highlights
- Improved revenues from continuing operations 4.7 percent to $22.2 million.
- Bettered RevPAR 0.5 percent to $36.12 for the 72, same-store, continuing operations hotels.
- Reduced loss from continuing operations to $(0.4) million, an improvement of 18.6 percent over the same year-ago period.
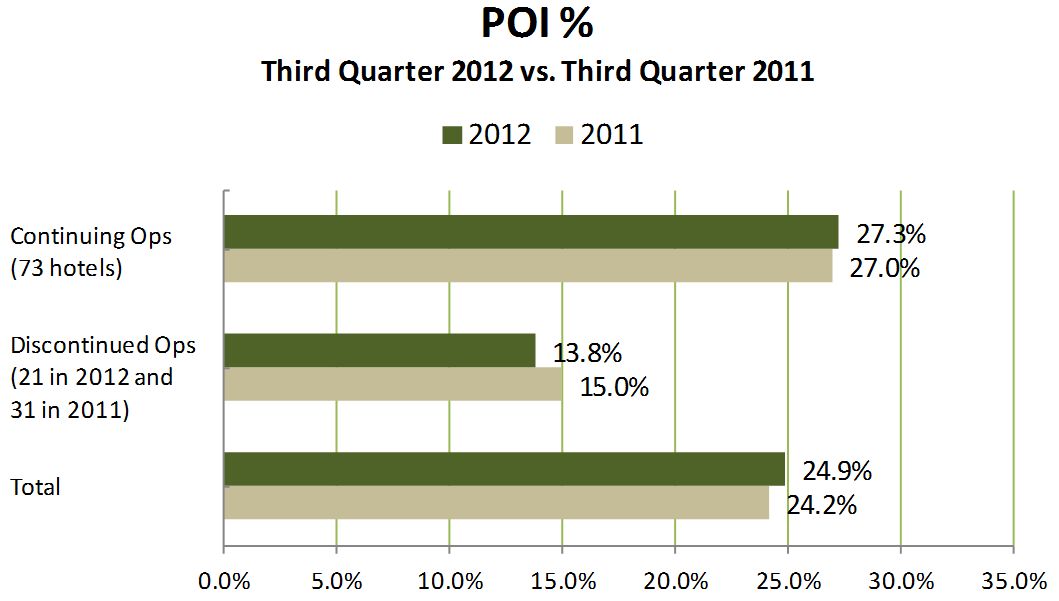
- Increased continuing operations Property Operating Income (POI) to $6.1 million, a 5.9 percent rise.
- Advanced Adjusted EBITDA 1.0 percent to 5.9 million, compared to the same year-ago period.
- Sold an economy hotel, generating gross proceeds of $1.55 million.
- Expanded upper midscale portfolio with an agreement to purchase a 116-room TownePlace Suites in suburban Des Moines (Urbandale), Iowa.
- Refinanced a $28.2 million loan shortly after the close of the 2012 third quarter, replacing it with a $30.6 million loan while reducing annual debt service obligations by approximately $1.1 million.
Third Quarter Operating and Financial Results
Revenues from continuing operations for the 2012 third quarter improved 4.7 percent, or $1.0 million, to $22.2 million, compared to the like year-ago period. The improved performance was led primarily by the first full quarter of the recently acquired Hilton Garden Inn.
The company reported a net loss of $(2.3) million, or $(0.13) per diluted share, for the 2012 third quarter, compared to a net loss of $(1.4) million or $(0.08) per diluted share for the same 2011 period. The third quarter loss includes a non-cash, $1.2 million increase in the fair market value of derivative liabilities, as well as an impairment charge of $2.7 million on properties which are held for sale. This compares to a non-cash $0.3 million impairment in the 2011 third quarter on properties held for sale and $2.2 million impairment on properties held for use. All income and expenses related to sold and held-for-sale hotels are classified as discontinued operations.
Funds from operations (FFO) in the 2012 third quarter was $1.3 million, compared to $2.1 million in the same 2011 period. Adjusted funds from operations (AFFO), which is FFO adjusted to include gains or exclude losses on derivatives and acquisition expense, in the 2012 third quarter was $2.6 million, up 23.9 percent, compared to $2.1 million in the same 2011 period.
Earnings before interest, taxes, depreciation and amortization (EBITDA) declined to $1.6 million from $4.0 million for the third quarter of 2012. Adjusted EBITDA, which is EBITDA before non-controlling interest, net gain/loss on disposition of assets, impairment, preferred stock dividends, unrealized gain/loss on derivatives and acquisition expense, improved to $5.9 million, compared to $5.8 million for the 2011 third quarter.
In the 2012 third quarter, the 72-hotel, same-store portfolio reported revenue per available room (RevPAR) of $36.12, an increase of 0.5 percent, led by a 1.3 percent improvement in ADR to $53.40, partially offset by a 0.9 percent decline in occupancy to 67.6 percent, compared to the 2011 third quarter.
"Supertel continues to make progress in operations," said Kelly A. Walters, Supertel president and CEO. "Equally important, we have also made additional progress in strengthening our balance sheet within the past 30 days."
| Third Quarter 2012 vs Third Quarter 2011 | ||||||||||
| Occ % | ADR ($) | RevPAR ($) | ||||||||
| 2012 | 2011 | Variance | 2012 | 2011 | Variance | 2012 | 2011 | Variance | ||
| Industry - Total US Market | 67.1% | 66.3% | 1.2% | 107.34 | 103.28 | 3.9% | 72.00 | 68.47 | 5.1% | |
| Supertel - Same Store (72 hotels) | 67.6% | 68.2% | -0.9% | 53.40 | 52.71 | 1.3% | 36.12 | 35.93 | 0.5% | |
| Chain Scale | ||||||||||
| Industry - Upper Midscale | 69.2% | 68.3% | 1.4% | 101.28 | 97.63 | 3.7% | 70.12 | 66.67 | 5.2% | |
| Supertel - Upper Midscale (20) | 71.2% | 72.0% | -1.1% | 73.04 | 72.58 | 0.6% | 52.04 | 52.23 | -0.4% | |
| Industry - Midscale | 61.3% | 60.7% | 1.0% | 78.31 | 76.04 | 3.0% | 48.02 | 46.18 | 4.0% | |
| Supertel - Midscale (5) | 59.9% | 52.6% | 13.9% | 63.39 | 64.97 | -2.4% | 37.99 | 34.19 | 11.1% | |
| Industry - Economy | 60.5% | 59.7% | 1.3% | 55.83 | 54.15 | 3.1% | 33.76 | 32.33 | 4.4% | |
| Supertel - Economy (40) | 66.2% | 67.2% | -1.5% | 52.53 | 51.71 | 1.6% | 34.76 | 34.75 | 0.0% | |
| Industry - Extended Stay | n/a | n/a | n/a | n/a | n/a | n/a | n/a | n/a | n/a | |
| Supertel - Extended Stay (7) | 69.3% | 70.5% | -1.7% | 24.77 | 24.08 | 2.9% | 17.16 | 16.98 | 1.1% | |
| Industry Source: STR Monthly Review | ||||||||||
Upscale Hotels
Comparative operating results for the Hilton Garden Inn, which was acquired in the 2012 second quarter, are not reflected in the 72, same-store hotel operating results shown above. For the 2012 third quarter, the hotel generated RevPAR of $94.53, led by $123.43 ADR and 76.6 percent occupancy.
Upper Midscale Hotels
Third quarter RevPAR for the company's 20 continuing operations, upper midscale hotels declined slightly, 0.4 percent, to $52.04, resulting from a 0.6 percent improvement in ADR to $73.04 and a 1.1 percent decrease in occupancy. Upper midscale hotel brands currently in the company's portfolio include Comfort Inns, Comfort Suites, Hampton Inn and Holiday Inn Express.
Midscale Hotels
The RevPAR for the company's five continuing operations, midscale hotels increased significantly, by 11.1 percent, to $37.99. Occupancy increased 13.9 percent slightly offset by a 2.4 percent ADR decrease to $63.39. Supertel's midscale brands include Quality Inn, Sleep Inn and Baymont Inn.
Economy Hotels
The company's 40 continuing operations economy hotels reported essentially flat RevPAR at $34.76 in the 2012 third quarter as a result of a 1.6 percent rise in ADR to $52.53, offset by a 1.5 percent decrease in occupancy. Supertel's branded properties in this segment include Days Inn, Super 8, Key West Inns and Guesthouse Inn.
Extended Stay Hotels
The company's seven continuing operations, extended-stay hotels reported a 1.1 percent increase in RevPAR to $17.16, led by a 2.9 percent increase in ADR to $24.77, partially offset by a 1.7 percent decline in occupancy. Hotels in this segment include the Savannah Suites brand.
"We believe our operators' performance validates our decision to move to a multi-operator model from one central management company," Walters said. "The West South Central and Middle Atlantic regions continue to recover more slowly and more erratically than the nation as a whole. Many of our markets, primarily small towns, have been hard hit, which does not give us as much flexibility as we would like in raising rate. Our properties outperform the industry in occupancy, but these segments are particularly sensitive to room rate. We will continue to focus on fine-tuning the trade-offs between occupancy and rate market-by-market."
Continuing operations interest expense was essentially unchanged at $2.0 million for the quarter. Depreciation and amortization expense from continuing operations increased $0.1 million from the 2011 third quarter to $2.2 million.
Property Operating Income (POI) from continuing operations for the 2012 third quarter rose to $6.1 million, or 5.9 percent, compared to $5.7 million for the same period a year earlier. The increase was led by $0.3 million of POI from the newly acquired Hilton Garden Inn. See attached chart (Property Operating Income Percentage Third Quarter 2012 versus Third Quarter 2011).
POI is calculated as revenue from room rentals and other hotel services less hotel and property operations expenses.
Year-to-Date Operating and Financial Results
Revenues from continuing operations for the nine months ended September 30, 2012, increased 4.3 percent or $2.5 million, to $59.5 million, compared to $57.1 million for the same year-ago period.
Net loss attributable to common shareholders was $(6.1) million, or $(0.26) per diluted share for the nine months ended September 30, 2012, compared to a net loss attributable to common shareholders of $(10.3) million, or $(0.45) per diluted share for the same 2011 period.
RevPAR for the 72 same-store hotels was $33.22, a 1.9 percent increase, compared to the same period in 2011.
FFO for the nine months ended September 30, 2012 was $2.9 million, compared to $3.7 million for the same 2011 period. The company's Adjusted FFO for the 2012 nine-month period was $4.7 million, a 26.4 percent improvement, compared to the $3.7 million reported at September 30, 2011.
EBITDA year-to-date for 2012 was $7.9 million versus $5.5 million compared to the same period in 2011.
Earnings before interest, taxes, depreciation and amortization, impairment, non-controlling interest, net gain/loss on disposition of assets, preferred stock dividends, unrealized gain/loss on derivatives and acquisition expense (Adjusted EBITDA) increased 10.8 percent to $14.4 million, compared to $13.0 million for the prior year's nine-month period.
Acquisition Activity
On September 24, the company entered into an agreement to acquire the TownePlace Suites by Marriott, located in suburban Des Moines (Urbandale), Iowa, for $10.2 million. The 116-room studio-suite hotel opened in December 2007 and is well located off I-80 with multiple business and leisure travel demand generators. The acquisition will be funded with available capital and financing. The closing, which is subject to customary conditions, is expected to occur in the 2012 fourth quarter.
"This acquisition continues our investment strategy of rebuilding our capital with premium-branded, select-service hotels," Walters said. "This extended-stay hotel will be the first property in our portfolio to carry the well-regarded Marriott brand name."
Disposition Program
During the 2012 third quarter, the company sold a Super 8 hotel in Watertown, S.D. for $1.55 million. Proceeds were used to retire the associated debt and for general corporate purposes. Year-to-date, the company has sold seven, non-core assets generating gross proceeds of approximately $14 million.
"We added two hotels to our held-for-sale portfolio, currently 21 properties, during the quarter," Walters said. "As of September 30, 2012, we have six under contract, which are expected to close by year-end, pending financing and other customary closing conditions. Lenders are slowly returning to the market, and interest rates remain at historically low rates, making these properties more attractive acquisition candidates. We have sold and continue to sell our non-core hotels to owners whose cost structure is more favorable for economy and midscale properties than the REIT structure."
Property Renovations
The company has invested $1.3 million in property improvements in the 2012 third quarter. "Typically, renovations cause some temporary revenue displacement, but we expect to receive a positive upswing in occupancy and rate after the hotels complete the upgrades. Looking at the fourth quarter through 2013, we expect to invest $2.5 million to $3.0 million to change the flags at four properties. The reflags result from changing market conditions, brand standard requirements and cost-benefit analysis.
Balance Sheet
The company made several important improvements to its balance sheet in the 2012 third quarter and early in the fourth quarter.
- Completed a significant refinancing of debt through a new $30.6 million loan. The loan proceeds were used to pay the company's debt with Greenwich Capital, previously scheduled to mature on December 1, 2012. The loan, originated by Morgan Stanley Capital Holdings LLC, is expected to be securitized. The loan is secured by 22 hotels and carries a fixed annual interest rate of 5.83%, the prior loan had a 7.5% interest rate. The terms of the loan provide for monthly principal and interest payments based on an 18-year amortization with the principal balance due and payable on December 1, 2017. Eight of the hotels that previously secured the Greenwich Capital loan are now unencumbered. Five of these hotels are held for sale, four of which are currently under contract for sale. "This new loan gives us improved flexibility," said Connie Scarpello, chief financial officer. "Equally important, it will reduce our annual debt service obligations by approximately $1.1 million."
- Hilton Garden Inn, Solomons Island (Dowell), Md. -- Completed on October 19, 2012 a $6.15 million secured loan with Cantor Commercial Real Estate. "The five-year loan, representing approximately 55 percent of the purchase price, carries a fixed interest rate of 4.24% per annum, based on a 30-year amortization," said Connie Scarpello, chief financial officer.
- TownePlace Suites by Marriott, Des Moines -- Currently negotiating to borrow approximately $6 million to complete the previously announced $10.2 million acquisition of this 116-room property.
"We continue our efforts to reduce our leverage," she noted. "The loan-to-value on the 22-hotel portfolio, recently financed by Morgan Stanley, is in the 55 percent range, which is in line with our long-term goal. As of September 30, 2012, outstanding debt on our continuing operations hotels was $113.7 million, with an average term to maturity of three years and a weighted average annual interest rate of 6.4 percent."
Dividends
The company did not declare a common stock dividend for the 2012 third quarter. Preferred dividends have continued uninterrupted. The company will monitor requirements to maintain its REIT status and will routinely evaluate the dividend policy. The company intends to continue to meet its dividend requirements to retain its REIT status.
Outlook
"We are improving our balance sheet and our hotels' operations, and we continually seek opportunities to increase the pace of our improvement," Walters said.
"Looking to next year, the outlook for supply growth remains low, especially in our markets. Forecasters predict continued RevPAR growth next year, but at a slower pace than 2012. Our economy is slowly rebounding, but its impact has not fully benefited our principally small-town markets. We are encouraged by our progress and are confident that the strategy we enacted nearly two years ago is taking us in the right direction."
About Supertel Hospitality, Inc.
Supertel Hospitality, Inc. (
Forward Looking Statement
Certain matters within this press release are discussed using forward-looking language as specified in the Private Securities Litigation Reform Act of 1995, and, as such, may involve known and unknown risks, uncertainties and other factors that may cause the actual results or performance to differ from those projected in the forward-looking statement. These risks are discussed in the Company's filings with the Securities and Exchange Commission.
| Supertel Hospitality, Inc. |
| Balance Sheet |
| As of September 30, 2012, and December 31, 2011 |
| (Dollars in thousands, except share and per share data) |
The Company owned 94 hotels (including 21 hotels in discontinued operations) at September 30, 2012, and 105 hotels as of December 31, 2011 respectively.
| As of | |||||||||||
| September 30, | December 31, | ||||||||||
| 2012 | 2011 | ||||||||||
| (unaudited) | |||||||||||
| ASSETS | |||||||||||
| Investments in hotel properties | $ | 258,251 | $ | 249,763 | |||||||
| Less accumulated depreciation | 78,306 | 75,074 | |||||||||
| 179,945 | 174,689 | ||||||||||
| Cash and cash equivalents | 656 | 279 | |||||||||
| Accounts receivable, net of allowance for doubtful accounts of $195 and $194 | 2,718 | 1,891 | |||||||||
| Prepaid expenses and other assets | 10,650 | 8,917 | |||||||||
| Deferred financing costs, net | 597 | 850 | |||||||||
| Investment in hotel properties, held for sale, net | 22,767 | 34,546 | |||||||||
| $ | 217,333 | $ | 221,172 | ||||||||
| LIABILITIES AND EQUITY | |||||||||||
| LIABILITIES | |||||||||||
| Accounts payable, accrued expenses and other liabilities | $ | 12,393 | $ | 10,704 | |||||||
| Derivative liabilities, at fair value | 17,267 | - | |||||||||
| Debt related to hotel properties held for sale | 22,285 | 37,904 | |||||||||
| Long-term debt | 113,715 | 127,941 | |||||||||
| 165,660 | 176,549 | ||||||||||
| Redeemable noncontrolling interest in consolidated partnership,at redemption value | 114 |
114 |
|||||||||
| Redeemable preferred stock | |||||||||||
| 10% Series B, 800,000 shares authorized; $.01 par value, 332,500 shares outstanding, liquidation preference of $8,312 | 7,662 |
7,662 |
|||||||||
| EQUITY | |||||||||||
| Shareholders' equity | |||||||||||
| Preferred stock, 40,000,000 shares authorized; | |||||||||||
| 8% Series A, 2,500,000 shares authorized, $.01 par value, 803,270 shares outstanding, liquidation preference of $8,033 | 8 |
8 |
|||||||||
| 6.25% Series C, 3,000,000 shares authorized, $.01 par value, 3,000,000 shares outstanding, liquidation preference of $30,000 | 30 |
- |
|||||||||
| Common stock, $.01 par value, 200,000,000 shares authorized; 23,137,202 and 23,070,387 shares outstanding. | 231 | 231 | |||||||||
| Common stock warrants | 252 | 252 | |||||||||
| Additional paid-in capital | 134,776 | 121,619 | |||||||||
| Distributions in excess of retained earnings | (91,527 | ) | (85,398 | ) | |||||||
| Total shareholders' equity | 43,770 | 36,712 | |||||||||
| Noncontrolling interest | |||||||||||
| Noncontrolling interest in consolidated partnership, redemption value $102 and $64 | 127 | 135 | |||||||||
| Total equity | 43,897 | 36,847 | |||||||||
| COMMITMENTS AND CONTINGENCIES | |||||||||||
| $ | 217,333 | $ | 221,172 | ||||||||
| Supertel Hospitality, Inc. | |||||||||||||||||
| Results of Operations | |||||||||||||||||
| For the three and nine months ended September 30, 2012 and 2011, respectively | |||||||||||||||||
| (Unaudited-Dollars in thousands, except per share data) | |||||||||||||||||
| Three Months Ended | Nine Months Ended | ||||||||||||||||
| September 30, | September 30, | ||||||||||||||||
| 2012 | 2011 | 2012 | 2011 | ||||||||||||||
| REVENUES | (unaudited) | (unaudited) | |||||||||||||||
| Room rentals and other hotel services | $ | 22,192 | $ | 21,199 | $ | 59,545 | $ | 57,089 | |||||||||
| EXPENSES | |||||||||||||||||
| Hotel and property operations | 16,132 | 15,475 | 44,200 | 43,108 | |||||||||||||
| Depreciation and amortization | 2,223 | 2,139 | 6,473 | 6,582 | |||||||||||||
| General and administrative | 943 | 906 | 2,957 | 3,010 | |||||||||||||
| Acquisition, termination expense | 15 | 0 | 178 | 1 | |||||||||||||
| Termination cost | - | - | - | 540 | |||||||||||||
| 19,313 | 18,520 | 53,808 | 53,241 | ||||||||||||||
| EARNINGS BEFORE NET LOSS ON DISPOSITIONS OF ASSETS, OTHER INCOME, INTEREST EXPENSE AND INCOME TAXES | 2,879 | 2,679 | 5,737 | 3,848 | |||||||||||||
| Net loss on dispositions of assets | 11 | 1,139 | 5 | 1,125 | |||||||||||||
| Other income (expense) | (1,138 | ) | 2 | (1,478 | ) | 107 | |||||||||||
| Interest expense | (1,964 | ) | (1,975 | ) | (6,051 | ) | (6,344 | ) | |||||||||
| Impairment | - | (2,227 | ) | (3,714 | ) | (6,010 | ) | ||||||||||
| LOSS FROM CONTINUING OPERATIONS BEFORE INCOME TAXES | (212 | ) | (382 | ) | (5,501 | ) | (7,274 | ) | |||||||||
| Income tax (expense) benefit | (212 | ) | (139 | ) | (111 | ) | 339 | ||||||||||
| LOSS FROM CONTINUING OPERATIONS | (424 | ) | (521 | ) | (5,612 | ) | (6,935 | ) | |||||||||
| Gain (loss) from discontinued operations, net of tax | (1,842 | ) | (883 | ) | 1,816 | (2,292 | ) | ||||||||||
| NET LOSS | (2,266 | ) | (1,404 | ) | (3,796 | ) | (9,227 | ) | |||||||||
| Noncontrolling interest | 1 | (8 | ) | (1 | ) | 5 | |||||||||||
| NET LOSS ATTRIBUTABLE TO CONTROLLING INTERESTS | (2,265 | ) | (1,412 | ) | (3,797 | ) | (9,222 | ) | |||||||||
| Preferred stock dividends | (837 | ) | (369 | ) | (2,332 | ) | (1,105 | ) | |||||||||
| NET LOSS ATTRIBUTABLE TO COMMON SHAREHOLDERS | $ | (3,102 | ) | $ | (1,781 | ) | $ | (6,129 | ) | $ | (10,327 | ) | |||||
| NET INCOME (LOSS) PER COMMON SHARE - BASIC AND DILUTED | |||||||||||||||||
| EPS from continuing operations | $ | (0.05 | ) | $ | (0.04 | ) | $ | (0.34 | ) | $ | (0.35 | ) | |||||
| EPS from discontinued operations | $ | (0.08 | ) | $ | (0.04 | ) | $ | 0.08 | $ | (0.10 | ) | ||||||
| EPS Basic and Diluted | $ | (0.13 | ) | $ | (0.08 | ) | $ | (0.26 | ) | $ | (0.45 | ) | |||||
RECONCILIATION OF NON-GAAP FINANCIAL MEASURES
FFO and AFFO
FFO and Adjusted FFO ("AFFO") are non-GAAP financial measures. We consider FFO and AFFO to be market accepted measures of an equity REIT's operating performance, which are necessary, along with net earnings (loss), for an understanding of our operating results. FFO, as defined under the National Association of Real Estate Investment Trusts (NAREIT) standards, consists of net income computed in accordance with GAAP, excluding gains (or losses) from sales of real estate assets, plus depreciation and amortization of real estate assets. We believe our method of calculating FFO complies with the NAREIT definition. AFFO is FFO adjusted to include gain or exclude losses on derivative liabilities, which is a non-cash charge against income and which does not represent results from our core operations. AFFO also adds back acquisition costs. FFO and AFFO do not represent amounts available for management's discretionary use because of needed capital replacement or expansion, debt service obligations, or other commitments and uncertainties. FFO and AFFO should not be considered as alternatives to net income (loss) (computed in accordance with GAAP) as an indicator of our liquidity, nor are they indicative of funds available to fund our cash needs, including our ability to pay dividends or make distributions. All REITs do not calculate FFO and AFFO in the same manner; therefore, our calculation may not be the same as the calculation of FFO and AFFO for similar REITs.
Diluted FFO per share and diluted Adjusted FFO per share are computed after adjusting the numerator and denominator of the basic computation for the effects of any dilutive potential common shares outstanding during the period. Up to 30,000,000 shares of common stock may be issued upon conversion of the Series C convertible preferred stock, and adjustments are made for these shares in the computation of diluted FFO per share and diluted Adjusted FFO per share. The Company's outstanding warrants to purchase common stock and stock options would be antidilutive and are not included in the dilution computation.
We use FFO and AFFO as performance measures to facilitate a periodic evaluation of our operating results relative to those of our peers. We consider FFO and AFFO to be useful additional measures of performance for an equity REIT because it facilitates an understanding of the operating performance of our properties without giving effect to real estate depreciation and amortization, which assume that the value of real estate assets diminishes predictably over time. Since real estate values have historically risen or fallen with market conditions, we believe that FFO and AFFO provide a meaningful indication of our performance.
| (Unaudited-In thousands, except per share data) | ||||||||||||||||
| Three months | Nine Months | |||||||||||||||
| ended September 30, | ended September 30, | |||||||||||||||
| 2012 | 2011 | 2012 | 2011 | |||||||||||||
| RECONCILIATION OF NET LOSS TO FFO | ||||||||||||||||
| Net loss attributable to common shareholders | $ | (3,102 | ) | $ | (1,781 | ) | $ | (6,129 | ) | $ | (10,327 | ) | ||||
| Depreciation and amortization | 2,256 | 2,420 | 6,652 | 7,684 | ||||||||||||
| Net gain loss on disposition of assets | (564 | ) | (1,126 | ) | (5,827 | ) | (1,461 | ) | ||||||||
| Impairment | 2,732 | 2,561 | 8,249 | 7,823 | ||||||||||||
| FFO available to common shareholders | $ | 1,322 | $ | 2,074 | $ | 2,945 | $ | 3,719 | ||||||||
| Unrealized loss on derivatives | 1,232 | - | 1,578 | - | ||||||||||||
| Acquisition expense | 15 | - | 178 | 1 | ||||||||||||
| Adjusted FFO | $ | 2,569 | $ | 2,074 | $ | 4,701 | $ | 3,720 | ||||||||
| FFO available to common shareholders | $ | 1,322 | $ | 2,074 | $ | 2,945 | $ | 3,719 | ||||||||
| Dividends paid on series C convertible preferred stock | 469 | - | 1,227 | - | ||||||||||||
| FFO for FFO per share - diluted | $ | 1,791 | $ | 2,074 | $ | 4,172 | $ | 3,719 | ||||||||
| Adjusted FFO available to common shareholders | $ | 2,569 | $ | 2,074 | $ | 4,701 | $ | 3,720 | ||||||||
| Dividends paid on series C convertible preferred stock | 469 | - | 1,227 | - | ||||||||||||
| Adjusted FFO for Adjusted FFO per share - diluted | $ | 3,038 | $ | 2,074 | $ | 5,928 | $ | 3,720 | ||||||||
| Weighted average number of shares outstanding for: | ||||||||||||||||
| calculation of FFO per share - basic | 23,084 | 23,005 | 23,076 | 22,963 | ||||||||||||
| calculation of FFO per share - diluted | 53,091 | 23,005 | 49,225 | 22,963 | ||||||||||||
| FFO per share - basic | $ | 0.06 | $ | 0.09 | $ | 0.13 | $ | 0.16 | ||||||||
| Adjusted FFO per share - basic | $ | 0.11 | $ | 0.09 | $ | 0.20 | $ | 0.16 | ||||||||
| FFO per share - diluted | $ | 0.03 | $ | 0.09 | $ | 0.08 | $ | 0.16 | ||||||||
| Adjusted FFO per share - diluted | $ | 0.06 | $ | 0.09 | $ | 0.12 | $ | 0.16 | ||||||||
EBITDA and Adjusted EBITDA
EBITDA and Adjusted EBITDA are financial measures that are not calculated in accordance with accounting principles generally accepted in the United States of America ("GAAP"). We calculate EBITDA and Adjusted EBITDA by adding back to net earnings (loss) available to common shareholders certain non-operating expenses and non-cash charges which are based on historical cost accounting and we believe may be of limited significance in evaluating current performance. We believe these adjustments can help eliminate the accounting effects of depreciation and amortization and financing decisions and facilitate comparisons of core operating profitability between periods, even though EBITDA and Adjusted EBITDA also do not represent an amount that accrues directly to common shareholders. In calculating Adjusted EBITDA, we add back noncontrolling interest, net (gain) loss on disposition of assets, preferred stock dividends and acquisition expenses which are cash charges. We also add back impairment and unrealized gain or loss on derivatives, which are non-cash charges.
EBITDA and Adjusted EBITDA do not represent cash generated from operating activities determined by GAAP and should not be considered as alternatives to net income, cash flow from operations or any other operating performance measure prescribed by GAAP. EBITDA and Adjusted EBITDA are not measures of our liquidity, nor are they indicative of funds available to fund our cash needs, including our ability to make cash distributions. Neither do the measurements reflect cash expenditures for long-term assets and other items that have been and will be incurred. EBITDA and Adjusted EBITDA may include funds that may not be available for management's discretionary use due to functional requirements to conserve funds for capital expenditures, property acquisitions, and other commitments and uncertainties. To compensate for this, management considers the impact of these excluded items to the extent they are material to operating decisions or the evaluation of our operating performance. Adjusted EBITDA, as presented, may not be comparable to similarly titled measures of other companies.
| (Unaudited-In thousands, except statistical data) | |||||||||||||||||
| Three months | Nine months | ||||||||||||||||
| ended September 30, | ended September 30, | ||||||||||||||||
| 2012 | 2011 | 2012 | 2011 | ||||||||||||||
| RECONCILIATION OF NET LOSS TO ADJUSTED EBITDA | |||||||||||||||||
| Net loss attributable to common shareholders | $ | (3,102 | ) | $ | (1,781 | ) | $ | (6,129 | ) | $ | (10,327 | ) | |||||
| Interest expense, including discontinued operations | 2,372 | 3,462 | 7,599 | 9,426 | |||||||||||||
| Income tax expense (benefit), including discontinued operations | 83 | (111 | ) | (225 | ) | (1,238 | ) | ||||||||||
| Depreciation and amortization, including discontinued operations | 2,256 | 2,420 | 6,652 | 7,684 | |||||||||||||
| EBITDA | 1,609 | 3,990 | 7,897 | 5,545 | |||||||||||||
| Noncontrolling interest | (1 | ) | 8 | 1 | (5 | ) | |||||||||||
| Net gain on disposition of assets | (564 | ) | (1,126 | ) | (5,827 | ) | (1,461 | ) | |||||||||
| Impairment | 2,732 | 2,561 | 8,249 | 7,823 | |||||||||||||
| Preferred stock dividend | 837 | 369 | 2,332 | 1,105 | |||||||||||||
| Unrealized loss on derivatives | 1,232 | - | 1,578 | - | |||||||||||||
| Acquisition expense | 15 | - | 178 | 1 | |||||||||||||
| ADJUSTED EBITDA | $ | 5,860 | $ | 5,802 | $ | 14,408 | $ | 13,008 | |||||||||
| Supertel Hospitality, Inc. | |||||||||||||||
| Operating Statistics by Chain Scale Classification - Hotels in Continuing Operations | |||||||||||||||
| For the three and nine months ended September 30, 2012 and 2011, respectively | |||||||||||||||
| (Unaudited - In thousands, except per share data) | |||||||||||||||
| Unaudited-In thousands, except statistical data: | Three months | Nine months | |||||||||||||
| ended September 30, | ended September 30, | ||||||||||||||
| 2012 | 2011 | 2012 | 2011 | ||||||||||||
| Same Store: | |||||||||||||||
| Revenue per available room (RevPAR): | |||||||||||||||
| Upper Midscale | $ | 52.04 | $ | 52.23 | $ | 48.37 | $ | 46.41 | |||||||
| Midscale | $ | 37.99 | $ | 34.19 | $ | 33.74 | $ | 30.25 | |||||||
| Economy | $ | 34.76 | $ | 34.75 | $ | 31.26 | $ | 31.37 | |||||||
| Extended Stay | $ | 17.16 | $ | 16.98 | $ | 17.47 | $ | 17.45 | |||||||
| Total | $ | 36.12 | $ | 35.93 | $ | 33.22 | $ | 32.59 | |||||||
| Average daily room rate (ADR): | |||||||||||||||
| Upper Midscale | $ | 73.04 | $ | 72.58 | $ | 70.94 | $ | 70.18 | |||||||
| Midscale | $ | 63.39 | $ | 64.97 | $ | 63.98 | $ | 62.87 | |||||||
| Economy | $ | 52.53 | $ | 51.71 | $ | 50.43 | $ | 49.43 | |||||||
| Extended Stay | $ | 24.77 | $ | 24.08 | $ | 24.62 | $ | 23.76 | |||||||
| Total | $ | 53.40 | $ | 52.71 | $ | 51.41 | $ | 50.10 | |||||||
| Occupancy percentage: | |||||||||||||||
| Upper Midscale | 71.2 | % | 72.0 | % | 68.2 | % | 66.1 | % | |||||||
| Midscale | 59.9 | % | 52.6 | % | 52.7 | % | 48.1 | % | |||||||
| Economy | 66.2 | % | 67.2 | % | 62.0 | % | 63.5 | % | |||||||
| Extended Stay | 69.3 | % | 70.5 | % | 71.0 | % | 73.4 | % | |||||||
| Total | 67.6 | % | 68.2 | % | 64.6 | % | 65.0 | % | |||||||
| *Same store reflects 72 hotels. | |||||||||||||||
| Supertel Hospitality, Inc. |
| Property Operating Income (POI) - Continuing and Discontinued Operations |
Note: This presentation includes non-GAAP financial measures. The Company believes that the presentation of hotel property operating income (POI) is helpful to investors, and represents a useful description of its operations, as it communicates the comparability of its hotels' operating results.
| Unaudited-In thousands, except statistical data: | Three months | Nine months | |||||||||||||||
| ended September 30, | ended September 30, | ||||||||||||||||
| 2012 | 2011 | 2012 | 2011 | ||||||||||||||
| Total Same Store Hotels: | |||||||||||||||||
| Revenue per available room (RevPAR): | $ | 36.12 | $ | 35.93 | $ | 33.22 | $ | 32.59 | |||||||||
| Average daily room rate (ADR): | $ | 53.40 | $ | 52.71 | $ | 51.41 | $ | 50.10 | |||||||||
| Occupancy percentage: | 67.6 | % | 68.2 | % | 64.6 | % | 65.0 | % | |||||||||
| Continuing Operations | |||||||||||||||||
| Revenue from room rentals and other hotel services consists of: | |||||||||||||||||
| Room rental revenue | $ | 21,497 | $ | 20,550 | $ | 57,711 | $ | 55,313 | |||||||||
| Telephone revenue | 71 | 75 | 219 | 220 | |||||||||||||
| Other hotel service revenues | 624 | 574 | 1,615 | 1,556 | |||||||||||||
| Total revenue from room rentals and other hotel services | $ | 22,192 | $ | 21,199 | $ | 59,545 | $ | 57,089 | |||||||||
| Hotel and property operations expense | |||||||||||||||||
| Total hotel and property operations expense | $ | 16,132 | $ | 15,475 | $ | 44,200 | $ | 43,108 | |||||||||
| Property Operating Income ("POI") | |||||||||||||||||
| Total property operating income | $ | 6,060 | $ | 5,724 | $ | 15,345 | $ | 13,981 | |||||||||
| POI as a percentage of revenue from room rentals and other hotel services | |||||||||||||||||
| Total POI as a percentage of revenue | 27.3 | % | 27.0 | % | 25.8 | % | 24.5 | % | |||||||||
| Discontinued Operations | |||||||||||||||||
| Room rentals and other hotel services | |||||||||||||||||
| Total room rental and other hotel services | $ | 4,714 | $ | 6,552 | $ | 14,641 | $ | 18,984 | |||||||||
| Hotel and property operations expense | |||||||||||||||||
| Total hotel and property operations expense | $ | 4,065 | $ | 5,570 | $ | 12,721 | $ | 16,464 | |||||||||
| Property Operating Income ("POI") | |||||||||||||||||
| Total property operating income | $ | 649 | $ | 982 | $ | 1,920 | $ | 2,520 | |||||||||
| POI as a percentage of revenue from room rentals and other hotel services | |||||||||||||||||
| Total POI as a percentage of revenue | 13.8 | % | 15.0 | % | 13.1 | % | 13.3 | % | |||||||||
| Three months | Nine months | ||||||||||||||||
| ended September 30 | ended September 30 | ||||||||||||||||
| 2012 | 2011 | 2012 | 2011 | ||||||||||||||
| RECONCILIATION OF NET LOSS FROM CONTINUING OPERATIONS TO POI FROM CONTINUING OPERATIONS | |||||||||||||||||
| Net loss from continuing operations | $ | (424 | ) | $ | (521 | ) | $ | (5,612 | ) | $ | (6,935 | ) | |||||
| Depreciation and amortization | 2,223 | 2,139 | 6,473 | 6,582 | |||||||||||||
| Net loss on disposition of assets. | (11 | ) | (1,139 | ) | (5 | ) | (1,125 | ) | |||||||||
| Other (income) expense | 1,138 | (2 | ) | 1,478 | (107 | ) | |||||||||||
| Interest expense | 1,964 | 1,975 | 6,051 | 6,344 | |||||||||||||
| General and administrative expense | 943 | 906 | 2,957 | 3,010 | |||||||||||||
| Acquisition, termination expense | 15 | - | 178 | 1 | |||||||||||||
| Termination cost | - | - | - | 540 | |||||||||||||
| Income tax (benefit) expense | 212 | 139 | 111 | (339 | ) | ||||||||||||
| Impairment expense | - | 2,227 | 3,714 | 6,010 | |||||||||||||
| POI - continuing operations | $ | 6,060 | $ | 5,724 | $ | 15,345 | $ | 13,981 | |||||||||
| Reconciliation of gain (loss) from discontinued operations to POI - discontinued operations: | Three months | Nine months | |||||||||||||||
| ended September 30, | ended September 30, | ||||||||||||||||
| 2012 | 2011 | 2012 | 2011 | ||||||||||||||
| Gain (loss) from discontinued operations | $ | (1,842 | ) | $ | (883 | ) | $ | 1,816 | $ | (2,292 | ) | ||||||
| Depreciation and amortization from discontinued operations | 33 | 281 | 179 | 1,102 | |||||||||||||
| Net gain on disposition of assets from discontinued operations | (553 | ) | 13 | (5,822 | ) | (336 | ) | ||||||||||
| Interest expense from discontinued operations | 408 | 1,487 | 1,548 | 3,082 | |||||||||||||
| General and administrative expense from discontinued operations | - | - | - | 50 | |||||||||||||
| Impairment losses from discontinued operations | 2,732 | 334 | 4,535 | 1,813 | |||||||||||||
| Income tax benefit from discontinued operations | (129 | ) | (250 | ) | (336 | ) | (899 | ) | |||||||||
| POI - discontinued operations | $ | 649 | $ | 982 | $ | 1,920 | $ | 2,520 | |||||||||
| Reconciliation of Total POI: | Three months | Nine months | |||||||||||||||
| ended September 30, | ended September 30, | ||||||||||||||||
| 2012 | 2011 | 2012 | 2011 | ||||||||||||||
| POI - Continuing operations | 6,060 | 5,724 | 15,345 | 13,981 | |||||||||||||
| POI- Discontinued operations | 649 | 982 | 1,920 | 2,520 | |||||||||||||
| Total - POI | $ | 6,709 | $ | 6,706 | $ | 17,265 | $ | 16,501 | |||||||||
| Total POI as a percentage of revenues | 24.9 | % | 24.2 | % | 23.3 | % | 21.7 | % | |||||||||
| Supertel Hospitality, Inc. |
| Operating Statistics by Region |
| For the three months ended September 30, 2012 and 2011, respectively |
| (Unaudited - In thousands, except per share data) |
The comparisons of same store operations are for 72 hotels in continuing operations as of July 1, 2011.
| Three months ended September 30, 2012 | Three months ended September 30, 2011 | |||||||||||||||||||||
| Room | Room | |||||||||||||||||||||
| Region | Count | RevPAR | Occupancy | ADR | Count | RevPAR | Occupancy | ADR | ||||||||||||||
| Mountain | 214 | $ | 46.72 | 82.4 | % | $ | 56.68 | 214 | $ | 44.27 | 80.9 | % | $ | 54.70 | ||||||||
| West North Central | 1,559 | 37.53 | 70.5 | % | 53.27 | 1,559 | 36.79 | 70.5 | % | 52.21 | ||||||||||||
| East North Central | 978 | 45.99 | 68.5 | % | 67.19 | 978 | 44.17 | 66.2 | % | 66.76 | ||||||||||||
| Middle Atlantic | 142 | 48.58 | 77.7 | % | 62.50 | 142 | 50.60 | 83.1 | % | 60.92 | ||||||||||||
| South Atlantic | 2,388 | 30.08 | 66.8 | % | 45.04 | 2,388 | 30.01 | 67.1 | % | 44.70 | ||||||||||||
| East South Central | 563 | 42.62 | 65.3 | % | 65.26 | 563 | 43.41 | 66.9 | % | 64.93 | ||||||||||||
| West South Central | 373 | 22.12 | 50.0 | % | 44.19 | 373 | 26.89 | 59.4 | % | 45.29 | ||||||||||||
| Total Same Store | 6,217 | $ | 36.12 | 67.6 | % | $ | 53.40 | 6,217 | $ | 35.93 | 68.2 | % | $ | 52.71 | ||||||||
| South Atlantic Acquisitions | 100 | $ | 94.53 | 76.6 | % | $ | 123.43 | - | $ | - | 0.0 | % | $ | - | ||||||||
| Total Acquisitions | 100 | $ | 94.53 | 76.6 | % | $ | 123.43 | - | $ | - | 0.0 | % | $ | - | ||||||||
| Total | 6,317 | $ | 37.05 | 67.8 | % | $ | 54.66 | 6,217 | $ | 35.93 | 68.2 | % | $ | 52.71 | ||||||||
| States included in the Regions | ||||||
| Mountain | Idaho and Montana | |||||
| West North Central | Iowa, Kansas, Missouri, Nebraska and South Dakota | |||||
| East North Central | Indiana and Wisconsin | |||||
| Middle Atlantic | Pennsylvania | |||||
| South Atlantic | Florida, Georgia, Maryland, North Carolina, South Carolina, Virginia and West Virginia | |||||
| East South Central | Kentucky and Tennessee | |||||
| West South Central | Arkansas and Louisiana | |||||
| Supertel Hospitality, Inc. |
| Operating Statistics by Region |
| For the nine months ended September 30, 2012 and 2011, respectively |
| (Unaudited - In thousands, except per share data) |
The comparisons of same store operations are for 72 hotels in continuing operations as of January 1, 2011.
| Nine months ended September 30, 2012 | Nine months ended September 30, 2011 | |||||||||||||||||||||
| Room | Room | |||||||||||||||||||||
| Region | Count | RevPAR | Occupancy | ADR | Count | RevPAR | Occupancy | ADR | ||||||||||||||
| Mountain | 214 | $ | 37.46 | 71.4 | % | $ | 52.46 | 214 | $ | 34.29 | 67.6 | % | $ | 50.74 | ||||||||
| West North Central | 1,559 | 32.95 | 64.1 | % | 51.38 | 1,559 | 32.03 | 64.3 | % | 49.79 | ||||||||||||
| East North Central | 978 | 37.62 | 59.9 | % | 62.76 | 978 | 36.87 | 59.1 | % | 62.40 | ||||||||||||
| Middle Atlantic | 142 | 44.78 | 73.9 | % | 60.64 | 142 | 43.32 | 74.3 | % | 58.30 | ||||||||||||
| South Atlantic | 2,388 | 30.25 | 68.0 | % | 44.49 | 2,388 | 29.56 | 68.5 | % | 43.14 | ||||||||||||
| East South Central | 563 | 40.66 | 61.9 | % | 65.73 | 563 | 38.89 | 59.5 | % | 65.35 | ||||||||||||
| West South Central | 373 | 23.49 | 53.7 | % | 43.75 | 373 | 28.53 | 64.8 | % | 44.03 | ||||||||||||
| Total Same Store | 6,217 | $ | 33.22 | 64.6 | % | $ | 51.41 | 6,217 | $ | 32.59 | 65.0 | % | $ | 50.10 | ||||||||
| South Atlantic Acquisitions | 100 | $ | 94.10 | 75.8 | % | $ | 124.16 | - | $ | - | 0.0 | % | $ | - | ||||||||
| Total Acquisitions | 100 | $ | 94.10 | 75.8 | % | $ | 124.16 | - | $ | - | 0.0 | % | $ | - | ||||||||
| Total | 6,317 | $ | 33.68 | 64.7 | % | $ | 52.05 | 6,217 | $ | 32.59 | 65.0 | % | $ | 50.10 | ||||||||
| States included in the Regions | ||||||||||||||||||||||
| Mountain | Idaho and Montana | |||||||||||||||||||||
| West North Central | Iowa, Kansas, Missouri, Nebraska and South Dakota | |||||||||||||||||||||
| East North Central | Indiana and Wisconsin | |||||||||||||||||||||
| Middle Atlantic | Pennsylvania | |||||||||||||||||||||
| South Atlantic | Florida, Georgia, Maryland, North Carolina, South Carolina, Virginia and West Virginia | |||||||||||||||||||||
| East South Central | Kentucky and Tennessee | |||||||||||||||||||||
| West South Central | Arkansas and Louisiana | |||||||||||||||||||||
| Note: The following properties have been moved from the same store portfolio during the reporting period and classified as held for sale: Ellenton, Florida, Ramada Limited; Dover, Delaware, Comfort Suites | ||||||||||||||||||||||
Contact Information:
Contact:
Ms. Krista Arkfeld
Director of Corporate Communications
karkfeld@supertelinc.com